What is a watchlist in trading?
By MichaelUpdated August 27, 2026
A watchlist is a saved list of markets a trader monitors together, each row showing its current price and how it has moved. It replaces checking instruments one at a time with a single view, so a change in one market can be spotted while attention is on another.
How does a watchlist work?
A trader can only look at one chart properly at a time, but the opportunity is rarely in the chart they happen to be looking at. A watchlist solves that by reducing every market they care about to a single row: what it costs now, how far it has moved, and how much has traded.
That reduction is the point. A row is not enough to trade from, and it is not meant to be. It is enough to answer one question, which is whether this market is doing anything worth turning attention to. Everything a chart shows, a watchlist deliberately throws away, in exchange for being able to hold twenty markets in view instead of one.
The second thing a watchlist does is act as a starting point. Something on the list moves, and the natural next action is to open it properly. A watchlist that cannot do that is a display; one that can is the front door to the rest of the workspace.
What should a watchlist show?
Price, because it is the anchor everything else is read against.
Change over a period, usually 24 hours in markets that trade continuously. This is the column that actually does the scanning. Price alone means nothing without knowing what it was.
Volume, because a move on heavy volume and the same move on nothing are different events. Change tells you something happened; volume tells you whether anyone was involved.
Activity, such as the number of trades, which separates a move made by many participants from one made by a few.
Size measures such as market capitalization, which give the move context. Two percent on a large, liquid market is a much bigger event than two percent on a small one.
How do you organize a watchlist?
Sort by what you are looking for. Sorted by change, the list becomes a movers board and the extremes sit at the ends. Sorted by volume, it becomes a ranking of where activity actually is. Sorted alphabetically, it becomes a stable reference where each market is always in the same place, which matters more than it sounds when you are looking for one specific thing under pressure.
Keep it short. A watchlist you have to scroll is a watchlist you are not really watching. The value comes from taking in the whole thing at a glance, and that ends somewhere around fifteen or twenty rows.
Mix uncorrelated markets. A list of ten things that all move together is one market shown ten times. Including instruments that respond to different drivers is what makes the list informative rather than repetitive.
What is a market heatmap?
A market heatmap draws each market on a watchlist as a rectangle instead of a row, sized by a chosen measure and colored by its move. Big movers become large and bright, quiet markets shrink into the corner, and the whole list resolves into a picture rather than a table.
The reason to use one is speed. A table requires reading; a heatmap is taken in at a glance. When the question is simply what is happening right now, the shape and color of the layout answers it before any number has been read.
The tradeoff is precision. A heatmap is good at ranking and terrible at exact values, so it suits scanning and the table suits checking. Most traders use both, switching between them depending on which question they are asking.
Note that this is a different tool from an order book heatmap, which maps resting liquidity at each price on a single market. A market heatmap compares many markets; an order book heatmap looks inside one.
What are the limits of a watchlist?
It is a summary, not analysis. A row tells you something moved. It cannot tell you why, or whether the move is the start of something or the end of it.
24 hours is an arbitrary window. A market flat over 24 hours may have traveled a long way and come back. The change column hides the path.
It goes stale. Watchlists accumulate. Markets get added during a moment of interest and never removed, and a list built for last year’s conditions quietly stops being useful.
Attention is still finite. Twenty rows updating at once is not twenty markets being watched. It is twenty markets available to be noticed, which only works if the list is short enough to actually take in.
Related: Time and sales · Order book · DOM · Volume · Open interest
Using the Watchlist widget in MMT
MMT’s Watchlist holds crypto alongside equities, indices, commodities and FX in the same list, so gold, oil, the S&P and BTC can be watched together rather than in separate applications. Every column sorts, every row opens into the rest of the workspace, and the whole thing switches to a heatmap with one button.
How do you add the Watchlist widget?
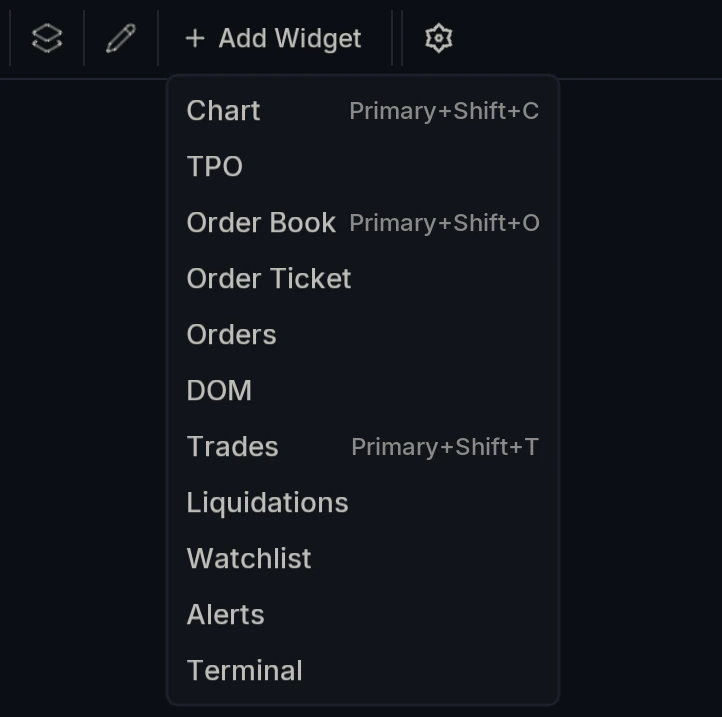
Open Add Widget and choose Watchlist.
What do the columns show?
Symbol carries the market and an exchange logo, then Price, 24H % and 24H Vol.
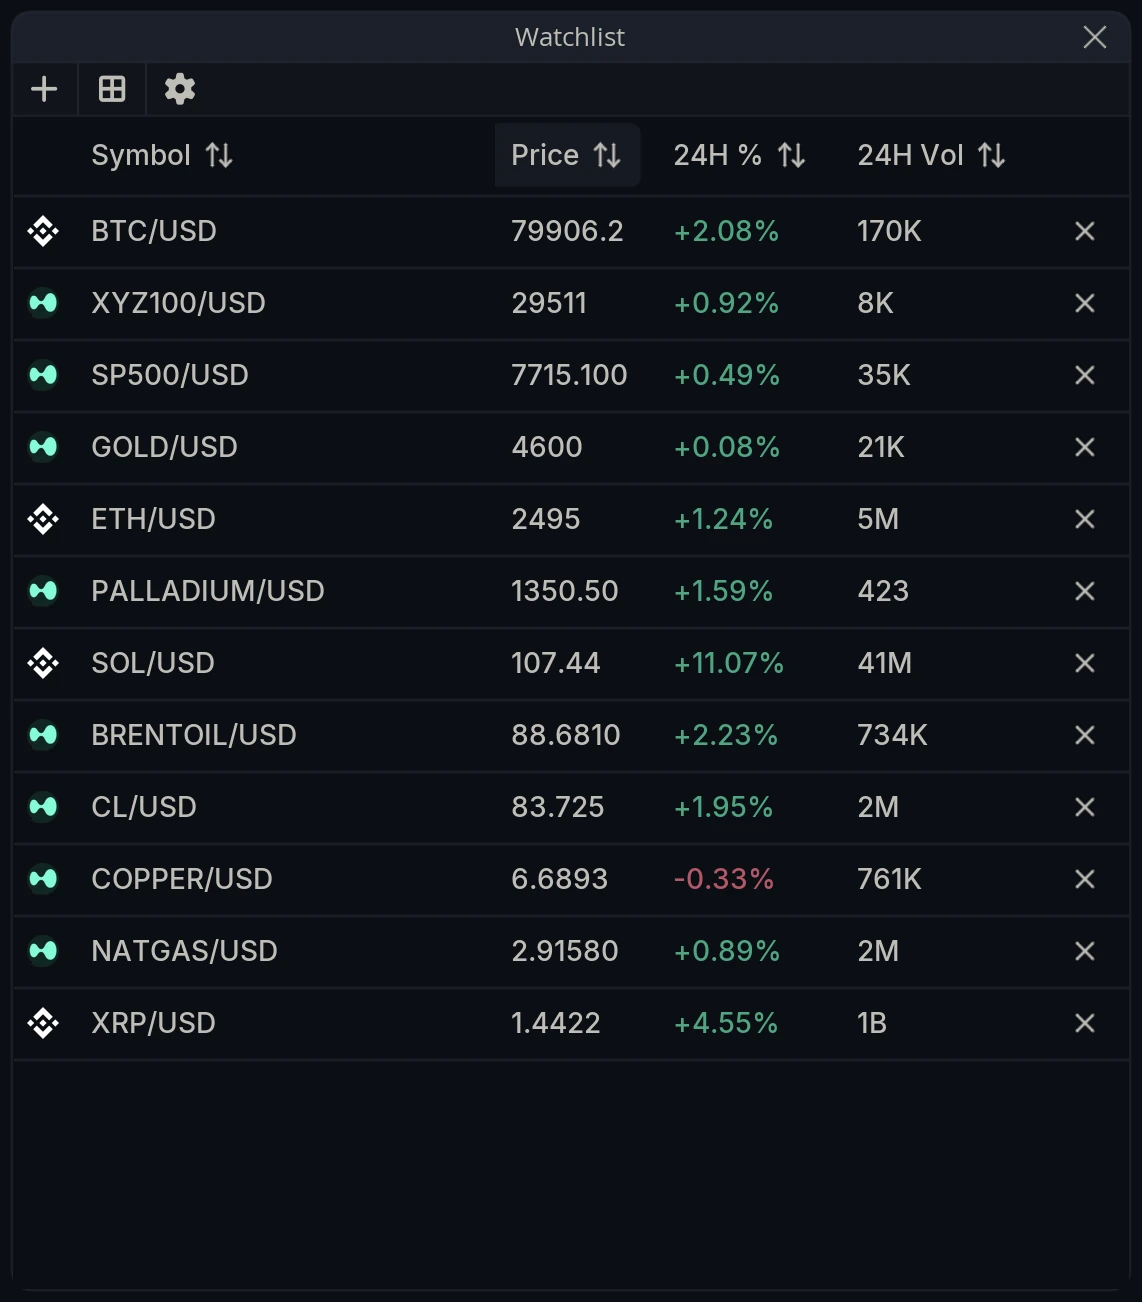
Every column header sorts. Click one to order the list by it, click again to reverse it. That single behavior is what makes the widget several tools at once: sorted by 24H % it is a movers board, sorted by 24H Vol it is a ranking of where the activity is, and sorted by Symbol it is a stable reference where nothing moves around.
The capture above is sorted by Price, which is why gold and the S&P sit above BTC and XRP is at the bottom.
How do you open a symbol from the list?
Click a row and it loads into the active chart widget.
Right click and a menu opens with more options. Set active chart does the same thing explicitly, and Open widget launches that symbol in a new Chart, TPO, Order Book, DOM, Trades or Liquidations widget.
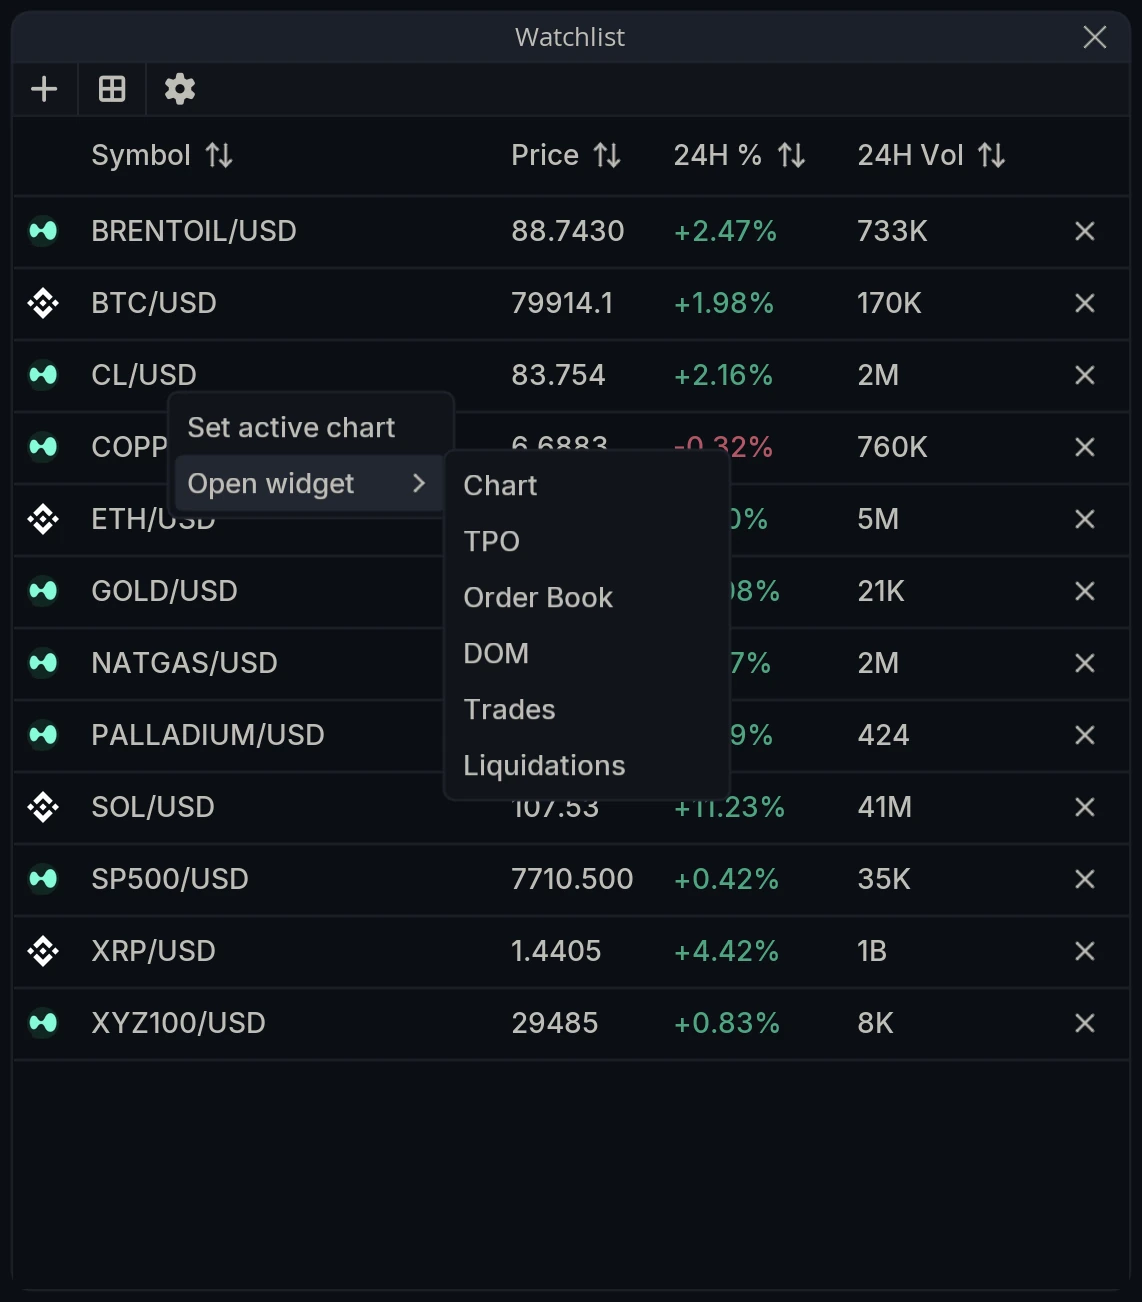
This is what makes the widget the front door rather than a display. Something on the list moves, and one right click puts it in front of you with the order book, the DOM or the tape already open on it.
Which columns can you show?
The cog opens the column list: Price, 24H %, 24H Vol, 24H Trades, Market Cap and FDV. Check the ones you want.
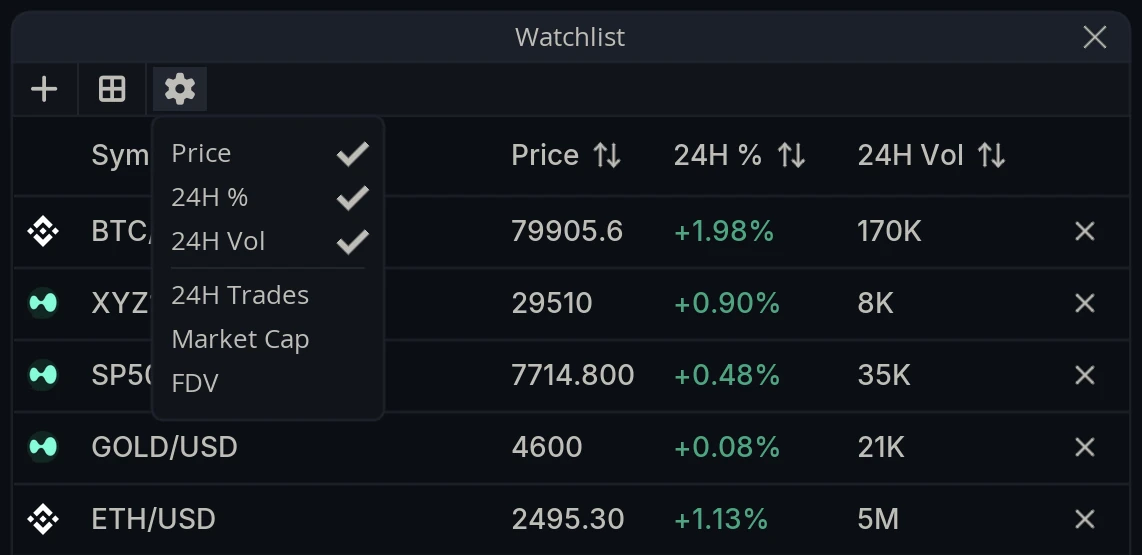
Fewer columns means a narrower widget, which matters when the Watchlist is sharing a layout with everything else.
What can you put on a watchlist?
The + button adds symbols, and the choice is not limited to crypto. Crypto, Equities, Indices, Commodities and FX are all available, so a single list can hold BTC next to gold, crude, the S&P and a currency pair.
That is worth setting up deliberately. Crypto does not trade in isolation, and having the instruments that actually drive it on the same list as the instruments you trade is the difference between seeing a move and understanding it.
How do you switch to the heatmap?
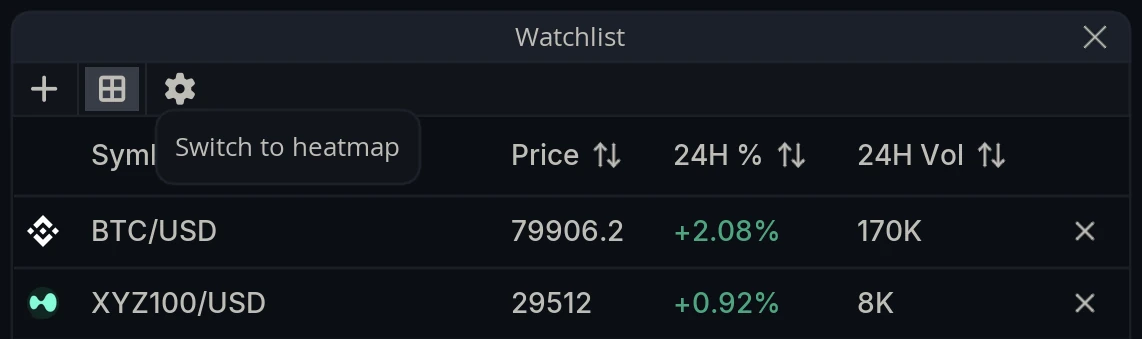
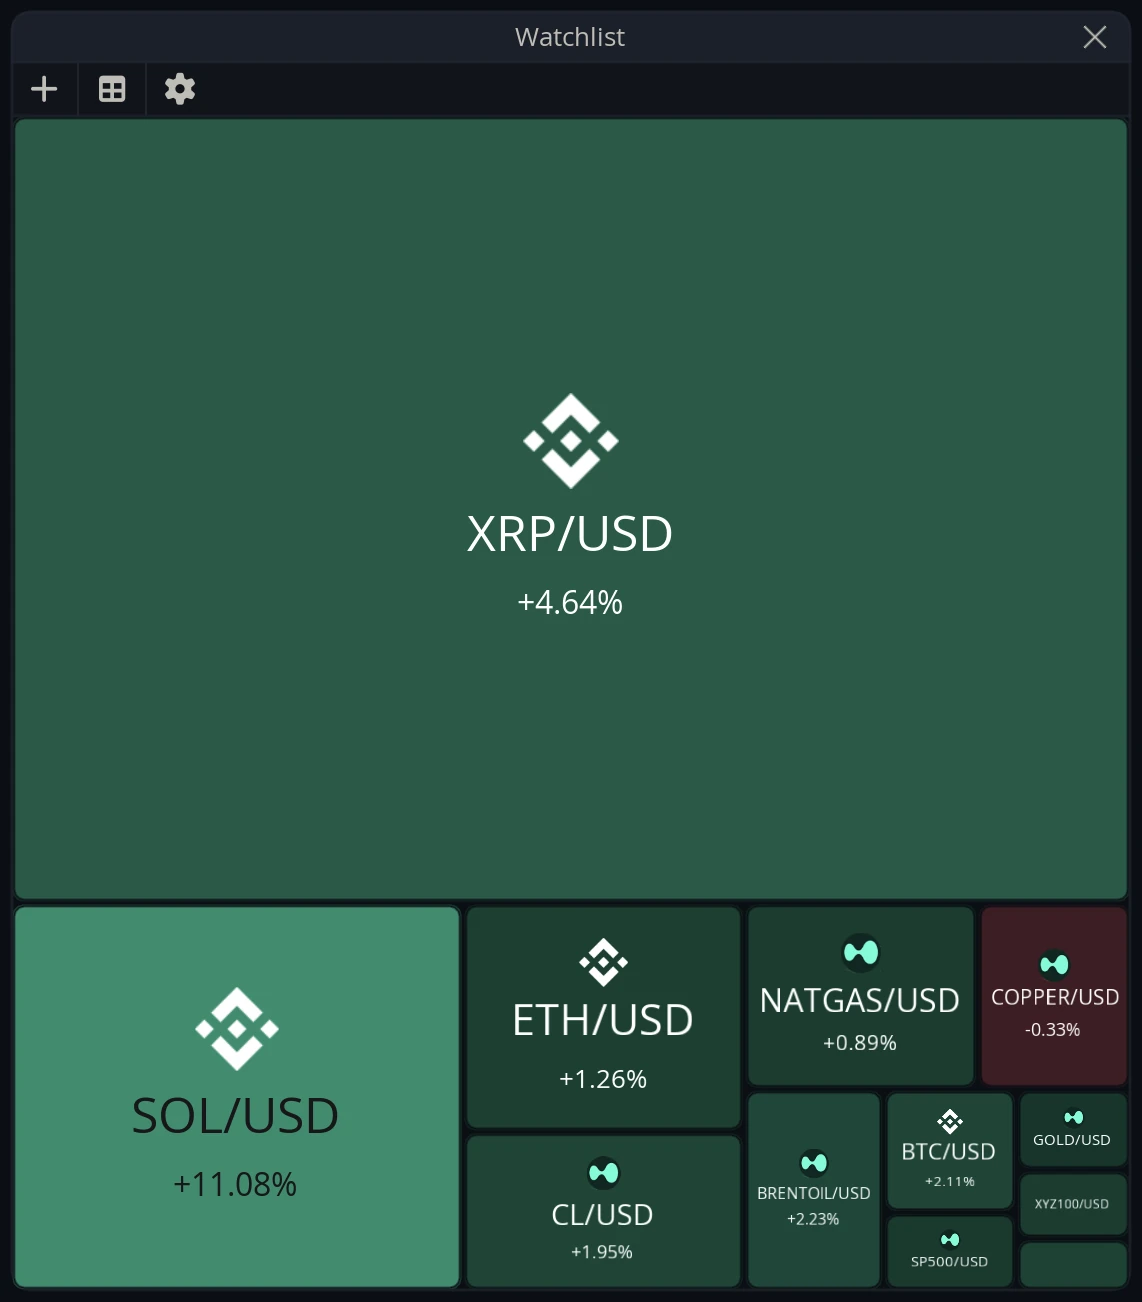
The grid button on the toolbar, labeled Switch to heatmap, changes the list into a treemap.
Each market becomes a tile. The same button switches back.
How do you configure the heatmap?
The cog opens a different menu in heatmap mode.
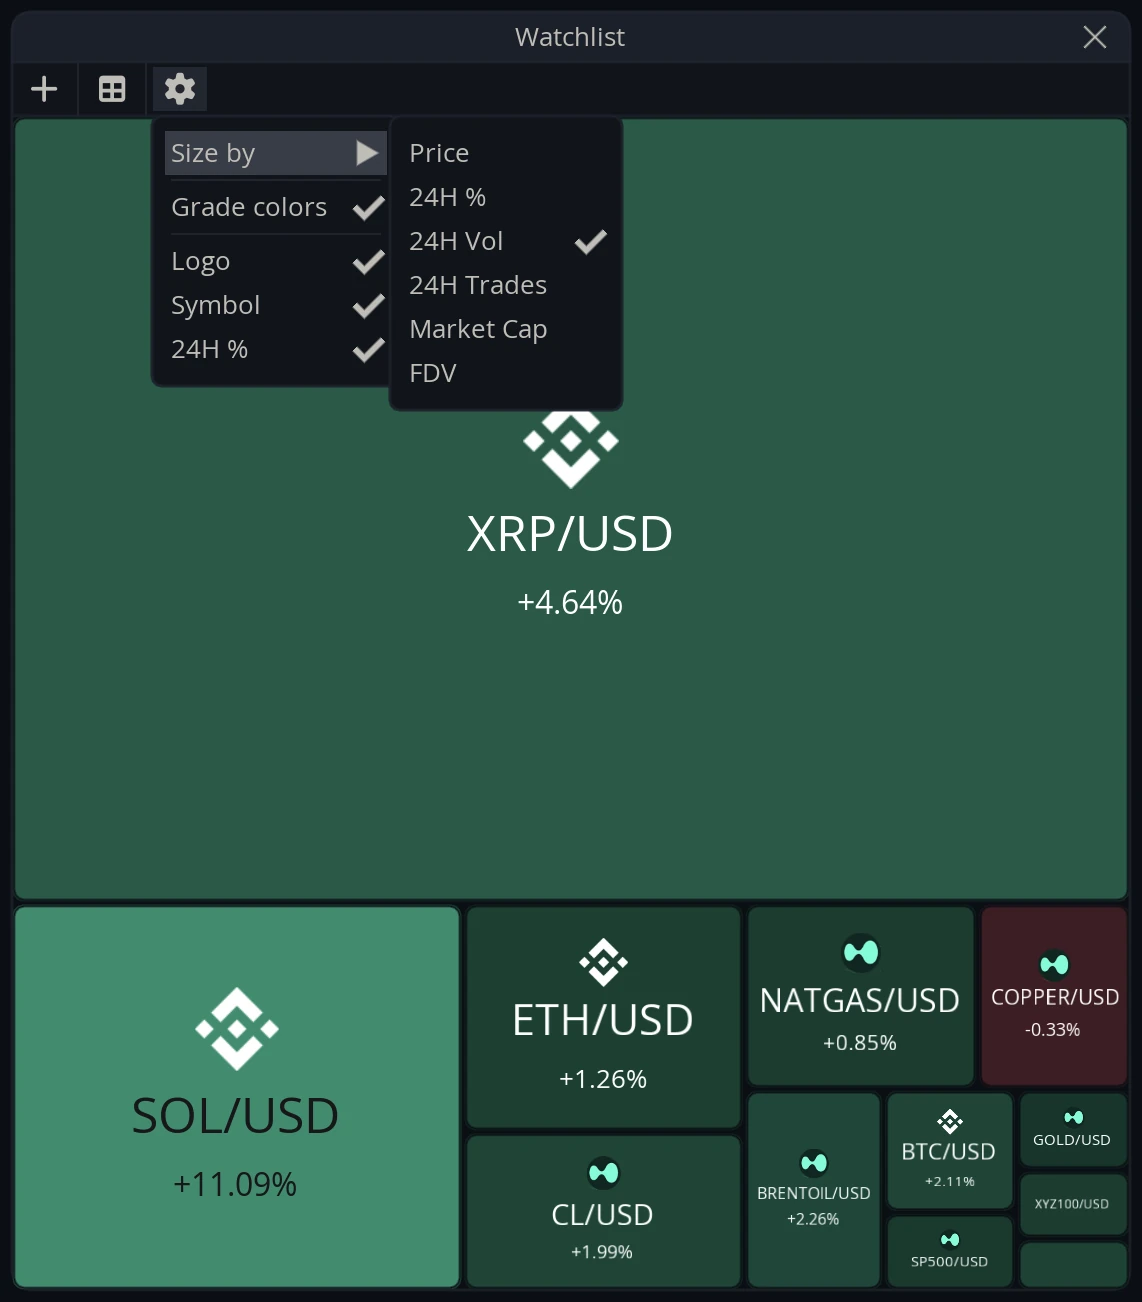
Size by chooses the measure the tiles are sized against: Price, 24H %, 24H Vol, 24H Trades, Market Cap or FDV. Pick one and the layout reorders accordingly, largest first.
Grade colors shades each tile by that same scale rather than filling every tile alike, with negative values in red. Logo, Symbol and 24H % control what is printed inside each tile, which is worth turning down when the list is long and the small tiles get crowded.
Widget Settings
The Watchlist has no separate settings panel. The cog on the toolbar carries everything, and what it offers depends on which mode the widget is in.
List mode
Price / 24H % / 24H Vol / 24H Trades / Market Cap / FDV - Show or hide each column.
Heatmap mode
Size by - The measure tile sizes are based on: Price, 24H %, 24H Vol, 24H Trades, Market Cap or FDV.
Grade colors - Shade tiles by that same scale, with negative values in red.
Logo - Print the exchange logo inside each tile.
Symbol - Print the market name inside each tile.
24H % - Print the 24 hour change inside each tile.