What is a funding rate?
By MichaelUpdated August 26, 2026
A funding rate is a periodic payment between the long and short holders of a perpetual futures contract. When the rate is positive longs pay shorts; when it is negative shorts pay longs. It exists to keep the perpetual's price tethered to spot, since the contract never expires to settle the difference.
How does a funding rate work?
An ordinary futures contract has an expiry. Whatever the price does in between, at expiry it settles against the spot market, and that guaranteed convergence is what stops the two drifting apart: anyone can arbitrage the gap knowing it must close.
A perpetual contract has no expiry, so it has no such anchor. Left alone it could trade at any premium or discount to spot indefinitely. Funding is the mechanism invented to replace the missing convergence.
It works by making the crowded side pay. If the perpetual trades above spot, the rate turns positive and longs pay shorts at each funding interval. Holding a long now costs money and holding a short earns it, which pulls participants toward the short side and the premium back toward zero. If the perpetual trades below spot the mechanism runs in reverse, with shorts paying longs.
The payment goes between traders, not to the exchange, and it is charged at set intervals, most commonly every eight hours, though venues differ. The rate is quoted as a percentage of position value, so it is a cost of carry: small per interval, meaningful when held.

What does the funding rate tell you about positioning?
This is where funding stops being a fee and becomes information.
The rate is a direct readout of which side is crowded. Positive funding means the perpetual is trading at a premium, which means longs are paying for the privilege of staying long. Negative funding means the opposite. Nobody has to guess at sentiment: the crowded side is the one writing the checks.
Sustained extremes are the useful reading. Funding that has been strongly positive for days describes a market where leveraged longs have piled in and are paying to stay there. That is fuel: those positions are expensive to hold, which makes their owners impatient, and impatient leveraged positions are the ones that unwind fastest when price turns against them. The same logic applies inverted to sustained negative funding and short squeezes.
A flip through zero is worth noting too. Funding crossing from positive to negative means the premium has gone: the market that was paying to be long is now paying to be short. That shift in who is crowded often accompanies a genuine change in control rather than a pause.
How do you read funding against price?
Funding is far more informative read alongside price than alone.
Price rising, funding positive and climbing. The rally is being driven by leveraged longs who are paying more and more to hold. It can continue, but it is expensive and crowded, and the further funding stretches the more violent the unwind tends to be.
Price rising, funding negative. A rally that shorts are paying for. The people positioned against the move are being charged to stay wrong, which is the healthier version of an advance and often the more durable one.
Price falling, funding still positive. Longs have not capitulated. They are paying to hold through a decline, which means the positioning that would fuel further downside is still in place.
Price falling, funding negative and deepening. Shorts have taken over and are paying for it. Crowded short positioning into weakness is what squeezes tend to be built from.
The pattern beneath all four is the same one that runs through open interest and net positioning: a move backed by the side that is paying to hold it is more fragile than one backed by the side that is being paid.
What are the limits of funding rates?
It is a rate, not a trigger. Extreme funding can persist for weeks. It describes a condition and says nothing about when that condition will resolve.
It is venue-specific. Each exchange sets its own rate on its own contract, with its own interval, formula and caps. Rates are not directly comparable between venues, and a crowded book on one exchange is not the whole market.
Intervals differ. A rate quoted per eight hours and one quoted per hour are not the same number. Compare like with like, and annualize before drawing conclusions about cost.
It describes perpetuals only. Spot markets have no funding, and dated futures use expiry rather than payments to converge.
Related: Open interest · Net positioning · Liquidations · CVD
Using Funding Rate in MMT
MMT’s Funding Rate plots the rate in its own panel below the price chart, positive intervals above the baseline and negative below, so runs of crowded positioning are visible at a glance.
How do you add Funding Rate to a chart?
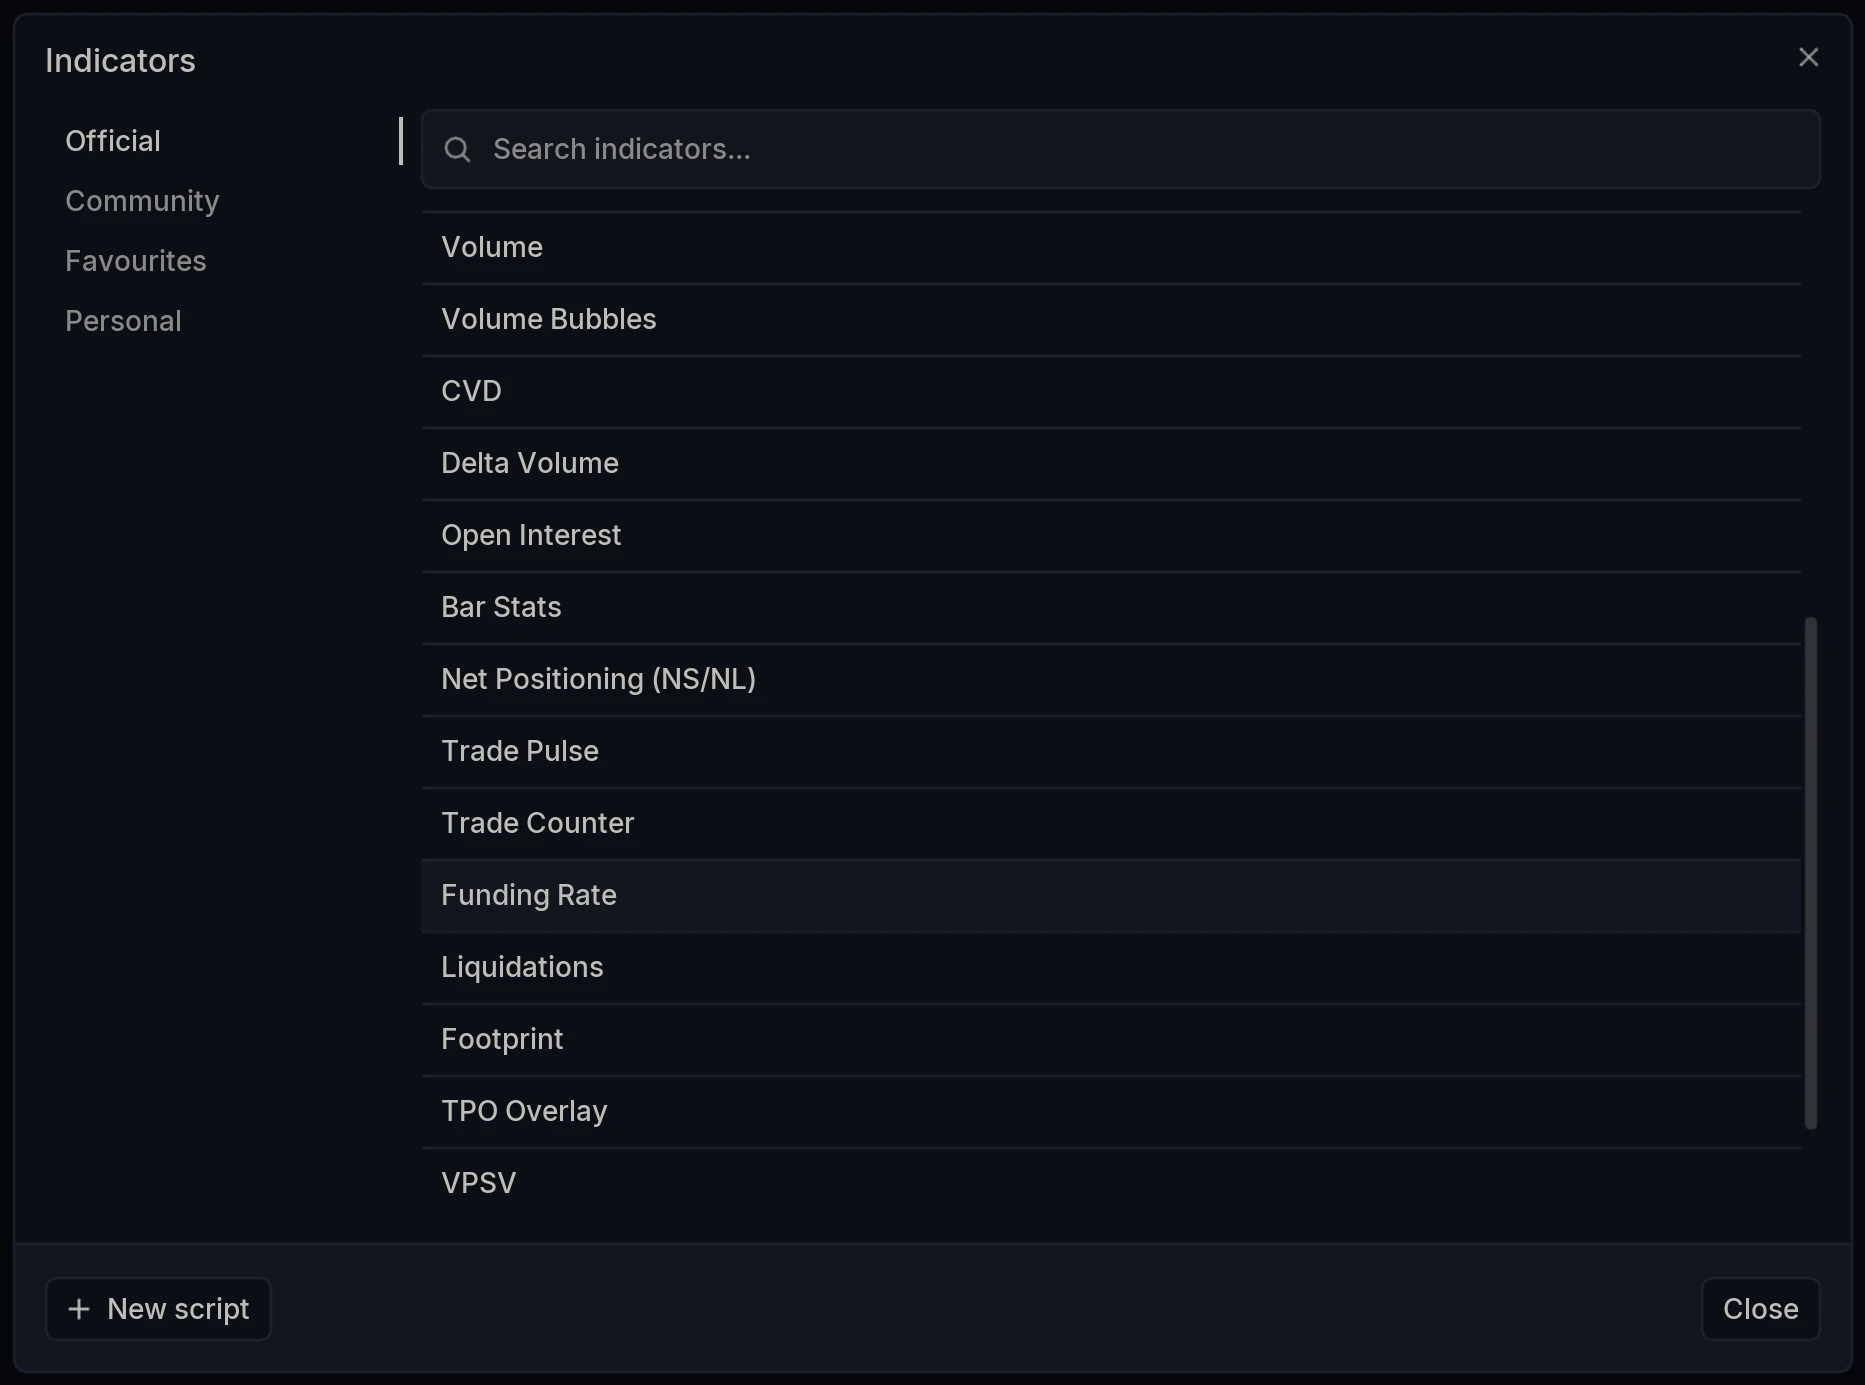
Open the Indicators dialog and select Funding Rate under Official.
Histogram or line?
Plot style offers Histogram or Line.
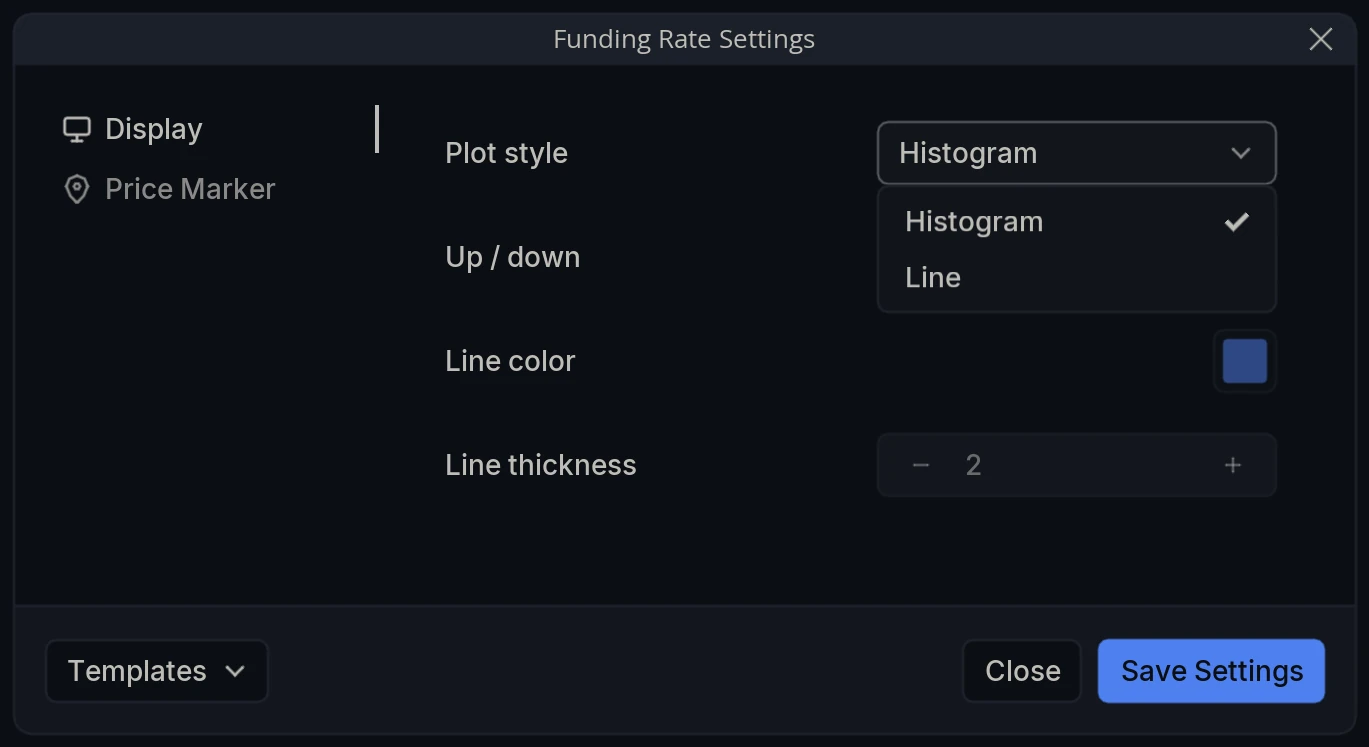
Histogram draws one bar per funding interval, colored by sign with the Up / down colors. This is the more useful default, because funding is paid in discrete intervals rather than continuously, and the histogram shows it that way. It also makes runs obvious: a solid block of one color is a stretch where the same side paid every single time.
Line joins the values into a continuous path in the Line color, which suits comparing the shape of funding against the shape of price over a longer stretch.
Why is there no Aggregate tab?
Unlike most layers, Funding Rate has no market selector. Funding is not a measurement taken from trading activity that can be pooled across venues; it is a rate each exchange sets for its own contract, on its own schedule. There is nothing to aggregate, so the panel reports the rate for the market your chart is on, named in the layer label.
Layer Settings
Open Funding Rate Settings via the cog wheel on the layer name. The panel has two tabs: Display and Price Marker.
Display
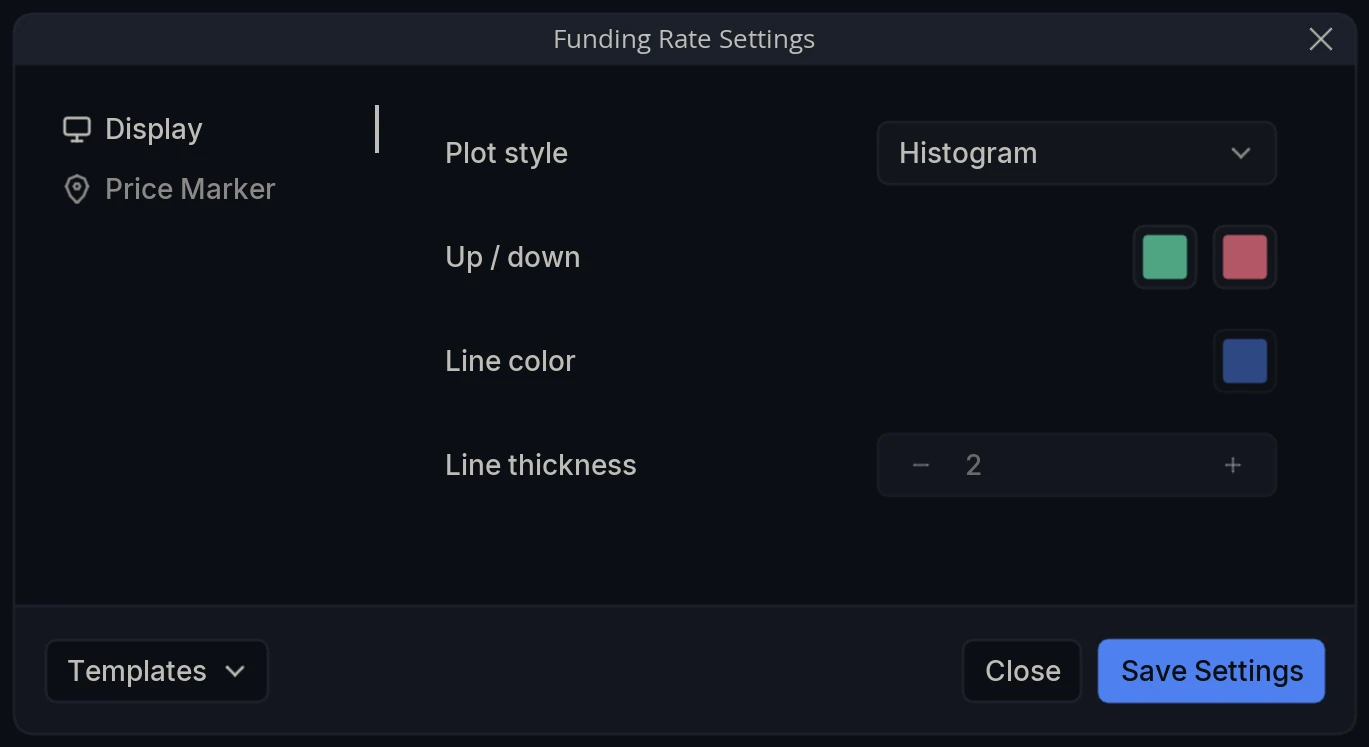
Plot style - How the rate is drawn: Histogram or Line.
Up / down - The two colors used for positive and negative intervals in Histogram style.
Line color - Color of the plot in Line style.
Line thickness - Thickness of that line. Active in Line style only.
Price Marker
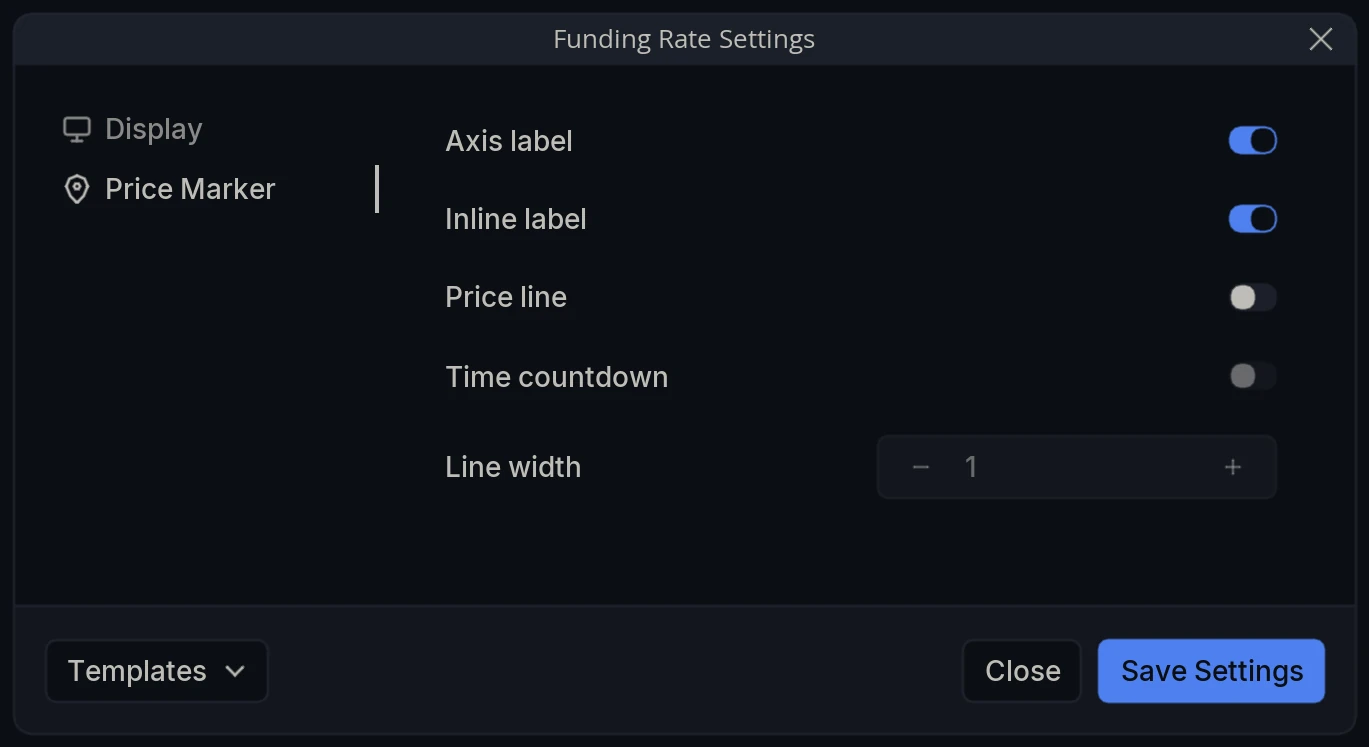
Axis label - Show the current value as a label on the panel’s axis.
Inline label - Show that value on the panel itself rather than on the axis.
Price line - Draw a horizontal line across the panel at the current value.
Time countdown - Show the time remaining until the current candle closes.
Line width - Thickness of that line.