What are liquidation, stop loss and take profit heatmaps?
By MichaelUpdated August 27, 2026
Liquidation, stop loss and take profit heatmaps show where open positions will be closed, plotted as bands of color at those prices. Liquidations mark forced exits, stop losses mark voluntary ones and take profits mark targets, so together they map every level where pending orders are waiting to fire.
How do liquidation, stop loss and take profit heatmaps work?
Every open position has prices at which it will be closed. One is set by the exchange: the liquidation price, where margin runs out and the position is closed whether the trader likes it or not. The others are set by the trader: a stop loss below to cap the damage, a take profit above to bank the gain. All three sit dormant until price reaches them, and then they fire.
That dormancy is the point. None of these are resting limit orders in the visible book, so an order book heatmap cannot see any of them. They are conditional instructions held by the exchange, invisible until they trigger, at which moment each becomes a market order and moves price. An entire layer of pending liquidity therefore exists that ordinary book data cannot show.
A heatmap of those orders makes it visible. Every pending exit is plotted at the price it will trigger, and the more that sit at one level, the brighter that level renders. What you end up with is a map of where the market is committed to acting rather than where it says it might.
Whether that map is a fact or a guess depends entirely on the data behind it. Most venues publish nothing about pending exits or real liquidation prices, so tools that claim to show them are modelling from entries and assumed leverage. Where a venue exposes the underlying detail, the levels can be read directly rather than inferred, which is a categorically different thing.
Why do these levels matter?
Because they do not all behave the same way when reached, and each changes what price does next.
A liquidation is the hardest accelerant. It closes a position at market with no discretion at all: the order must fill, at whatever price is available, in the direction price is already going. Reaching a cluster of them supplies forced flow that pushes price further, potentially into the next cluster, which is the cascade mechanic behind the fastest moves in leveraged markets. Liquidations covers the mechanism in full.
A stop loss is the same accelerant one step earlier. It closes a losing position at market, in the direction price is already moving. Longs stopping out sell into a fall; shorts stopping out buy into a rally. The difference from a liquidation is that a stop is the trader’s own choice of level, so stops usually sit closer to price than liquidations do and fire first.
A take profit is a brake. It closes a winning position, which means trading against the direction price is moving. Longs taking profit sell into a rally; shorts taking profit buy into a fall. A dense band of targets is supply or demand waiting to meet the move, and price often stalls there.
That opposition is what makes the three worth reading together. Take profits mark where a move meets resistance; stops and liquidations mark where it gets faster. A level with heavy targets, and heavy stops just beyond it, describes a very specific setup: resistance first, then acceleration if it breaks.
How do you read the three maps?
Read each one on its own first, then look at what they say together.
Confluence is the strongest reading. Levels where stops and liquidations sit at the same price are where two kinds of forced selling or buying fire at once. Those are the levels most likely to produce a violent move if reached, because a single trigger sets off both.
Position matters more than volume. Where the orders sit relative to price tells you how the market is positioned, without needing any other tool. Stops below the current price means traders are in longs, because a long’s stop sits underneath it. Take profits below price means traders are in shorts, because a short’s target is beneath it. Reading the side of the map that lights up is reading the crowd’s direction.
Watch the pattern shift. The maps are not static. A build-up of stops migrating from below price to above it is the crowd changing sides, and it usually happens before the price chart makes that obvious.
Follow the liquidation levels as they move. Liquidation prices travel with price as positions are added to, and the amounts at each level change as traders scale out or add size. A cluster thinning out means people are leaving those positions gradually; a cluster growing means they are committing harder. Tracking that over a session tells you whether leverage is being taken off or piled on, and where.
How is this different from an estimated liquidation map?
A conventional liquidation heatmap is a model. It works from where positions appear to have been opened and at what leverage they plausibly ran, projects each one forward to the price that would close it, and adds them up. The output is genuinely useful and it is an estimate, resting on assumptions that cannot be verified.
A heatmap built from actual position data is not modelling anything. The stop is where the trader put it, the target is where the trader put it, and the liquidation price follows from the position as it actually stands.
The practical difference is how much weight a level deserves. An estimated cluster is a reasonable guess about where forced flow might appear. A known cluster is a fact about orders that exist.
What are the limits?
It covers one venue. This data exists where it can be obtained, which is not everywhere. It describes the participants on that exchange, not the whole market.
Orders can be moved or canceled. A stop is an instruction, not a commitment. Traders widen stops, trail them, and remove them, so the map describes the current state rather than a fixed future.
Everyone can see it. Visible clusters change behavior. Some participants avoid placing orders where the crowd has, others aim for them deliberately.
It says nothing about timing. A cluster can sit untouched indefinitely. The map describes where, never when.
Related: Liquidation heatmap · Liquidations · Order book heatmap · Open interest at price · Net positioning
Using the Hyperliquid heatmaps in MMT
MMT runs its own Hyperliquid node and processes every trade, which means the liquidation, stop loss and take profit levels are known exactly rather than estimated. Three layers plot them:
Hyperliquid Liquidations Heatmap shows where open positions will be liquidated. Unlike the standard liquidation heatmap, which infers levels from leverage assumptions, these are the real liquidation prices of the positions currently open.
Hyperliquid Stop Loss Heatmap shows where pending stops sit.
Hyperliquid Take Profit Heatmap shows where pending targets sit.
How do you add them?
Open the Indicators dialog and select Hyperliquid Liquidations Heatmap, Hyperliquid Stop Loss Heatmap or Hyperliquid Take Profit Heatmap under Official.
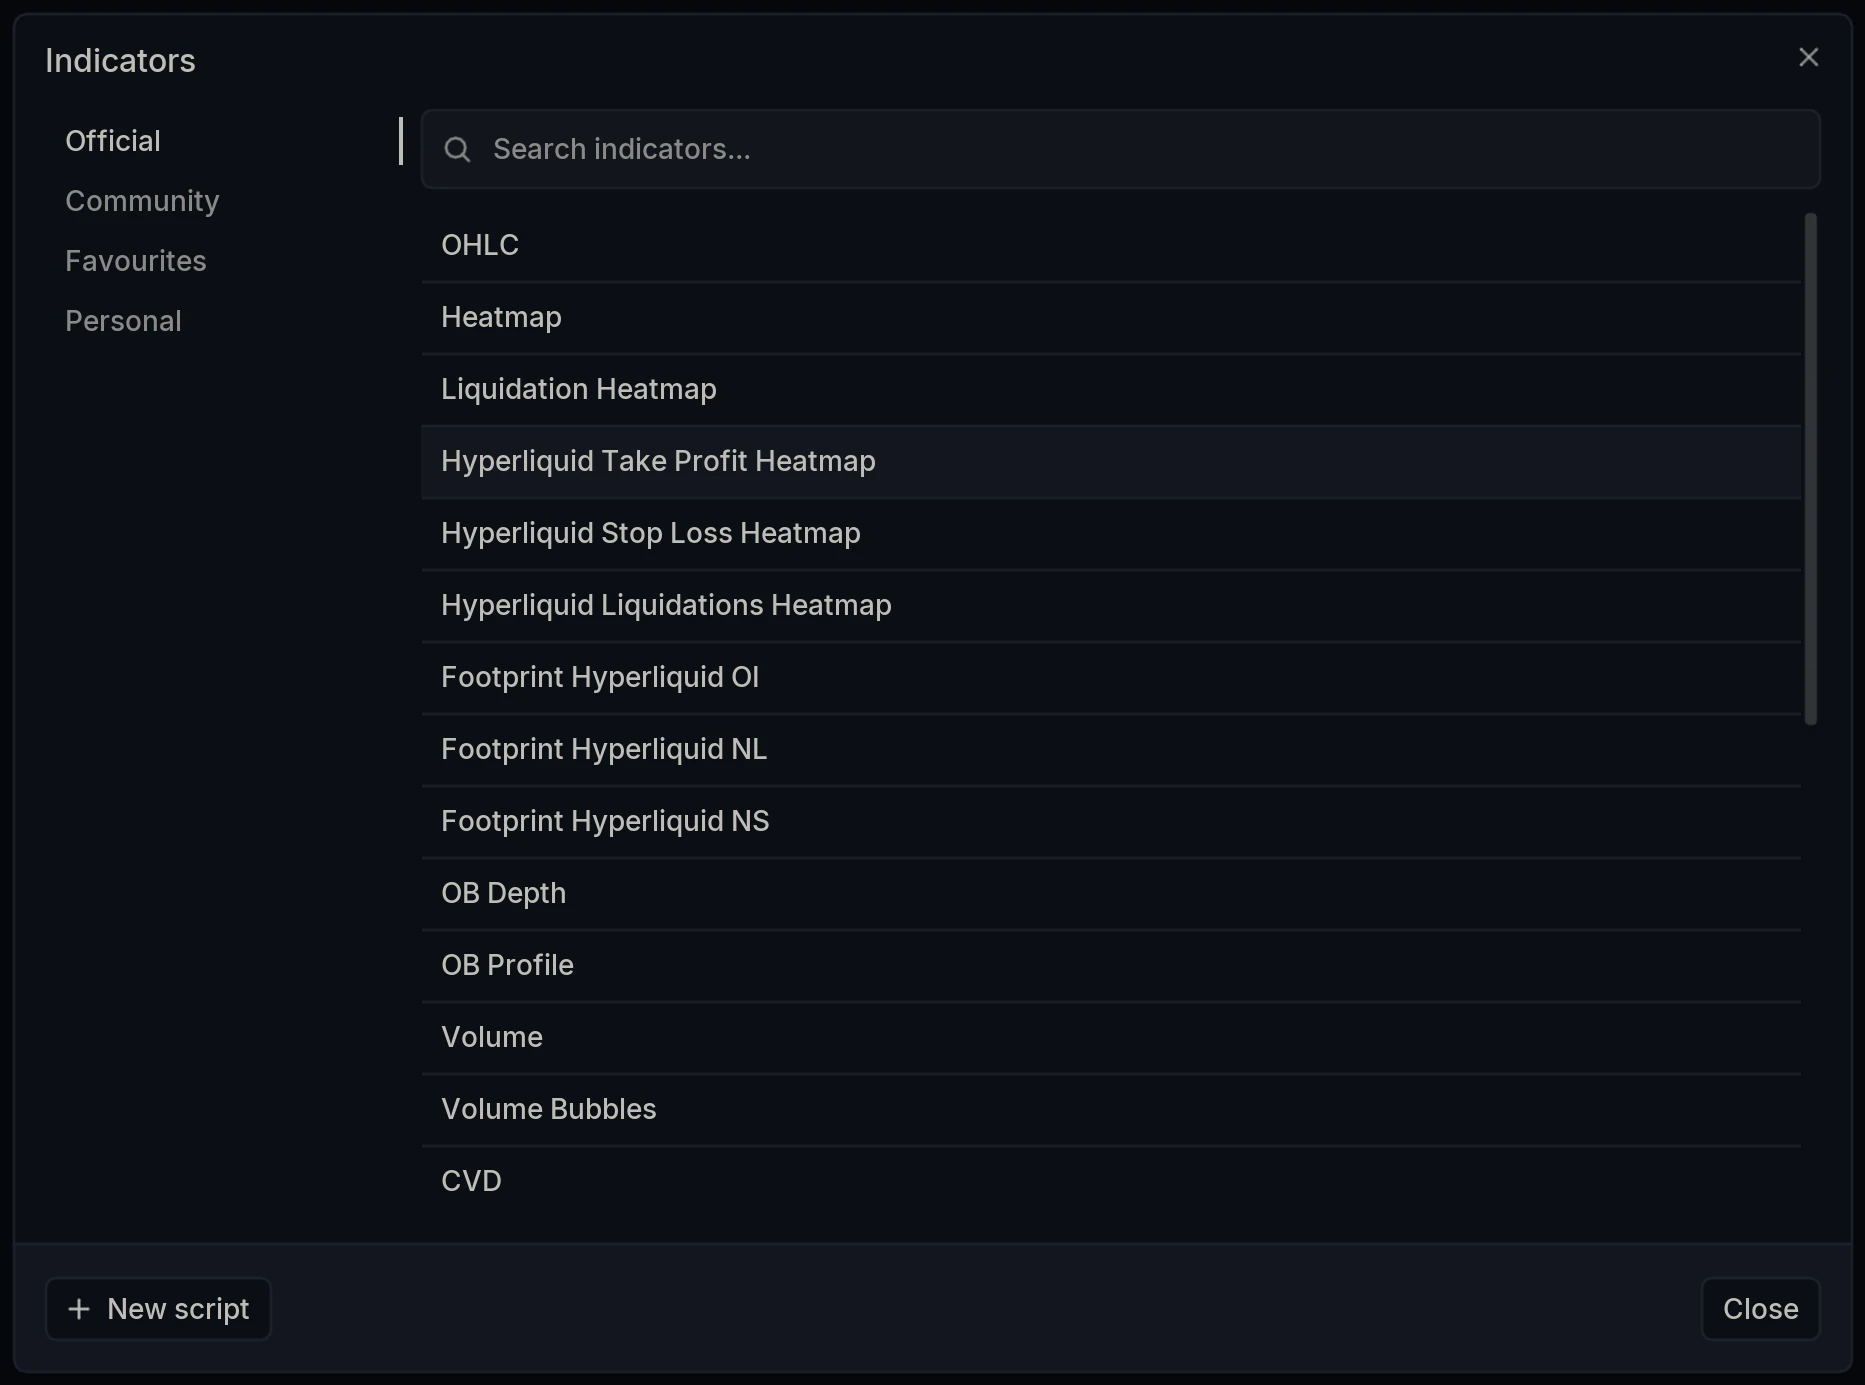
Each is a separate layer, so any combination can run at once. Running all three together is how the confluence reading above is done.
Settings
All three share the settings panel used by the order book heatmap, with two tabs: General and Interaction.
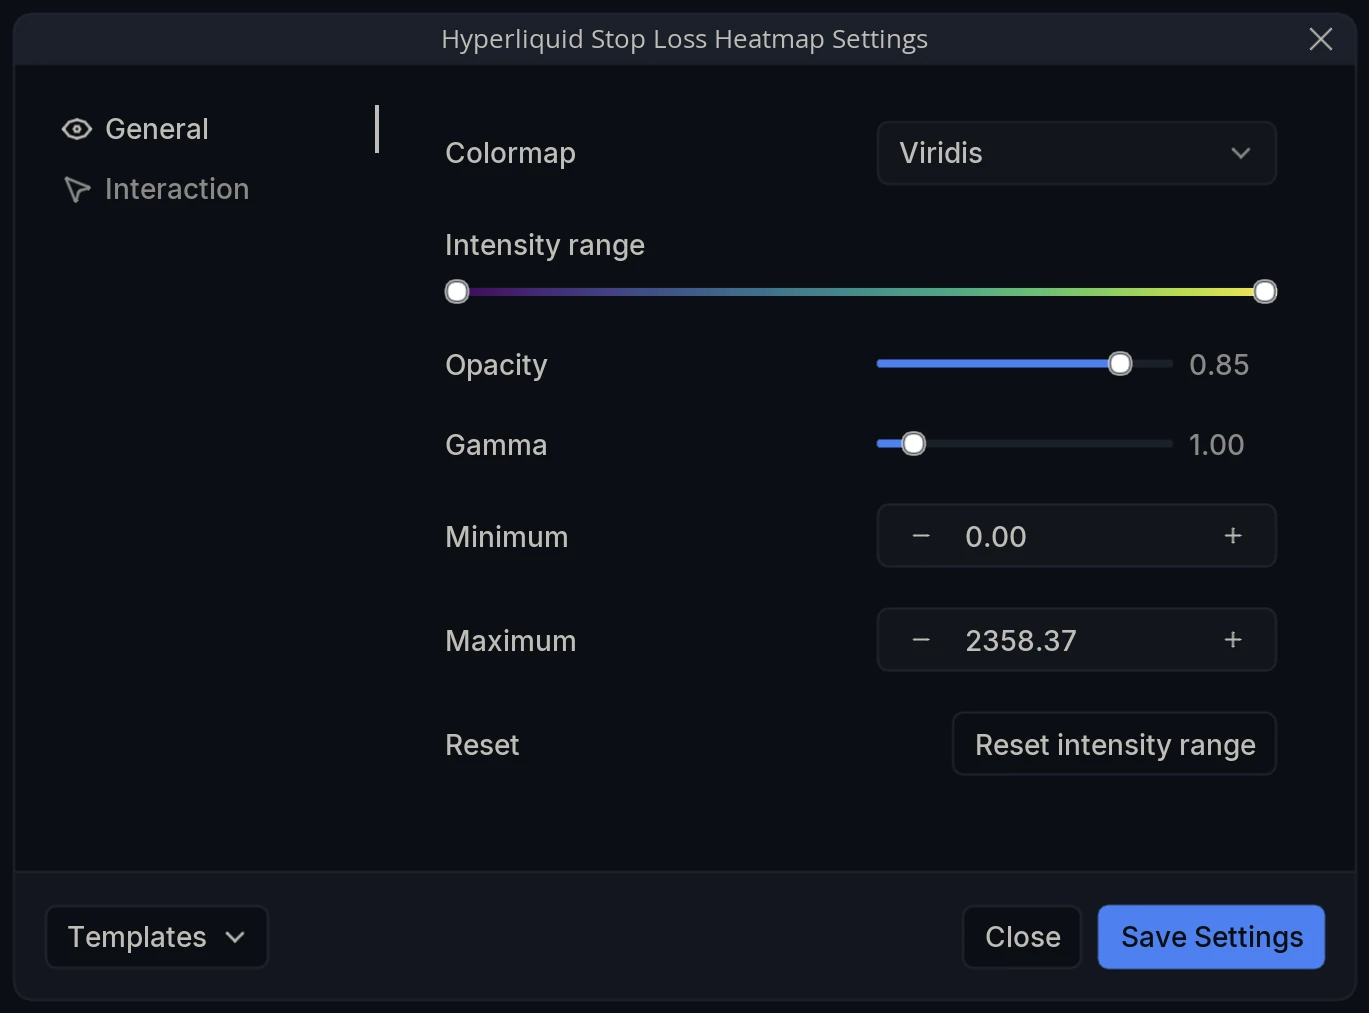
General carries Colormap, Intensity range, Opacity, Gamma, and the Minimum and Maximum bounds, plus Reset intensity range to return them to the automatic values. Gamma matters most here, as on any heatmap: raising it suppresses the weak levels so only genuine concentrations render brightly.
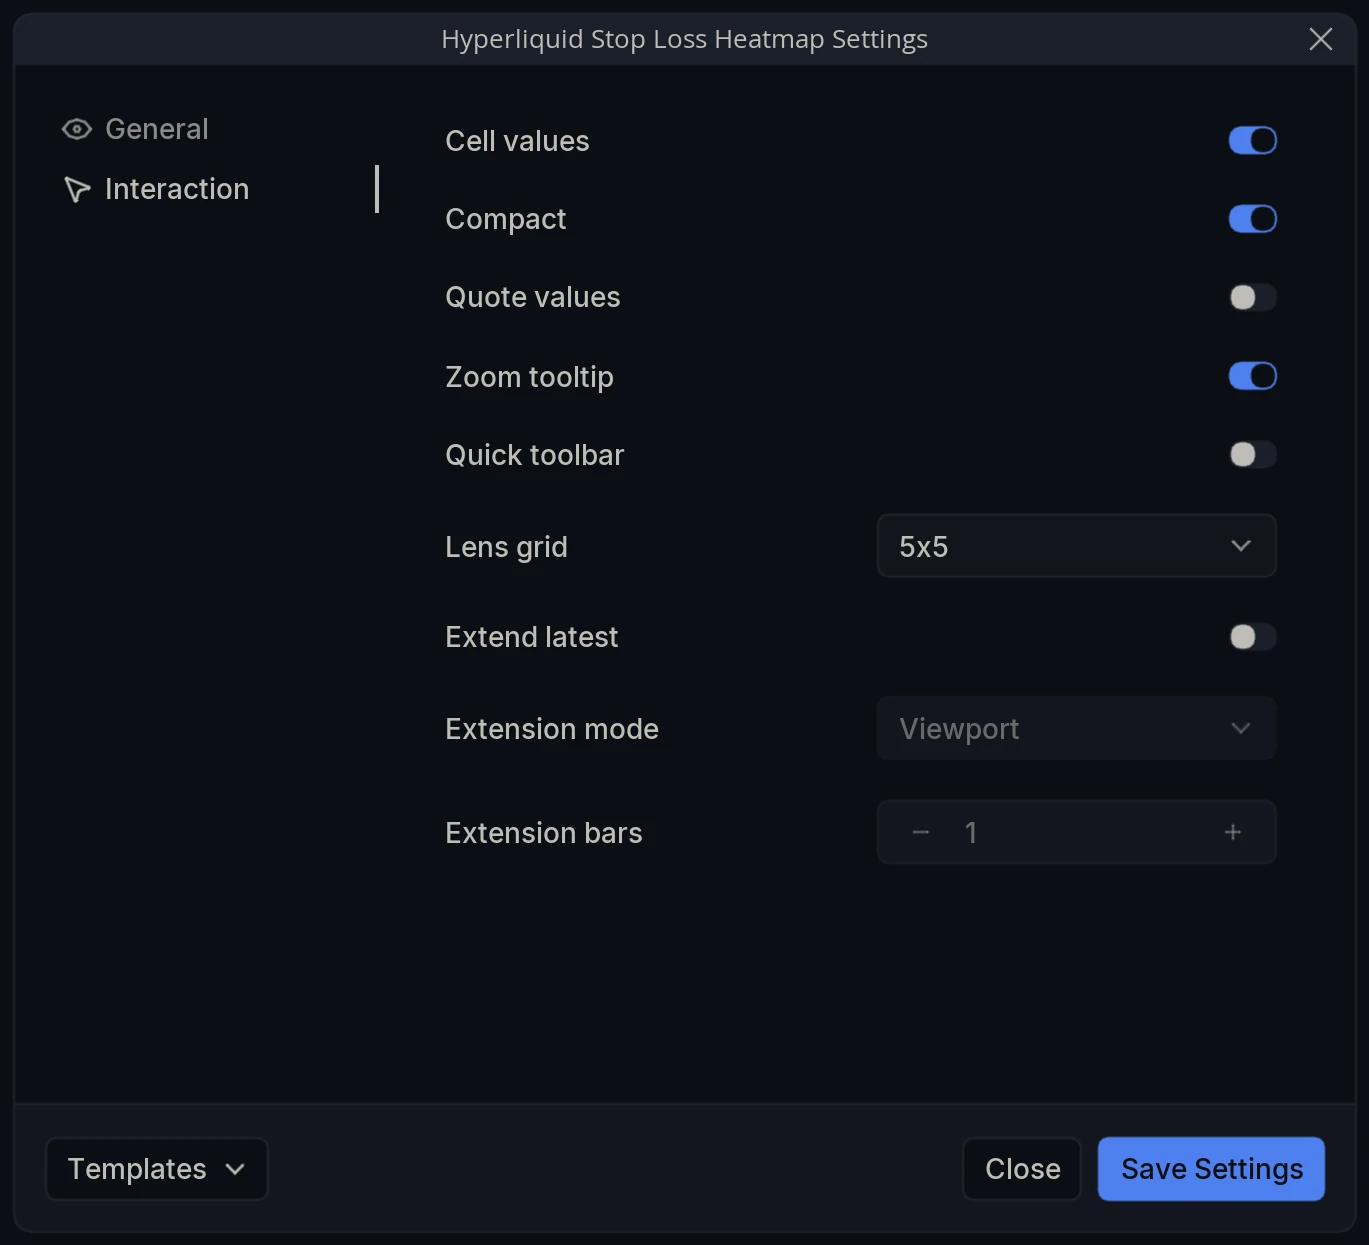
Interaction carries Cell values, Compact, Quote values, Zoom tooltip, Quick toolbar, Lens grid, and the Extend latest, Extension mode and Extension bars controls. All behave exactly as documented in the order book heatmap article.