What is open interest in trading?
By MichaelUpdated August 25, 2026
Open interest is the total number of derivative contracts that are currently open and have not yet been closed or settled. It rises when a new position is created and falls when one is closed, so it measures how much money is committed to a market rather than how much has changed hands.
How does open interest work?
Every derivative contract has two sides. For a position to exist, someone must be long it and someone else must be short it, and open interest counts the contract once rather than counting each side.
What happens to that count depends on what the two traders in a transaction are each doing. If both are opening, a buyer entering a new long against a seller entering a new short, a contract that did not exist before now does, and open interest rises by one. If both are closing, the contract is extinguished and open interest falls by one. If one is opening and the other is closing, the contract simply changes hands and open interest does not move at all.
That third case is the important one, because it is what separates open interest from volume. All three transactions add to volume identically. Only the first creates new exposure. Volume tells you how much trading happened; open interest tells you how much of it left new positions behind.
Because it counts commitment rather than activity, open interest exists only where contracts exist. Futures and perpetuals have it. Spot markets do not, because buying a coin outright does not create a contract that has to be closed later.
What do rising and falling open interest mean?
Open interest on its own counts contracts, and every contract is somebody’s long and somebody else’s short, so the number cannot tell you which way the market is positioned.
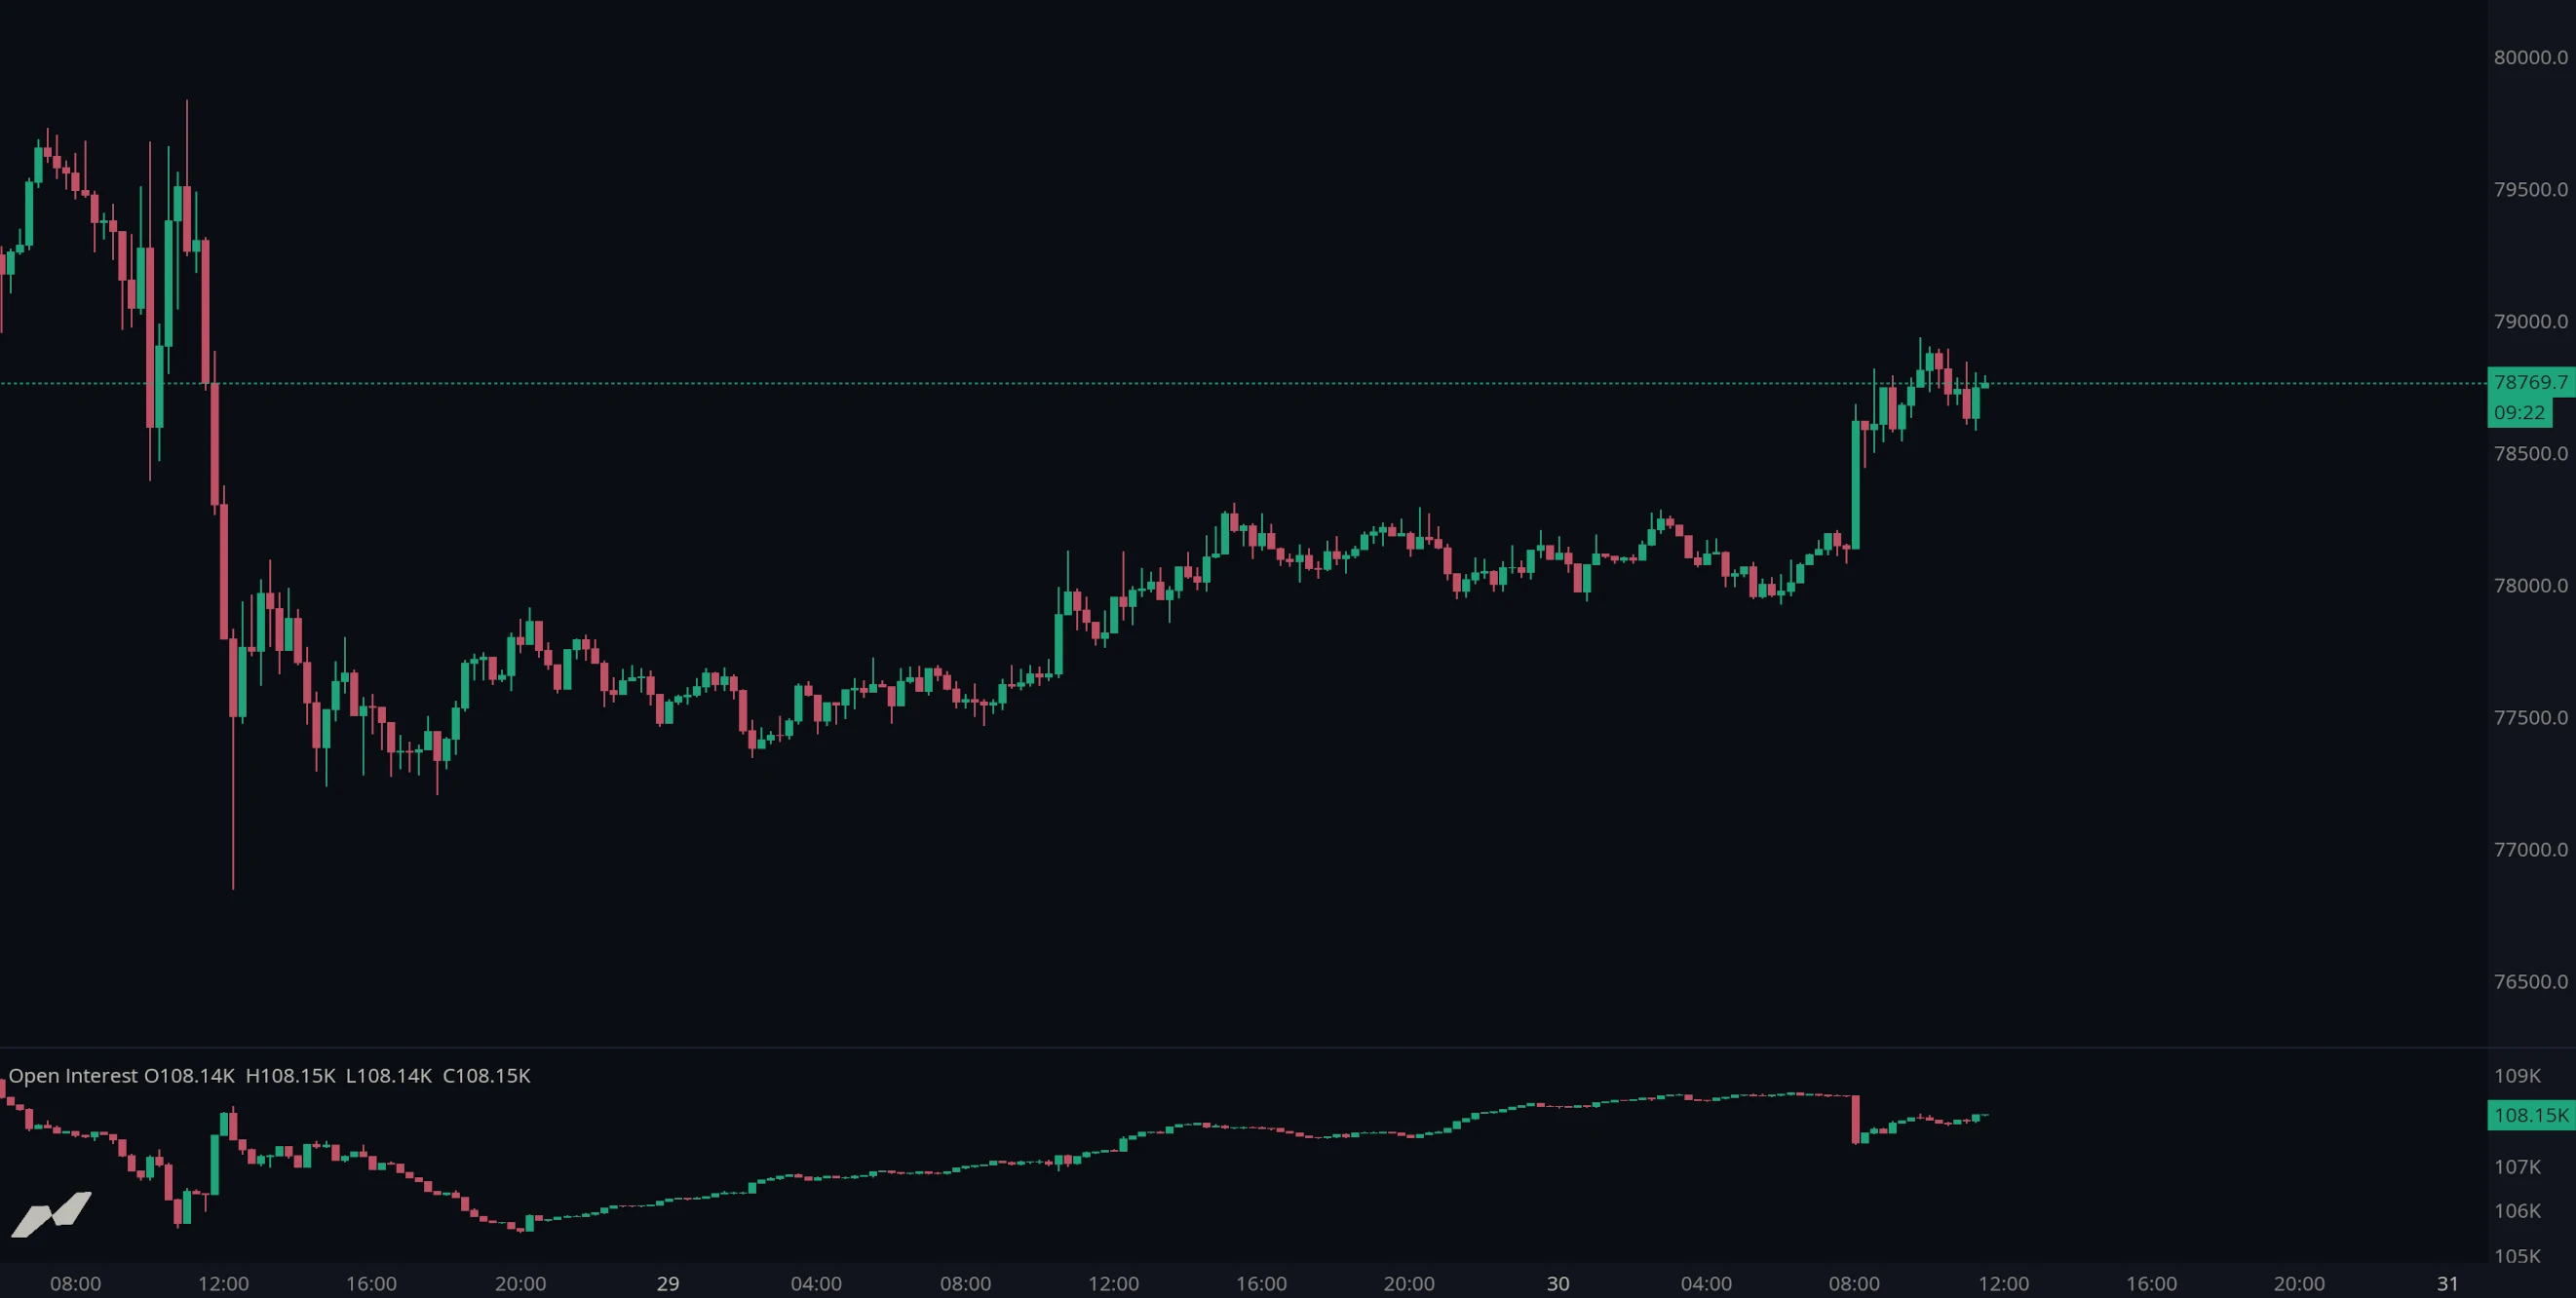
It becomes useful the moment you read it against price. There are four combinations, and each describes a different kind of move.
Price rising, open interest rising. New longs are being opened into strength. Fresh money is entering on the buy side, which is the healthiest version of an uptrend and the one most likely to continue.
Price rising, open interest falling. Positions are being closed, not opened. A rally on falling open interest is largely shorts buying back to cover, and once they are done the buying stops with them. This is the shape of a squeeze rather than a trend.
Price falling, open interest rising. New shorts are being opened into weakness. Fresh money is committing to lower prices, which makes a downtrend with real conviction behind it.
Price falling, open interest dropping sharply. Longs are being closed, often not by choice. A steep fall in both together is the signature of liquidations clearing out leveraged positions, and it frequently ends abruptly once there is nothing left to force.
The pattern behind all four is simple: rising open interest means fresh commitment and tends to sustain a move, while falling open interest means positions being unwound and tends to end one.
What is the difference between open interest and volume?
They are measured over different things, and the distinction catches people out.
Volume is a flow. It counts what traded during a period and resets when the next period begins. Ten thousand contracts traded in an hour is ten thousand contracts of activity in that hour, and it says nothing about what remains afterward.
Open interest is a stock. It is a running level of how many contracts are outstanding at a moment in time, carried forward from one period to the next. It only changes when positions are created or destroyed.
A market can have enormous volume and completely flat open interest, which means traders passed the same contracts between each other all day without adding exposure. That is a very different market from one with modest volume and steadily climbing open interest, where far less trading is quietly building far more risk.
What are the limits of open interest?
It has no direction. Open interest counts contracts, not sides. A rise tells you positions were opened, not whether the people opening them were long or short. Reading it against price is what supplies the direction, and that reading is an inference rather than a fact.
It is venue-specific. Each exchange reports only its own contracts. Open interest can fall on one venue while rising on another as positioning moves between them, which is why aggregating across exchanges gives a much more reliable picture of total exposure.
Units differ between venues. Some exchanges report in contracts, some in the base asset, some in USD, and a coin-denominated figure will move purely because price moved even if not a single position changed. Compare like with like.
It does not distinguish intent. A hedger offsetting spot exposure and a speculator making a directional bet add identically to open interest.
Related: Liquidations · Funding rate · CVD (Cumulative Volume Delta) · Volume
When should you use open interest?
Open interest is a conviction check. It rarely produces a trade on its own, but it changes how much weight a move deserves.
Its best use is qualifying a breakout. Price clearing a level with open interest climbing is being bought by people taking on new risk; the same break with open interest falling is being bought by people getting out of old risk, and those two situations resolve very differently.
It is also the cleanest way to see leverage build and flush. A long stretch of rising open interest into a range is exposure accumulating, which is precisely the condition that produces a cascade when the range finally breaks. Watching that build often tells you more about what is coming than the price action does.
Its weakness is that it is slow and it is a level rather than a signal. Open interest will not time anything for you, and reading a single bar of it in isolation is close to meaningless.
Using Open Interest in MMT
MMT’s Open Interest layer plots the outstanding contract count in its own panel below the price chart. It can be drawn as candles, a line or an area, reported in the base coin or in USD, and pooled across exchanges from the Aggregate tab.
How do you add open interest to a chart?
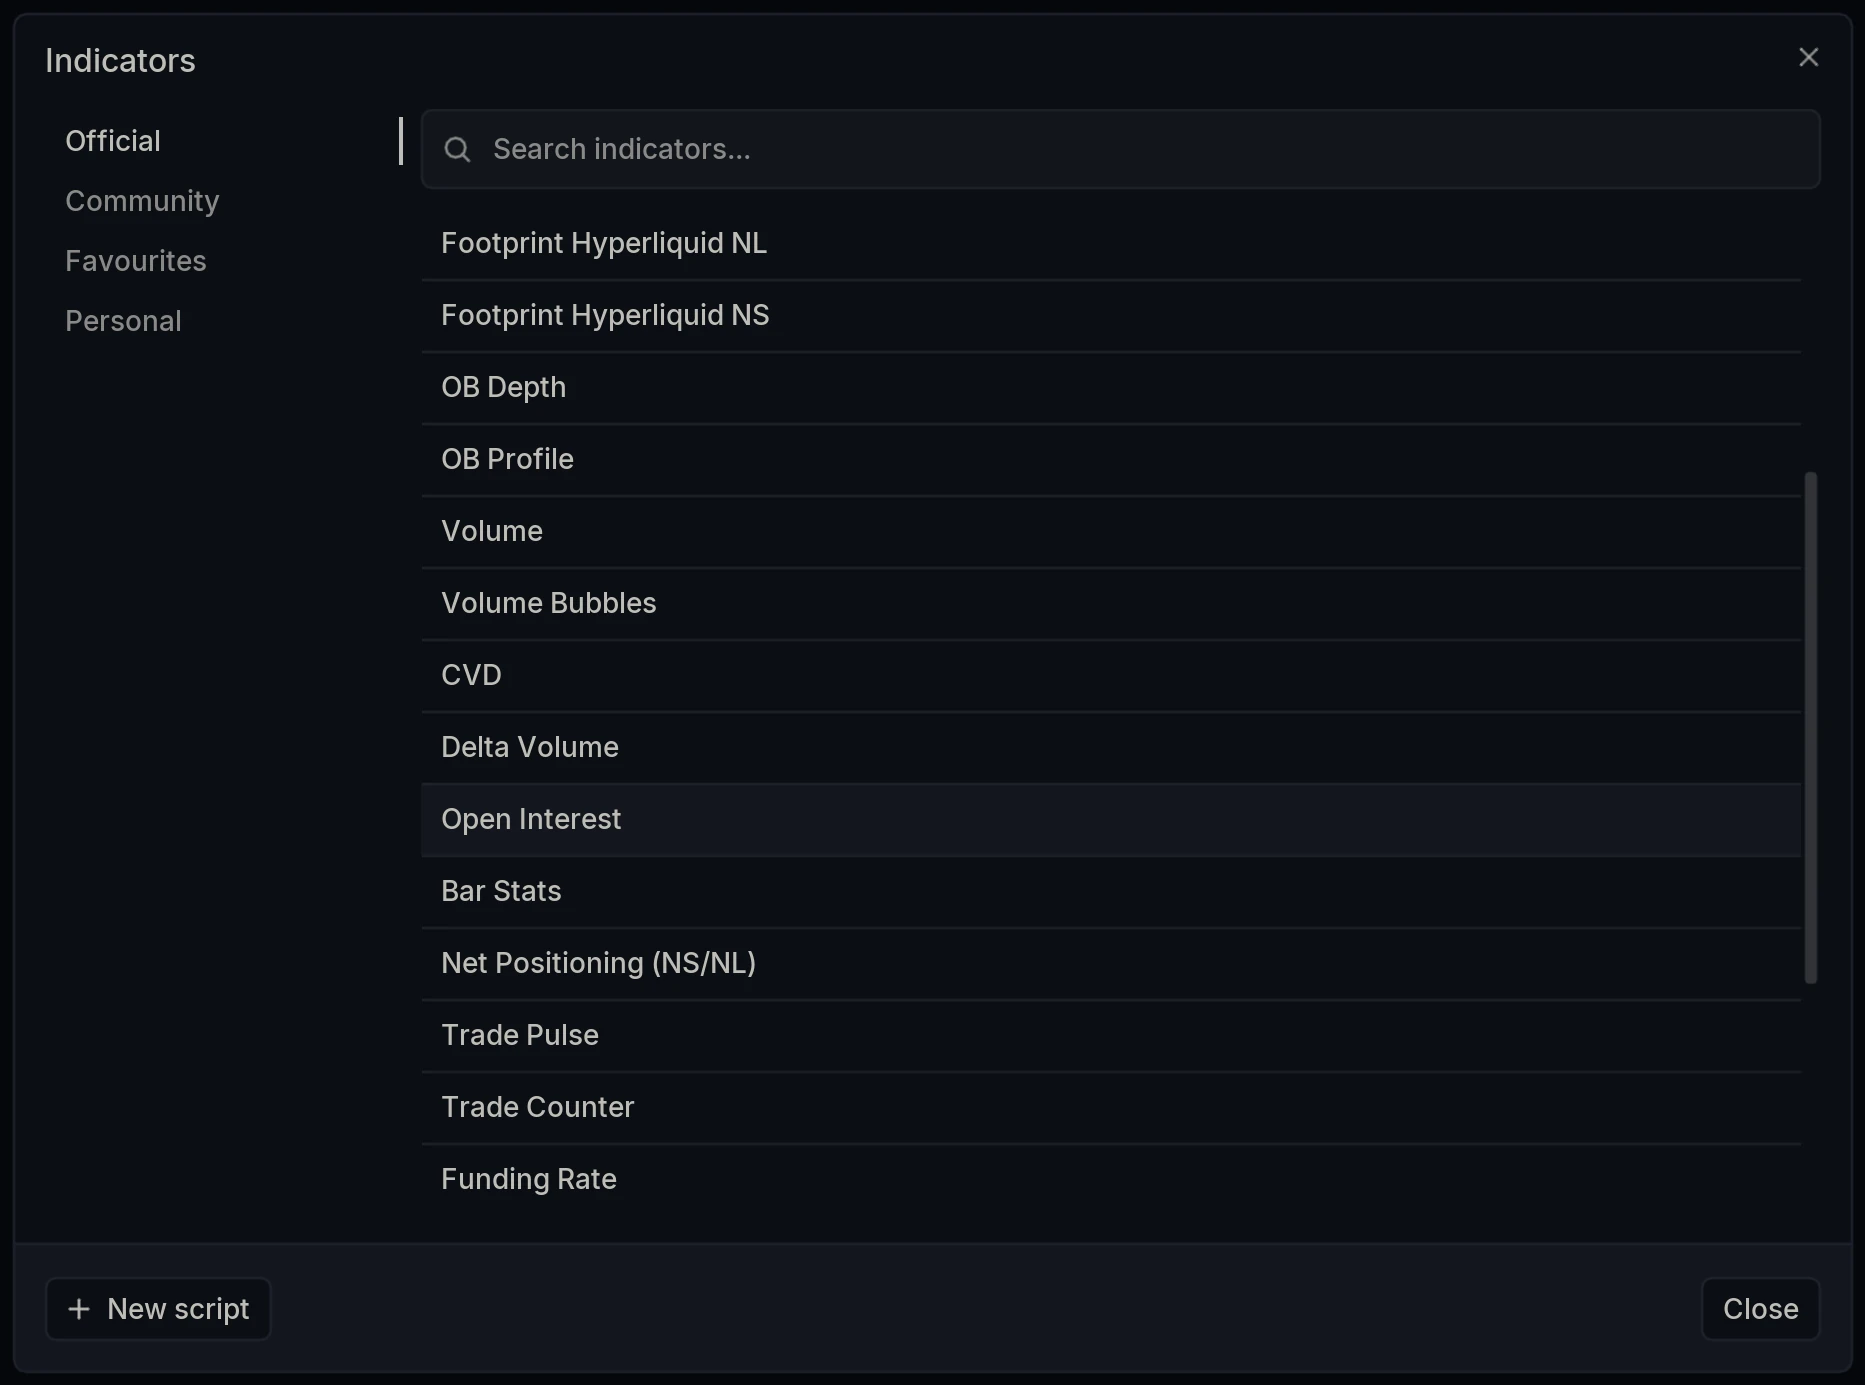
Open the Indicators dialog and select Open Interest under Official.
What does an open interest candle show?
Rendered as candles, each bar carries a full open, high, low and close for open interest across that period, not just its net change. The candle is colored with the up color when open interest finished the period higher than it started and the down color when it finished lower.
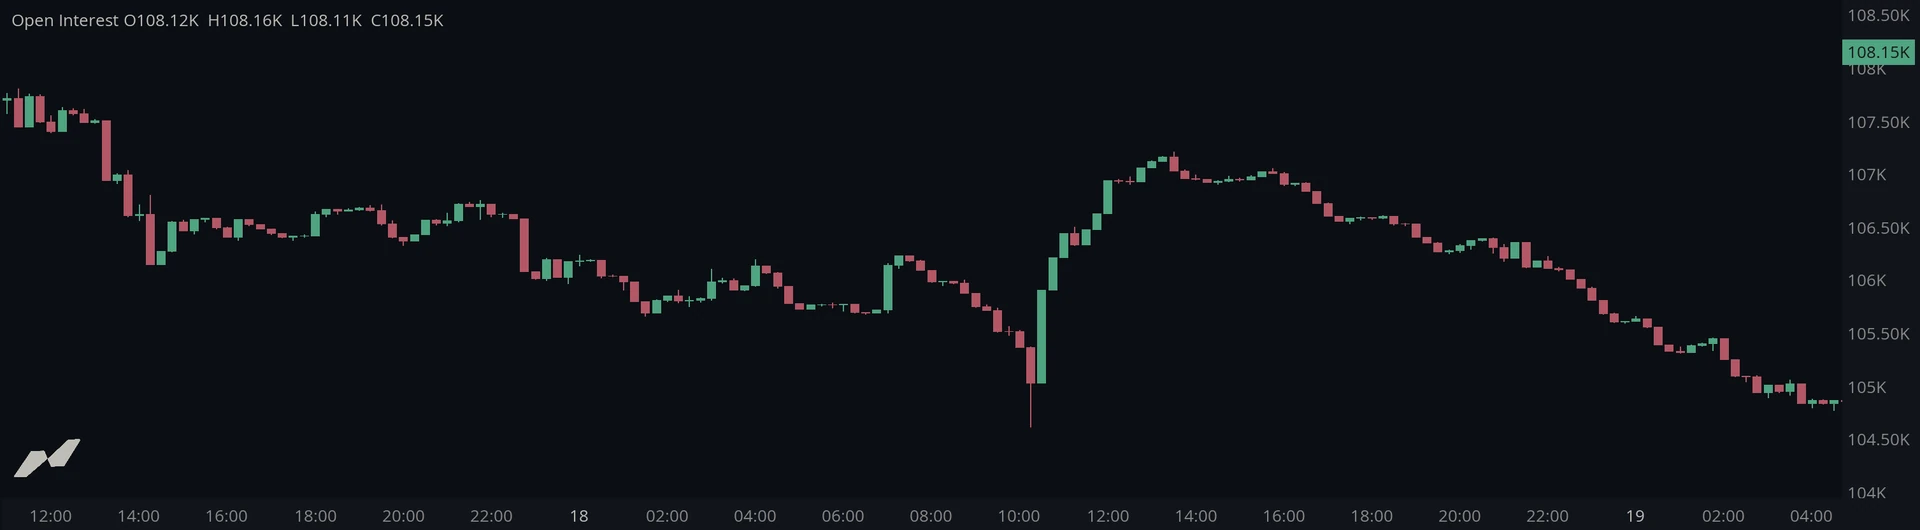
That extra detail is worth having. A period that closes almost flat can still have seen open interest run far higher and come all the way back, which is positions being opened and then closed again inside the bar. A line render would show you a quiet period; the candle shows you a busy one that ended where it began.
Which render should you use?
Candles is the most informative and the default, for the reason above.
Line plots the closing level of each period as a continuous path. It is the cleanest view for comparing the shape of open interest against the shape of price, which is the main reading in the four combinations described earlier.
Area is the line with the space beneath it filled, which suits reading the overall level and its trend rather than period-by-period detail.
Layer Settings
Open Open Interest Settings via the cog wheel on the layer name. The panel has three tabs: Price Marker, Display and Aggregate.
Price Marker
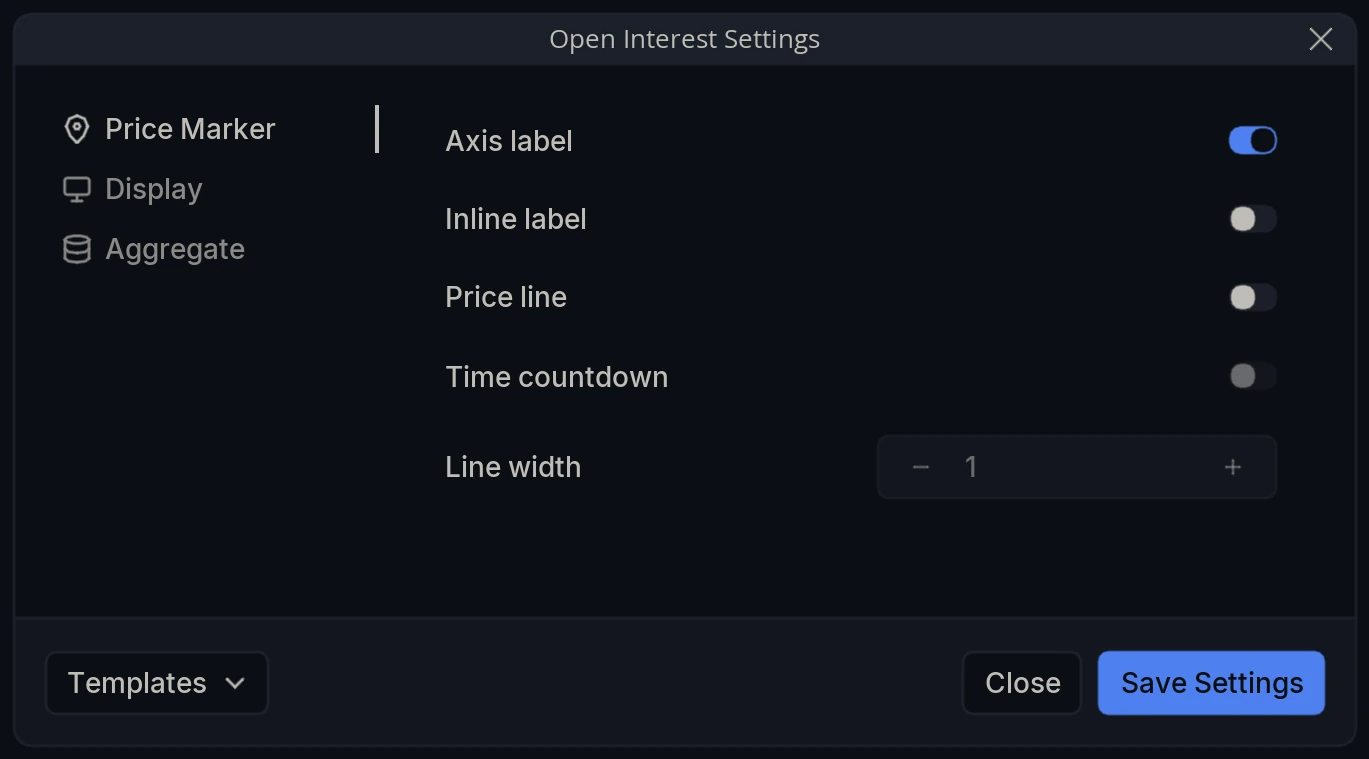
Axis label - Show the current value as a label on the panel’s axis.
Inline label - Show that value on the panel itself rather than on the axis.
Price line - Draw a horizontal line across the panel at the current value.
Time countdown - Show the time remaining until the current candle closes.
Line width - Thickness of that line.
Display
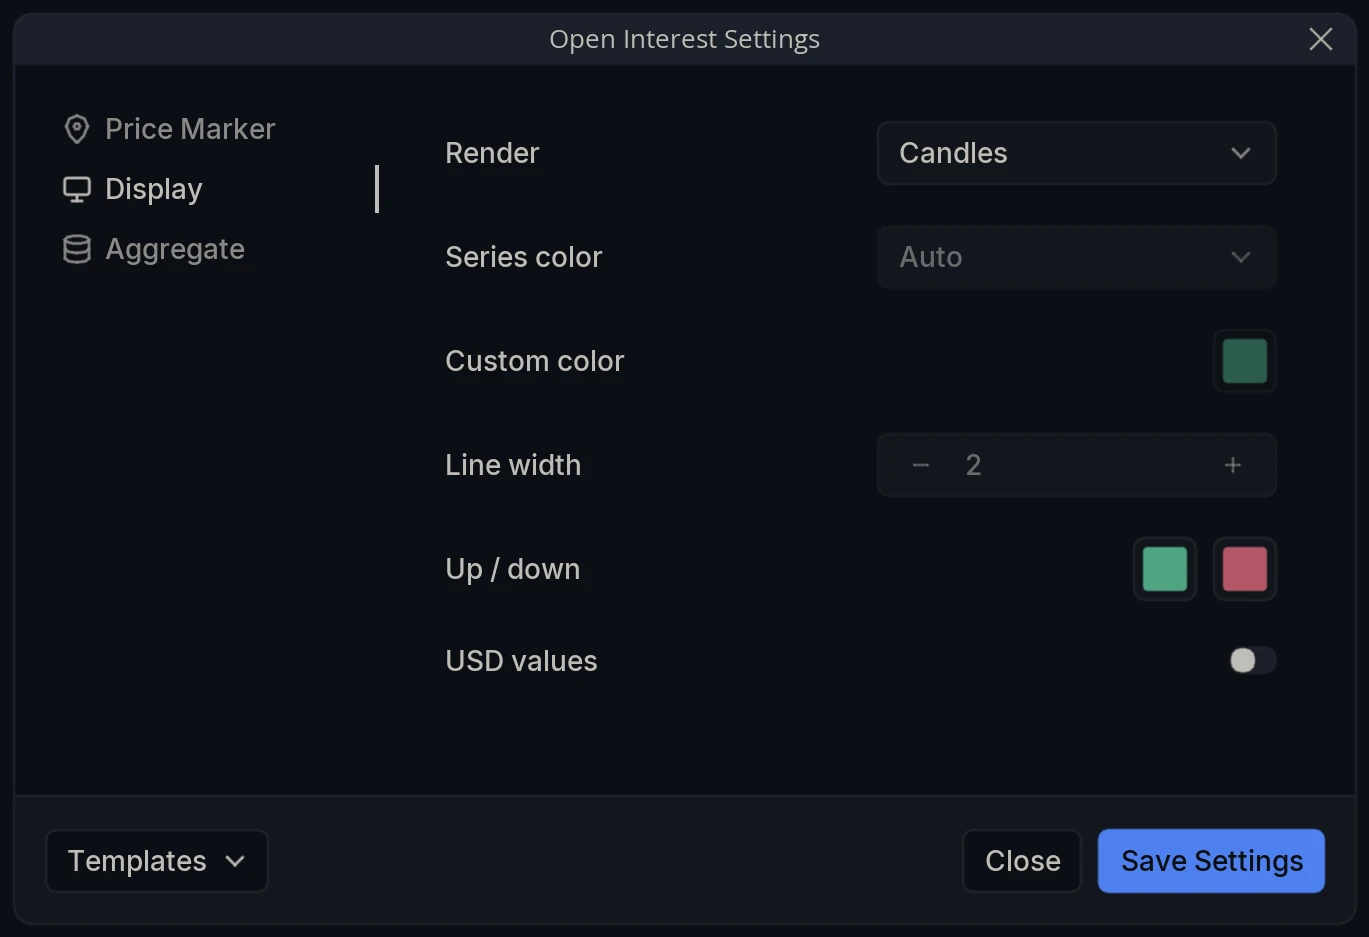
Render - How the plot is drawn: Candles, Line or Area.
Series color - The color source for the Line and Area renders: Auto takes it from the active theme, or choose a custom color instead. Inactive while Render is set to Candles, which uses the Up / down colors.
Custom color - The color used when Series color is not set to Auto.
Line width - Thickness of the line in the Line and Area renders.
Up / down - The two colors used for candles that closed higher and lower than they opened.
USD values - Report open interest in USD rather than in units of the base asset. Worth knowing which you are reading: a coin-denominated figure changes only when positions change, while a USD figure also moves whenever price does.
Aggregate
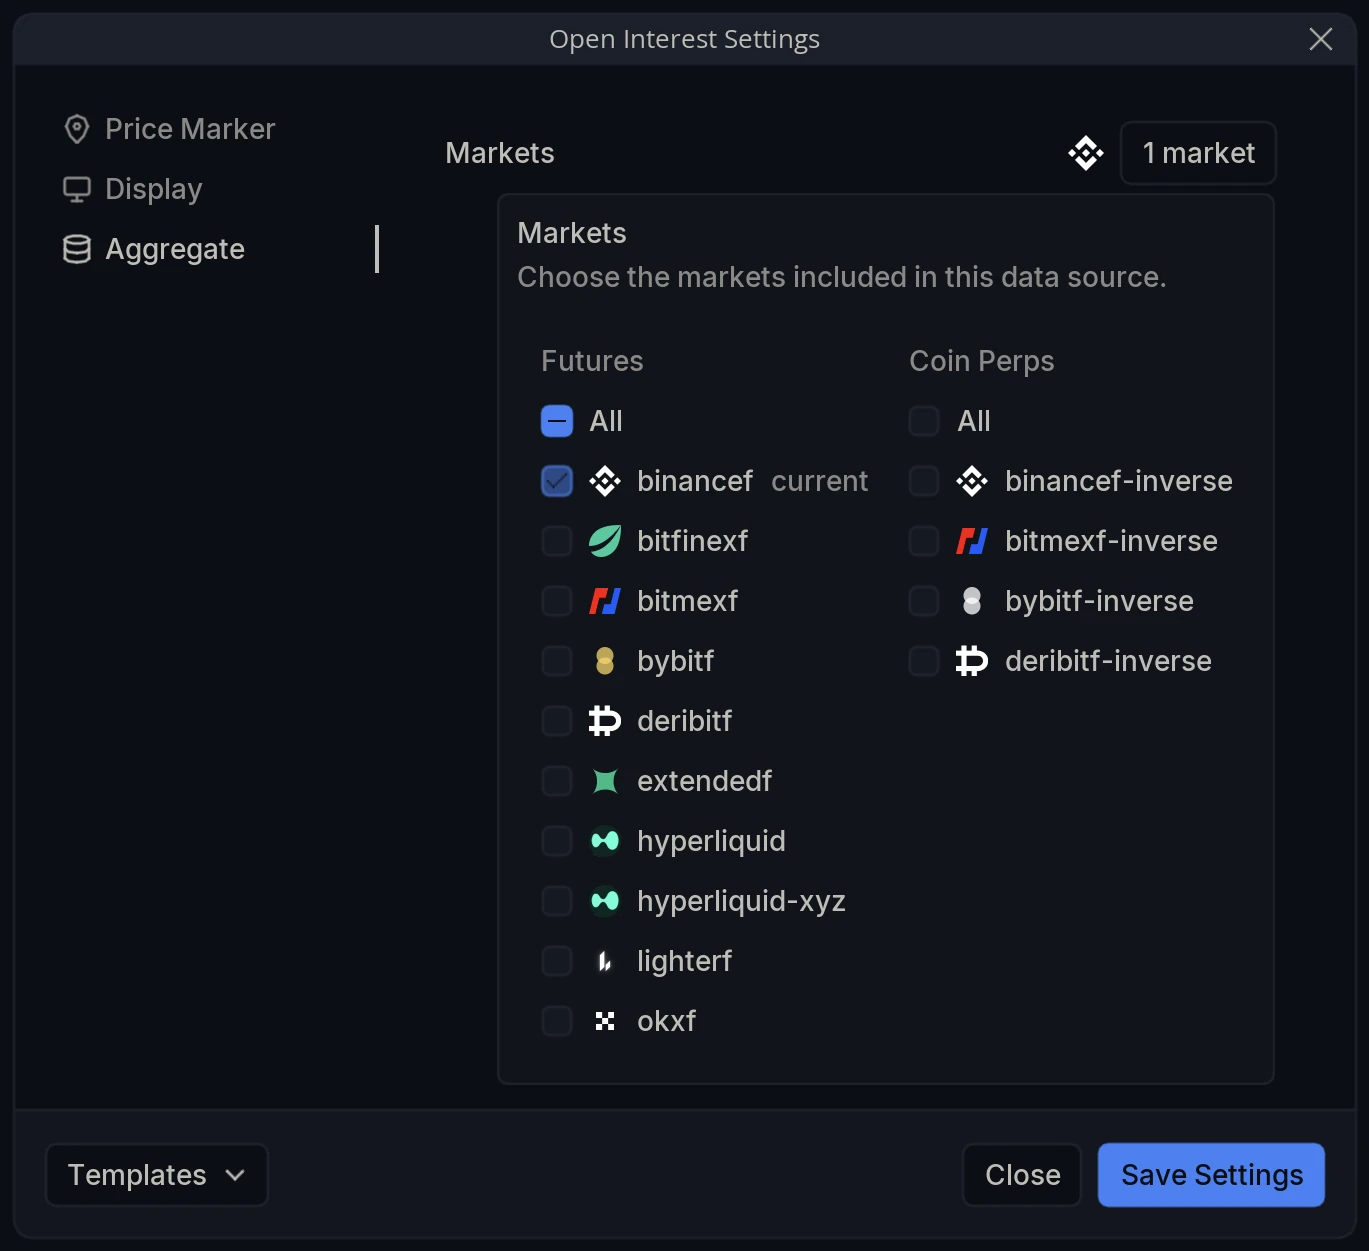
Markets - Choose the markets whose contracts are counted. The selector offers Futures and Coin Perps only, with no Spot column, because spot markets have no contracts and therefore no open interest. Your chart’s own market is tagged current.
Aggregating is particularly worthwhile here. Positioning moves between venues, so open interest falling on one exchange can simply mean it rose on another. Pooling them answers the question you actually care about, which is whether total exposure to the asset is growing or shrinking.