What is a candlestick chart?
By MichaelUpdated August 24, 2026
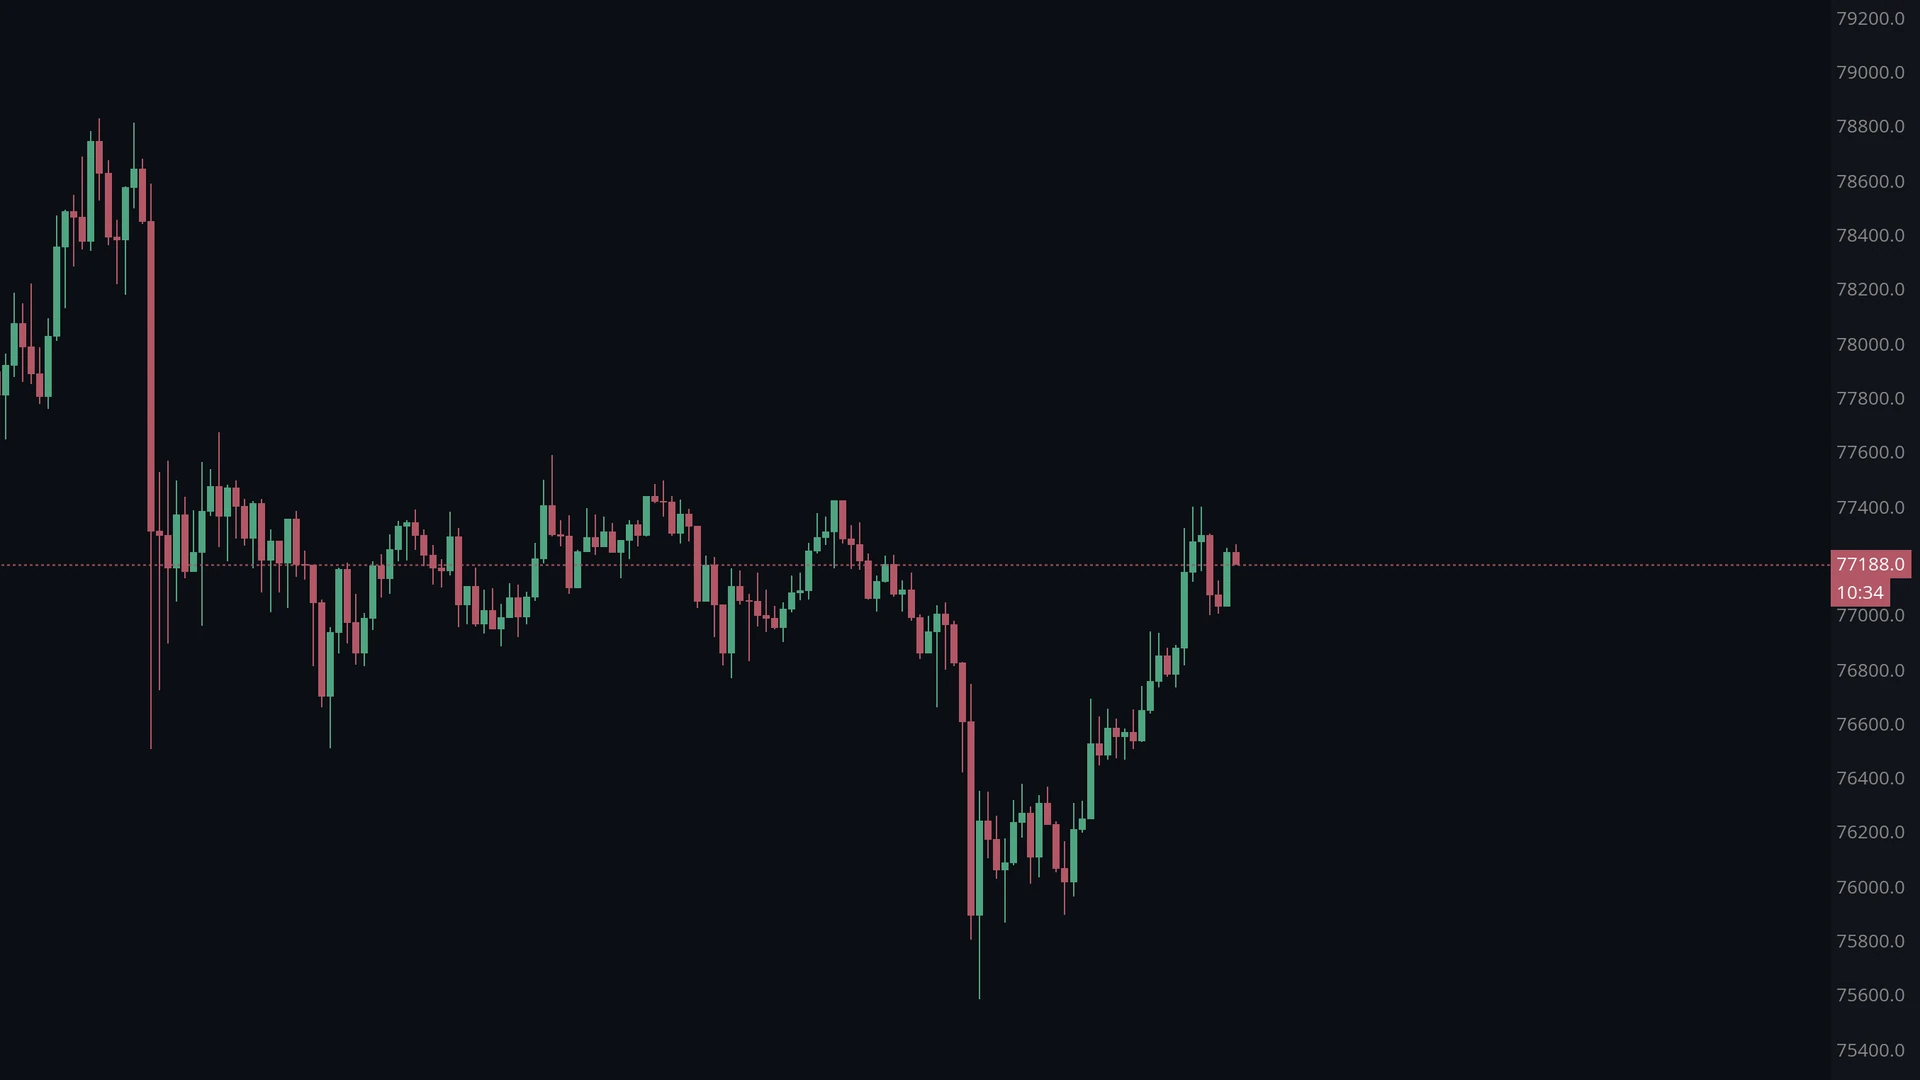
A candlestick chart shows price movement over time as a series of candles. Each candle summarises one period of trading with four values: the open, the high, the low and the close. Its body spans the open and close, and thin wicks extend to the extremes reached in between.
How does a candlestick chart work?
A market produces a continuous stream of individual trades, each with a price, a size and a timestamp. Watched raw, that stream is unreadable. A candlestick chart compresses it: the stream is chopped into fixed intervals - one minute, one hour, one day - and everything that happened inside each interval is described with four numbers.
Those four numbers are the open (the first price traded in the interval), the high and low (the extremes reached), and the close (the last price traded). Drawn as a candle, they show both direction and range at a glance: whether the interval finished above or below where it started, and how far price travelled getting there.
The colour of the body reports direction, so a chart can be scanned quickly for runs of buying or selling. The wicks report rejection - prices the market reached but did not hold. Together they make a session’s worth of trading legible in a single shape, which is why candlesticks remain the default view in almost every charting platform.
What do open, high, low and close mean?
The four values are usually written together as OHLC.
The open is the first price traded in the interval, and the close is the last. The high and low are the highest and lowest prices reached in between. Every candlestick is built from those four figures and nothing else.
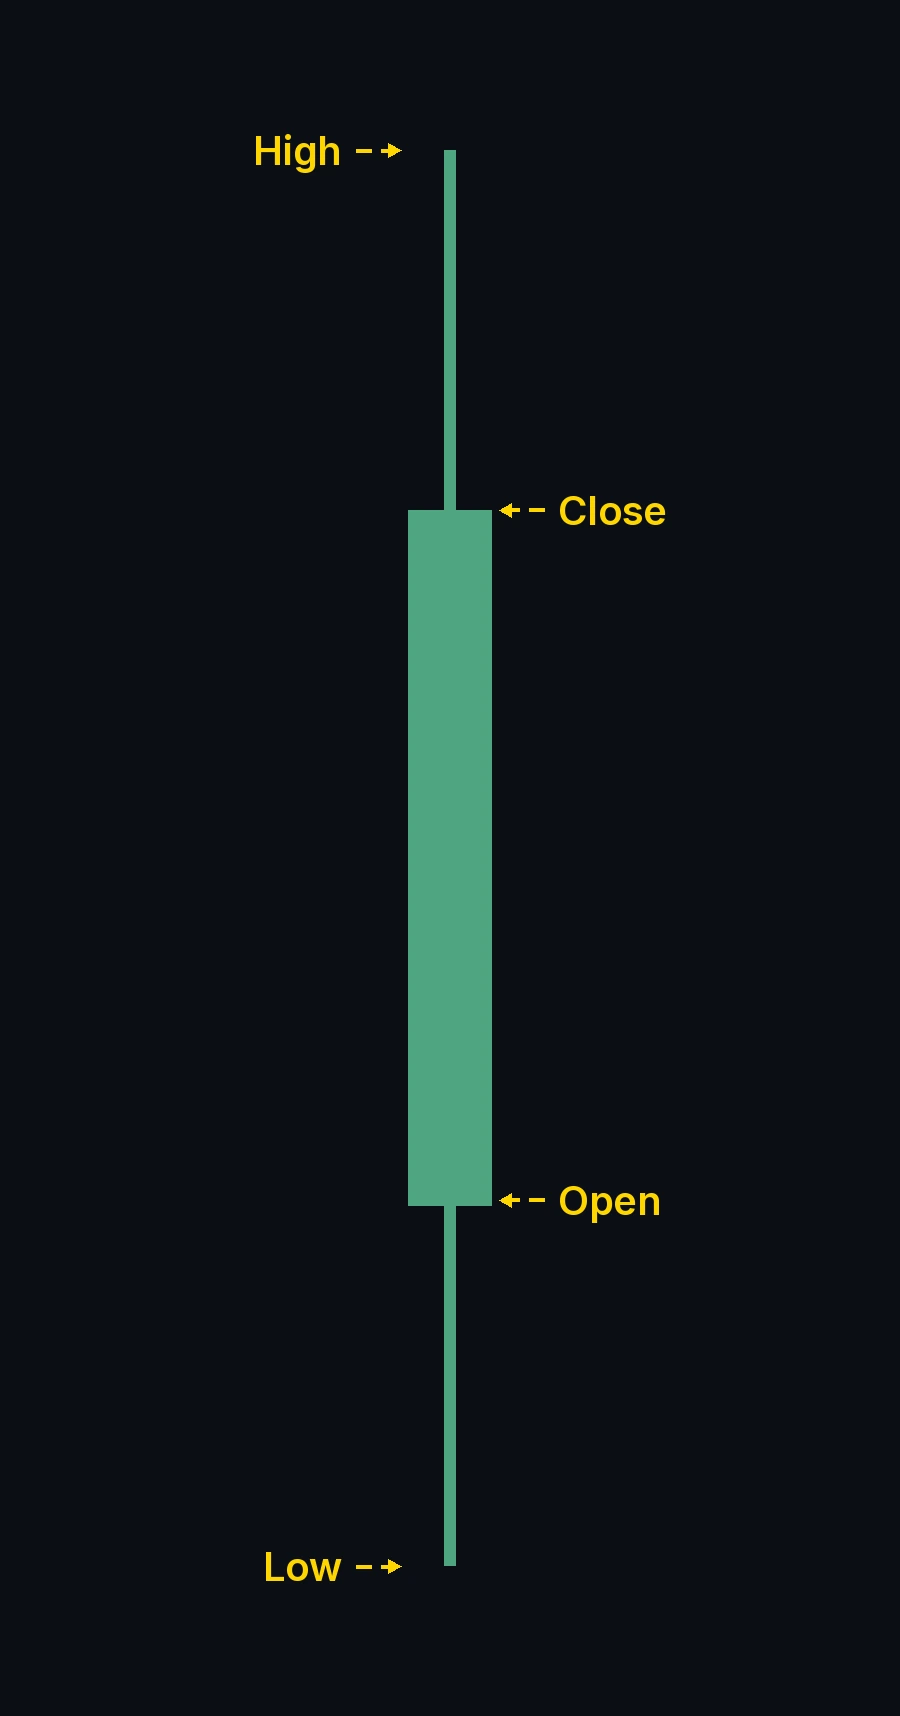
The body spans the open and the close. Its colour reports the direction: one colour when the close is above the open, another when it is below. In the candle above the close sits at the top of the body and the open at the bottom, so the market finished higher than it started. The wicks extend from the body out to the high and the low, showing where price traded but did not settle.
How do you read a candlestick?
Read the proportions rather than the individual prices. A long body with almost no wick means the market moved one way and stayed there, closing near its extreme. A small body with a long wick means price travelled somewhere and was pushed back, closing near where it started - an attempt that failed.
The relationship between consecutive candles matters as much as any single one. A series of long bodies in the same colour is a trending market; a cluster of small bodies with wicks on both sides is a market that is going nowhere and testing both directions.
What is a Heiken Ashi chart?
Heiken Ashi is a variation on the candlestick that applies a smoothing formula, replacing each interval’s raw values with averages that take the previous candle into account. The close becomes the average of the interval’s own four values, and the open becomes the midpoint of the previous candle’s body. Consecutive candles are therefore deliberately linked rather than independent.
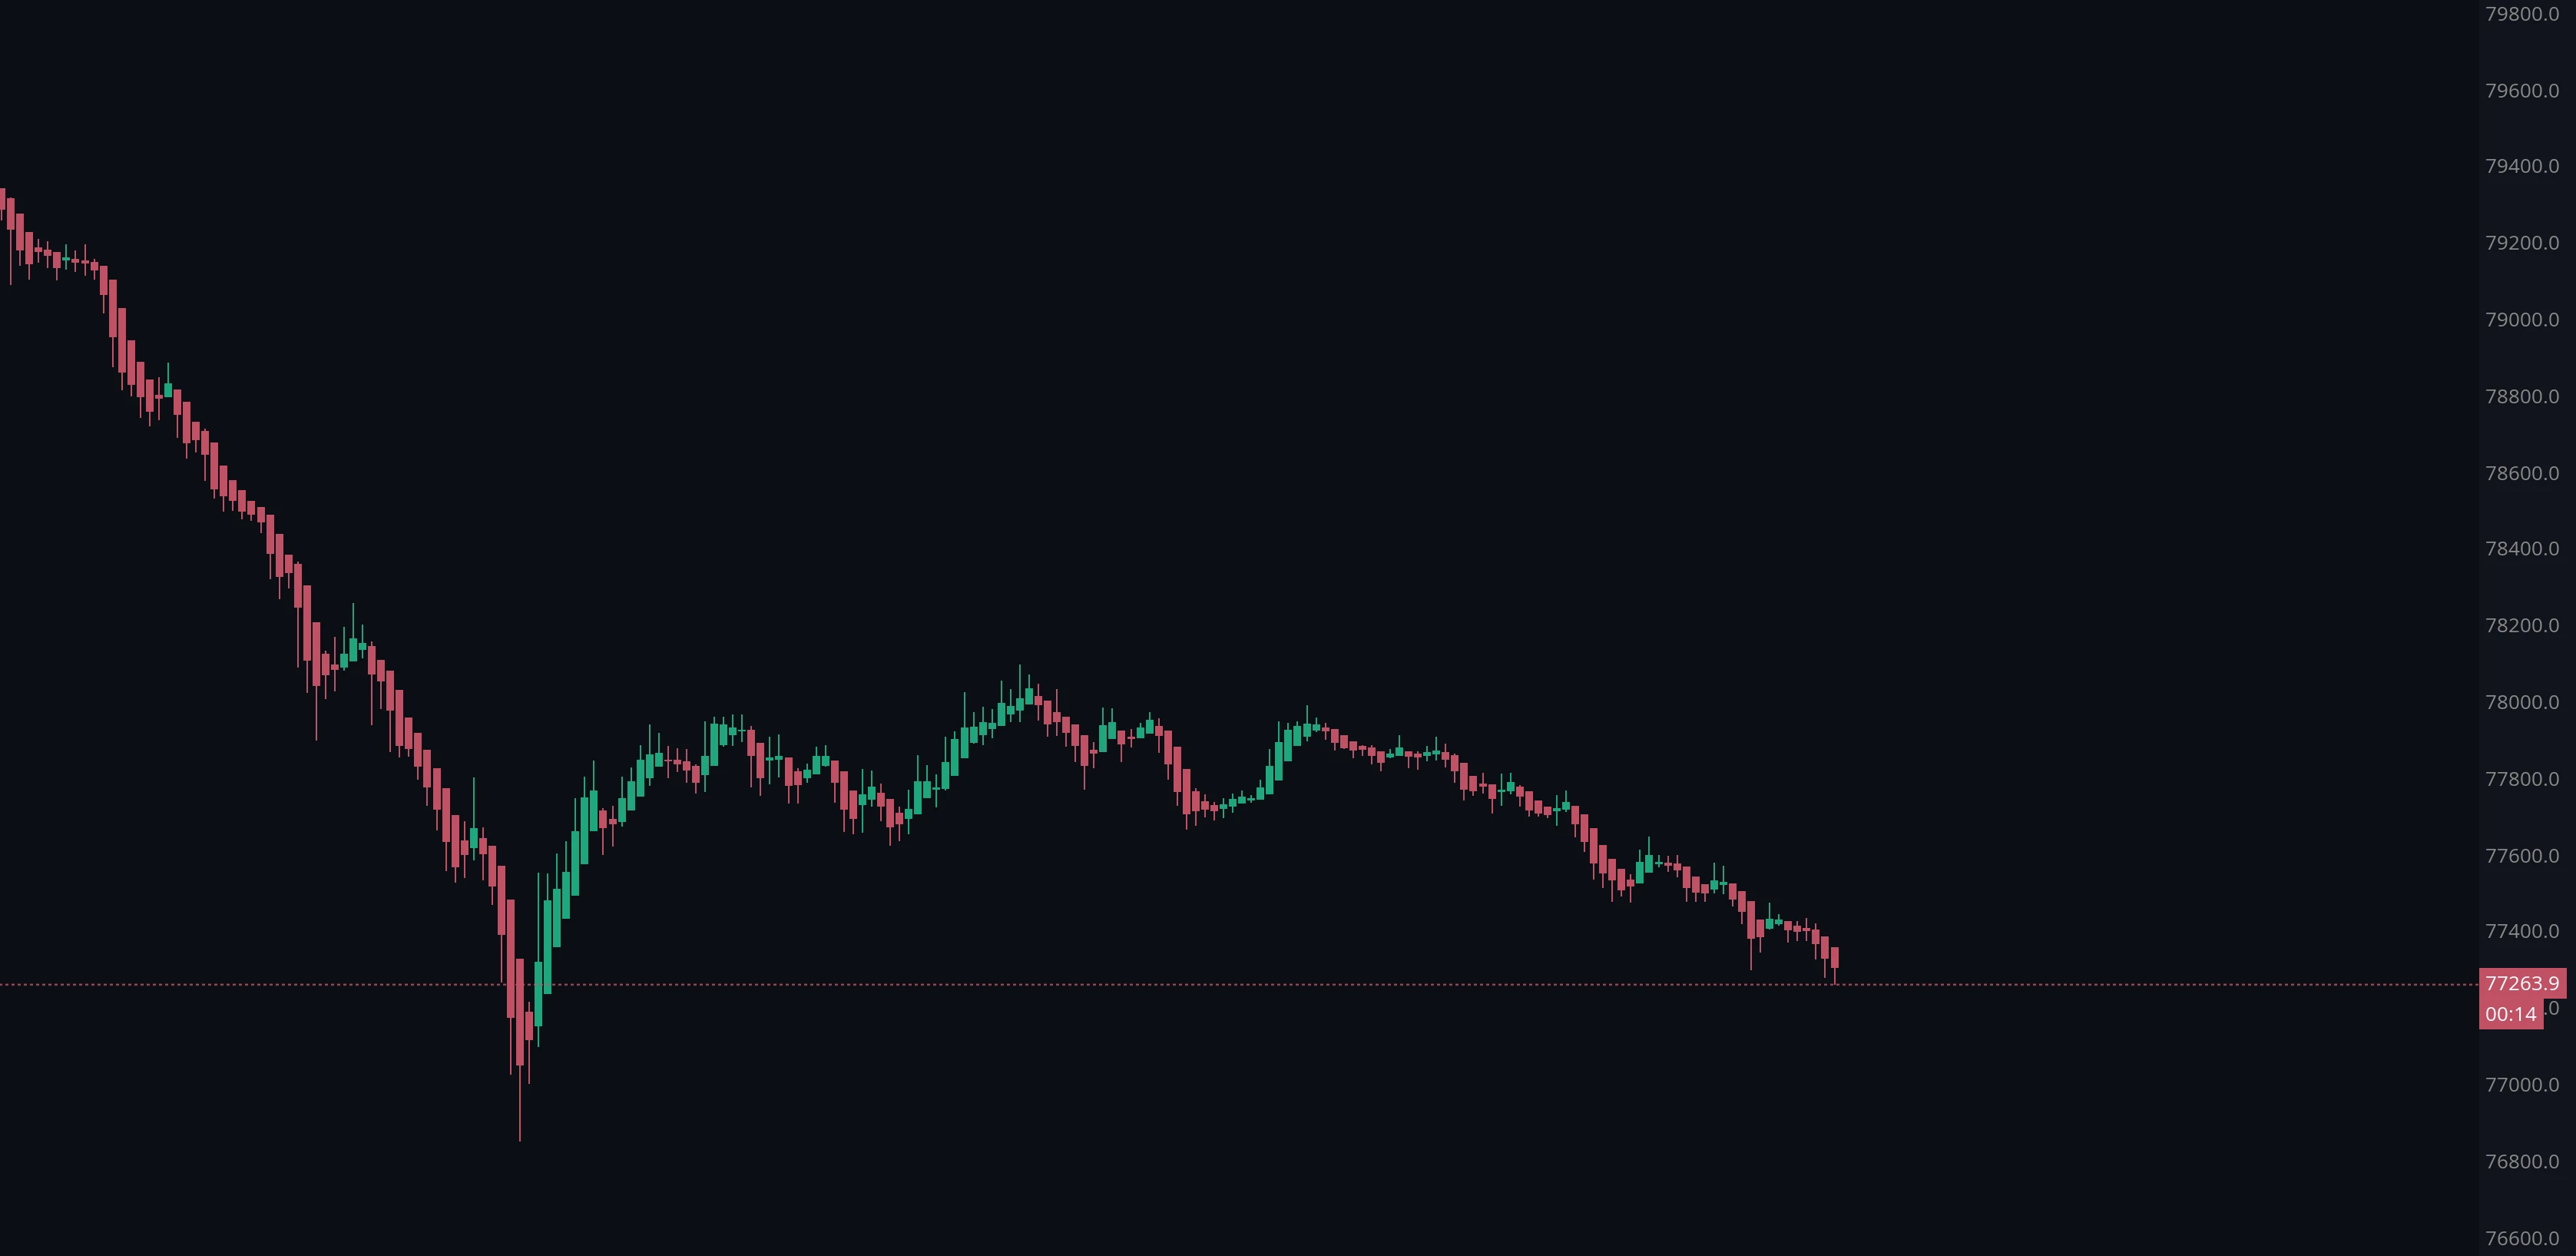
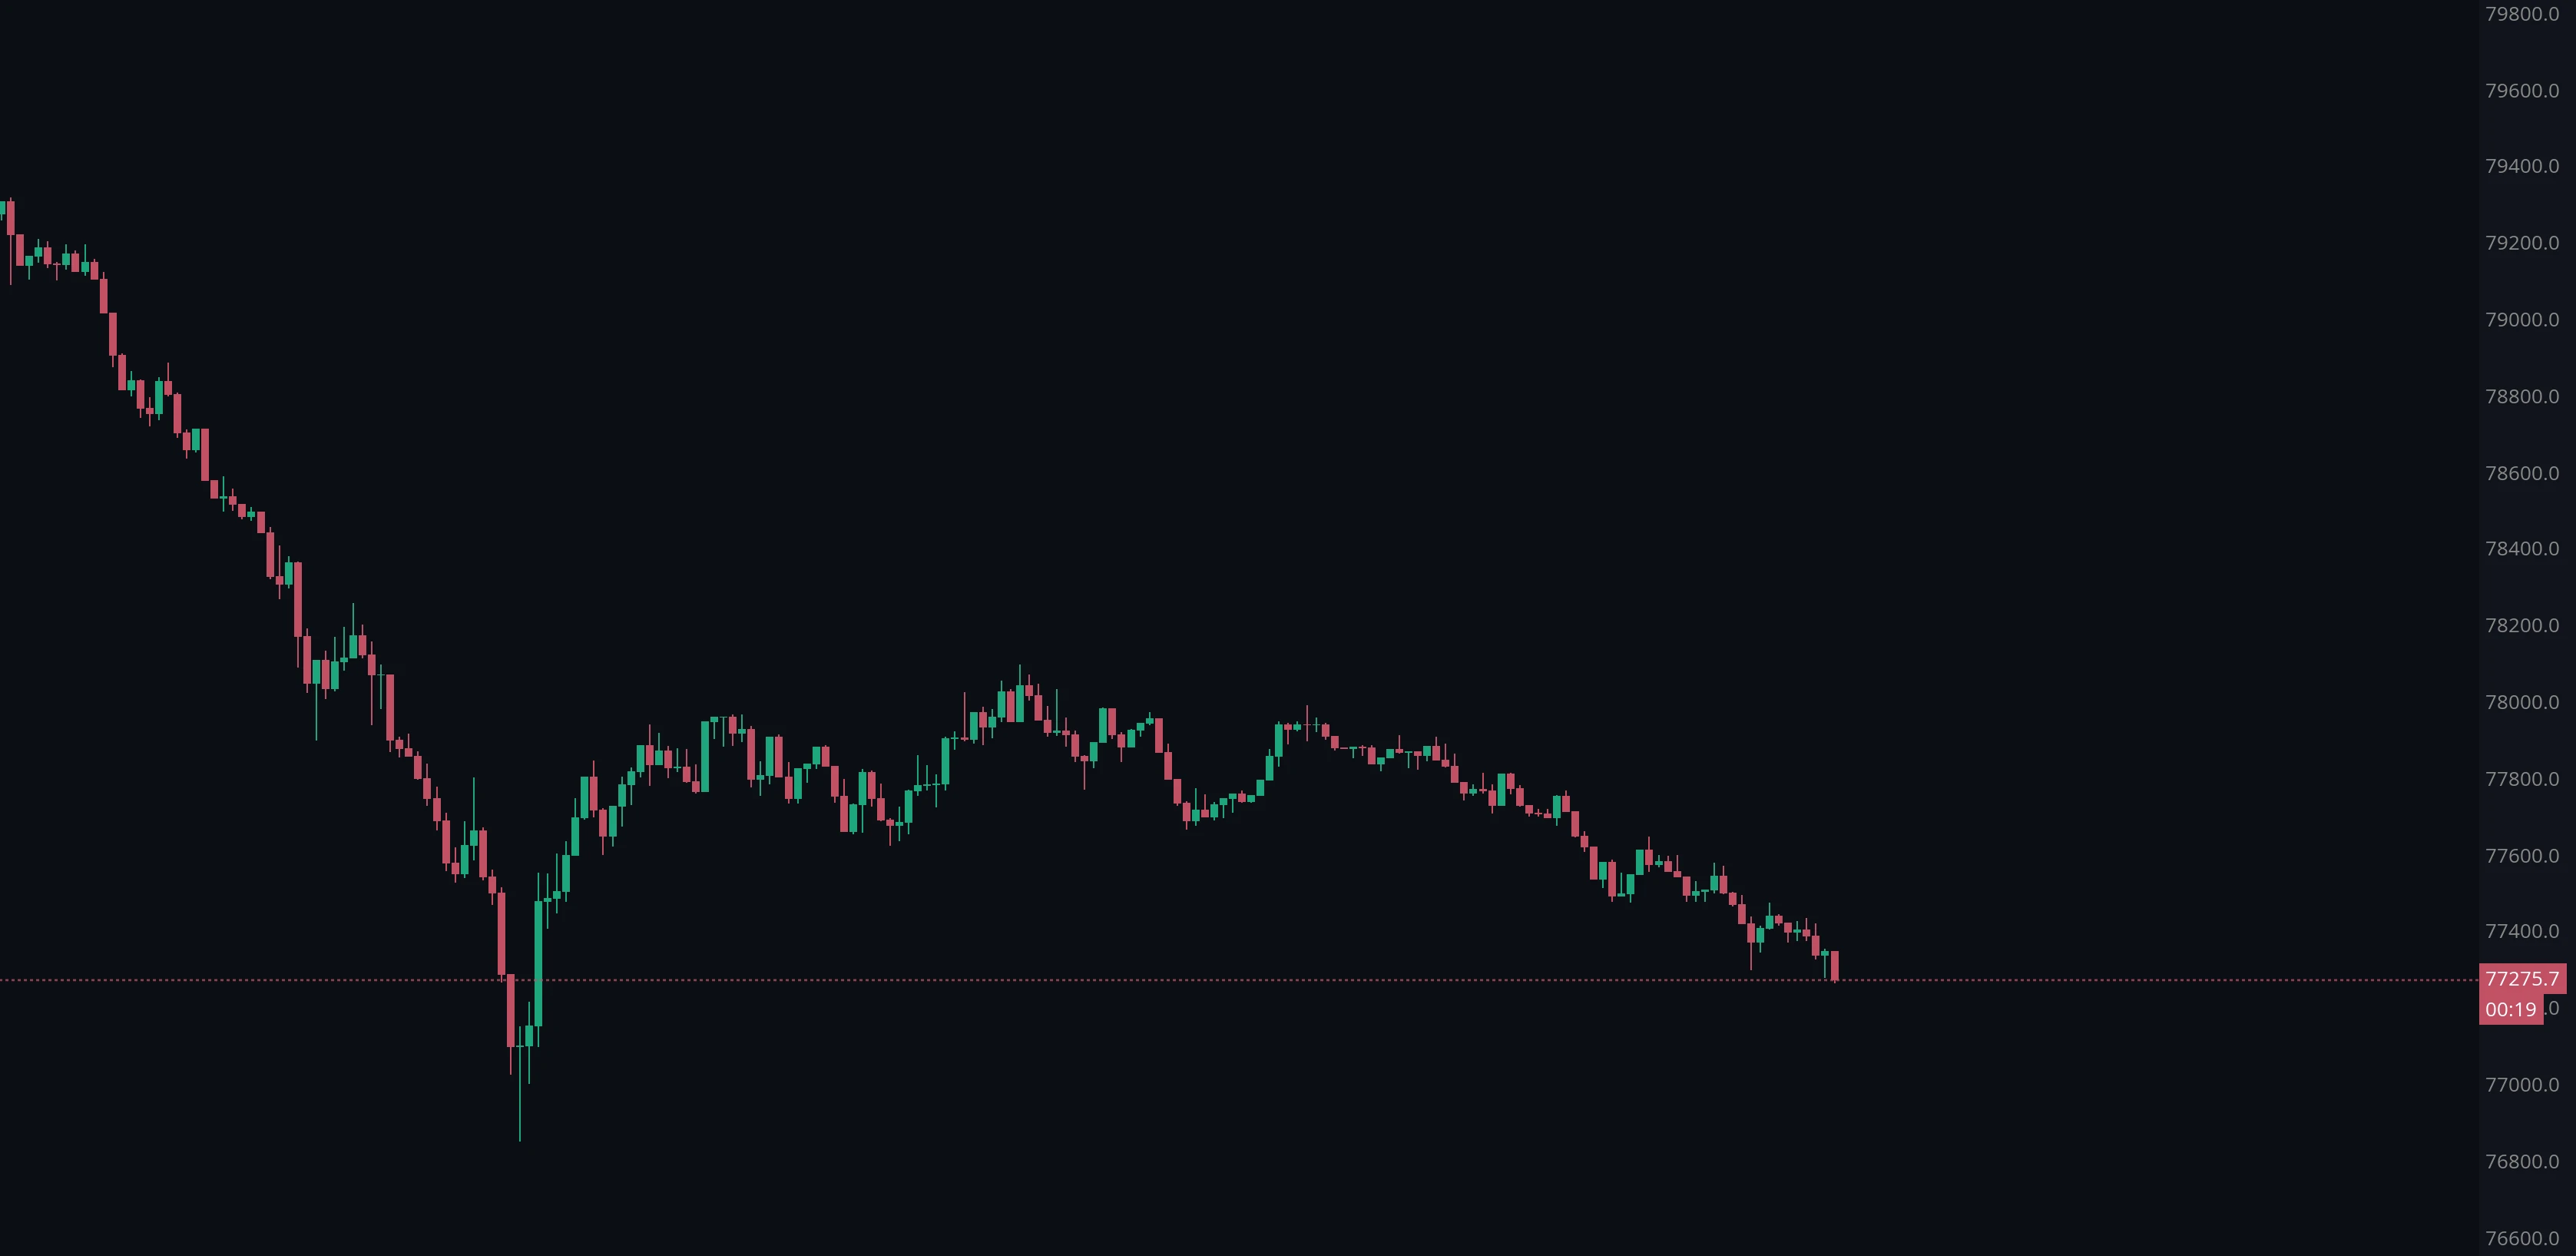
The effect is that runs of colour persist and small counter-moves are absorbed, which makes a trend easier to see and hold. The trade-off is directness: a Heiken Ashi open and close are calculated values, not prices the market actually traded at. It is a lens on price rather than a record of it, useful for reading trend and unsuitable for reading exact levels.
What is the difference between a line chart and an area chart?
A line chart plots the close of each interval and nothing else. Everything about the range is discarded, which sounds like a loss but is often the point: with the wicks and bodies gone, the path of the market is all that remains.
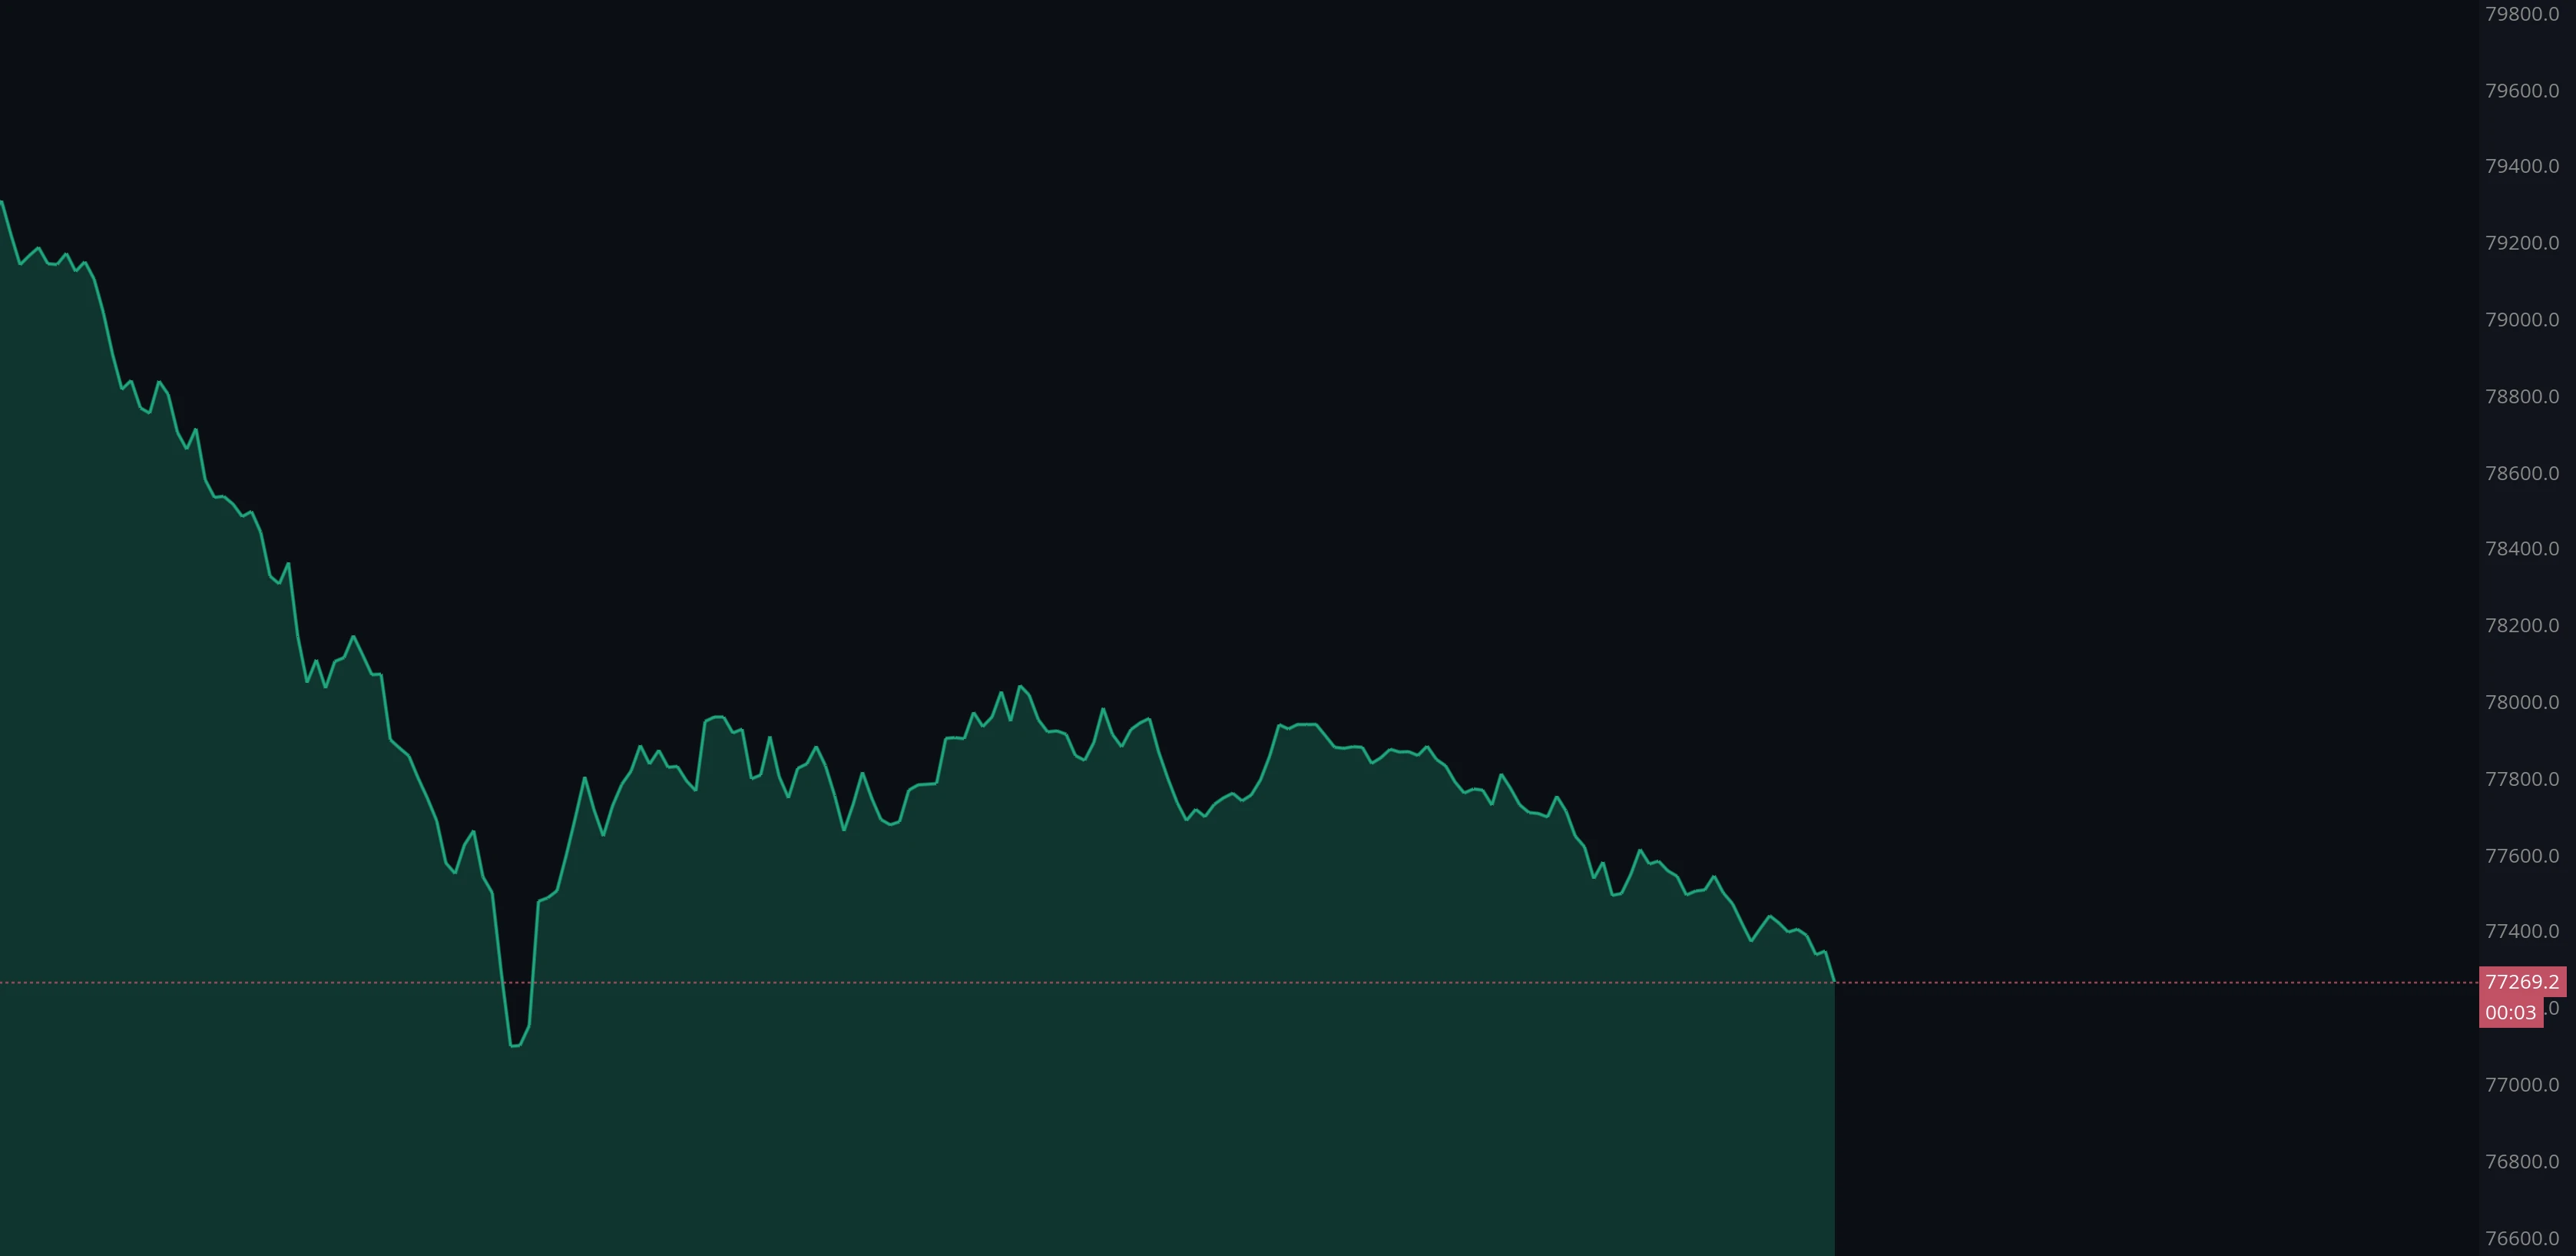
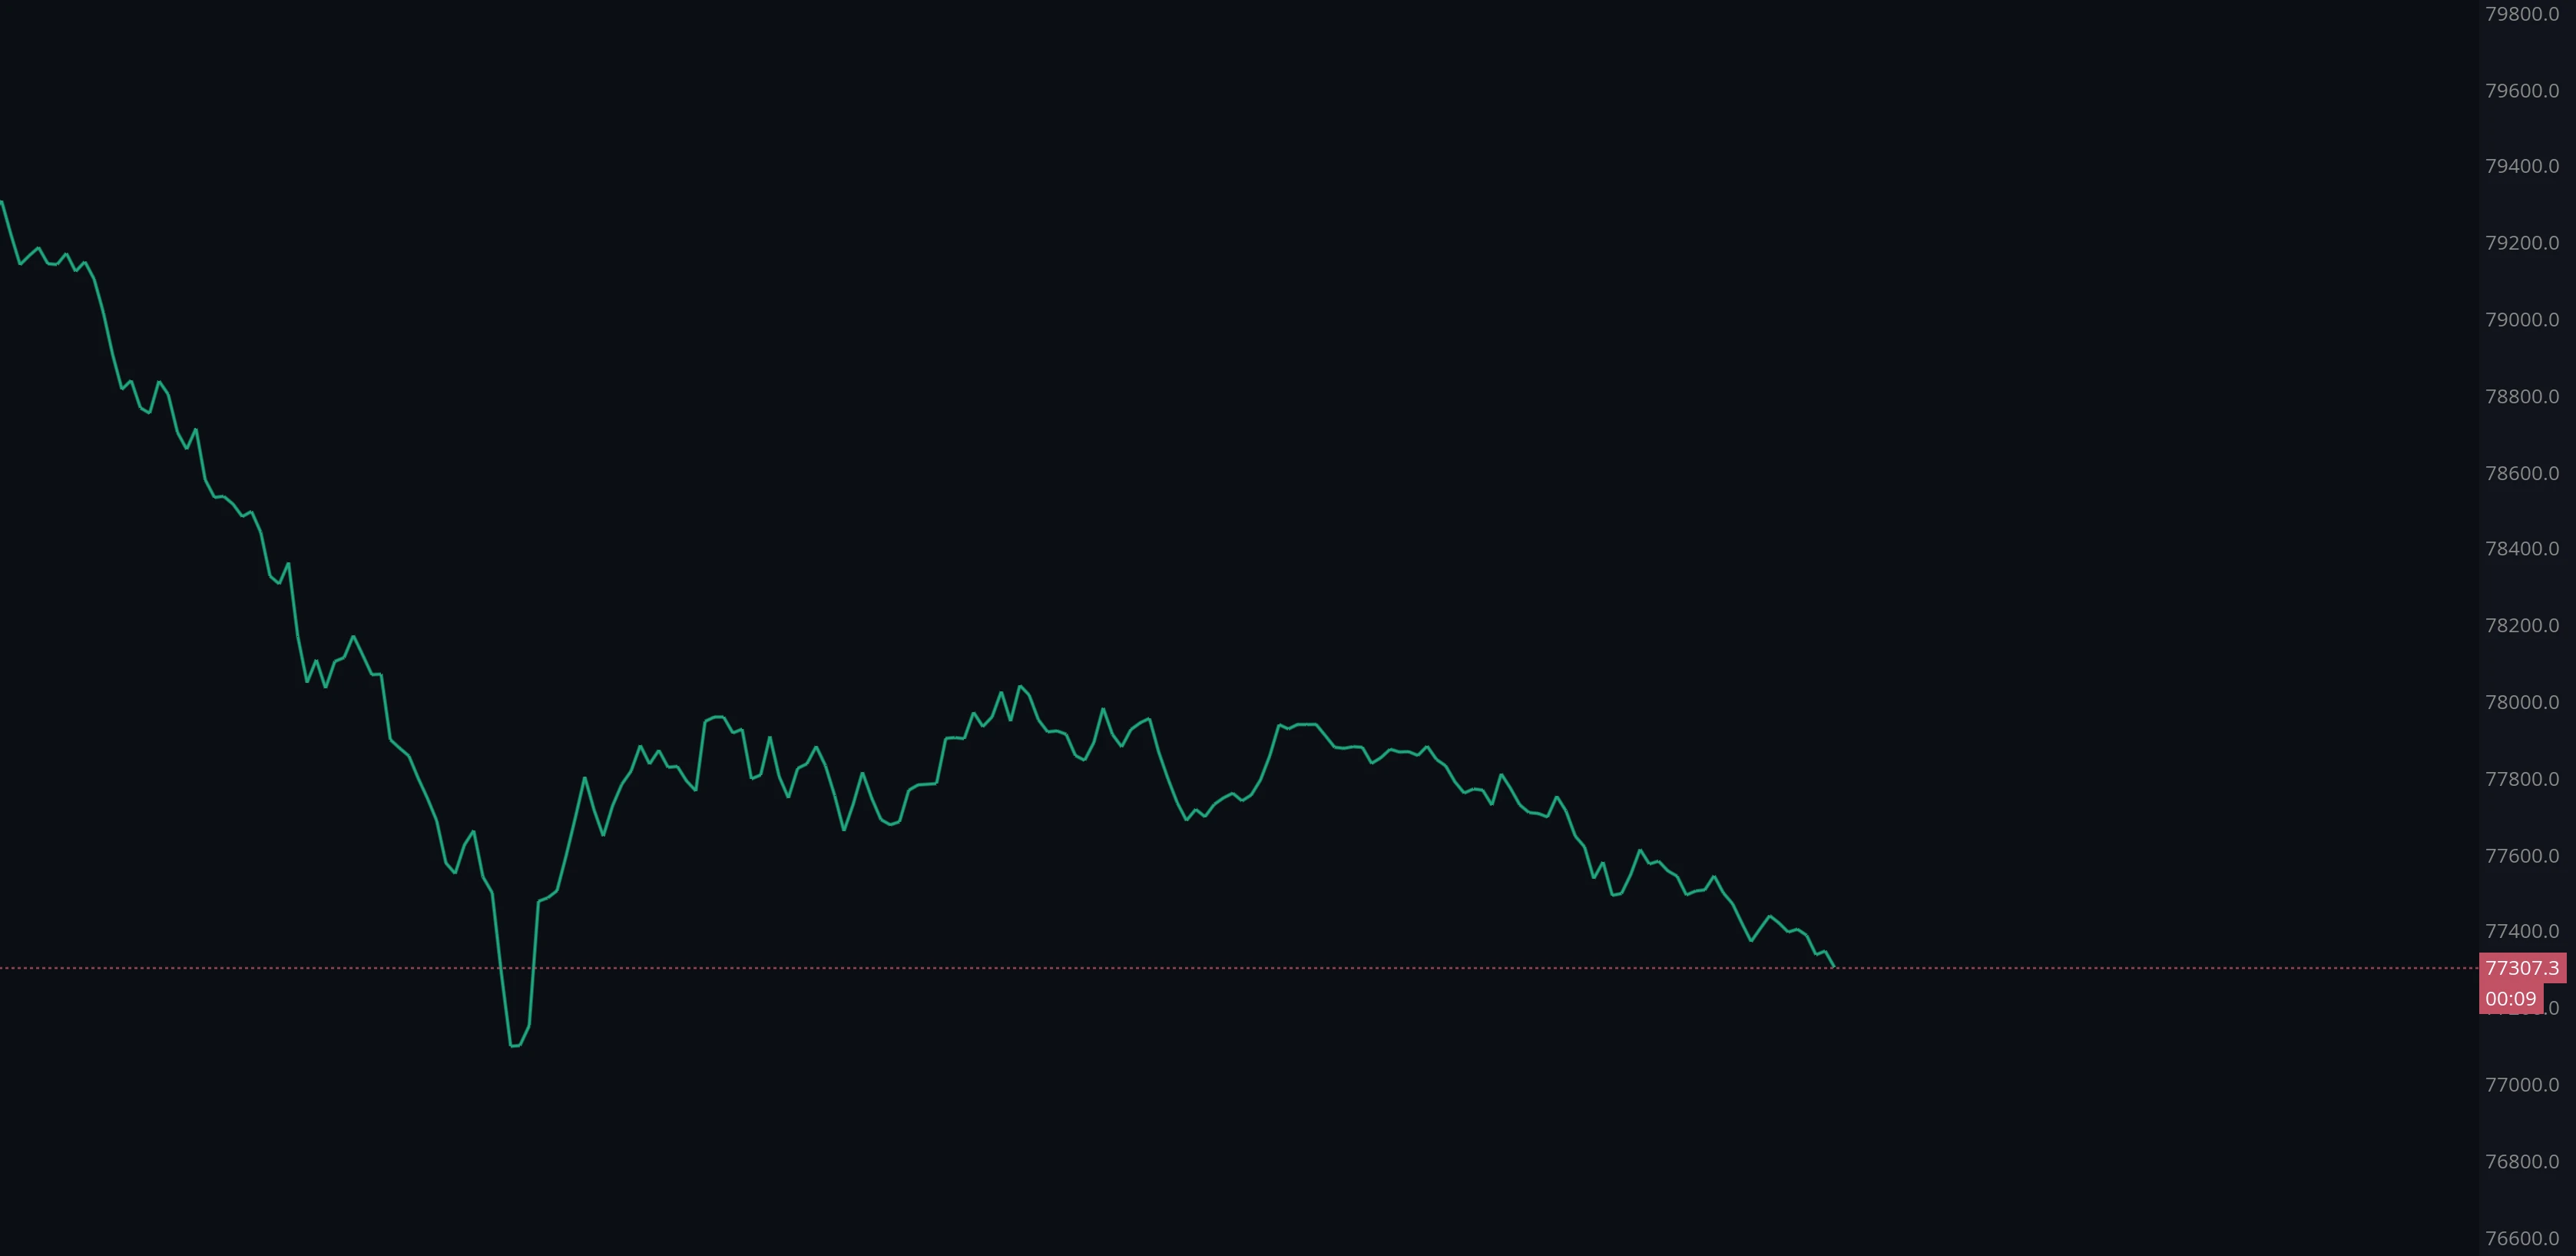
An area chart draws the same line with the space beneath it filled. It reads more strongly at a glance, and suits charts where price is context for something else rather than the main subject.
Which chart type should you use?
The choice decides what the chart is good at.
Use candlesticks when the levels matter: reading structure, marking highs and lows, judging rejection from a wick. Use Heiken Ashi when direction matters more than precision and the individual candles are getting in the way of the trend. Use a line or area chart when price is not the thing you are studying, and is there to give context to a liquidity or volume layer.
When four values per interval is not enough - when you need to see how volume distributed across prices inside a candle, and which side traded aggressively - the answer is not a different drawing of the same summary but a different dataset. That is what a footprint chart provides.
Related: Footprint charts · Order book heatmap · Volume Profile Visible Range (VPVR)
Using the OHLC layer in MMT
In MMT the price plot is the OHLC layer. It reads the market’s trade stream, groups it into the chart’s timeframe, and draws each interval in whichever style you choose - candles, Heiken Ashi, line or area - switched at any time without changing anything else on the chart. It also owns the price marker: the labels, line and countdown that show where the market is trading right now.
How do you add it to a chart?
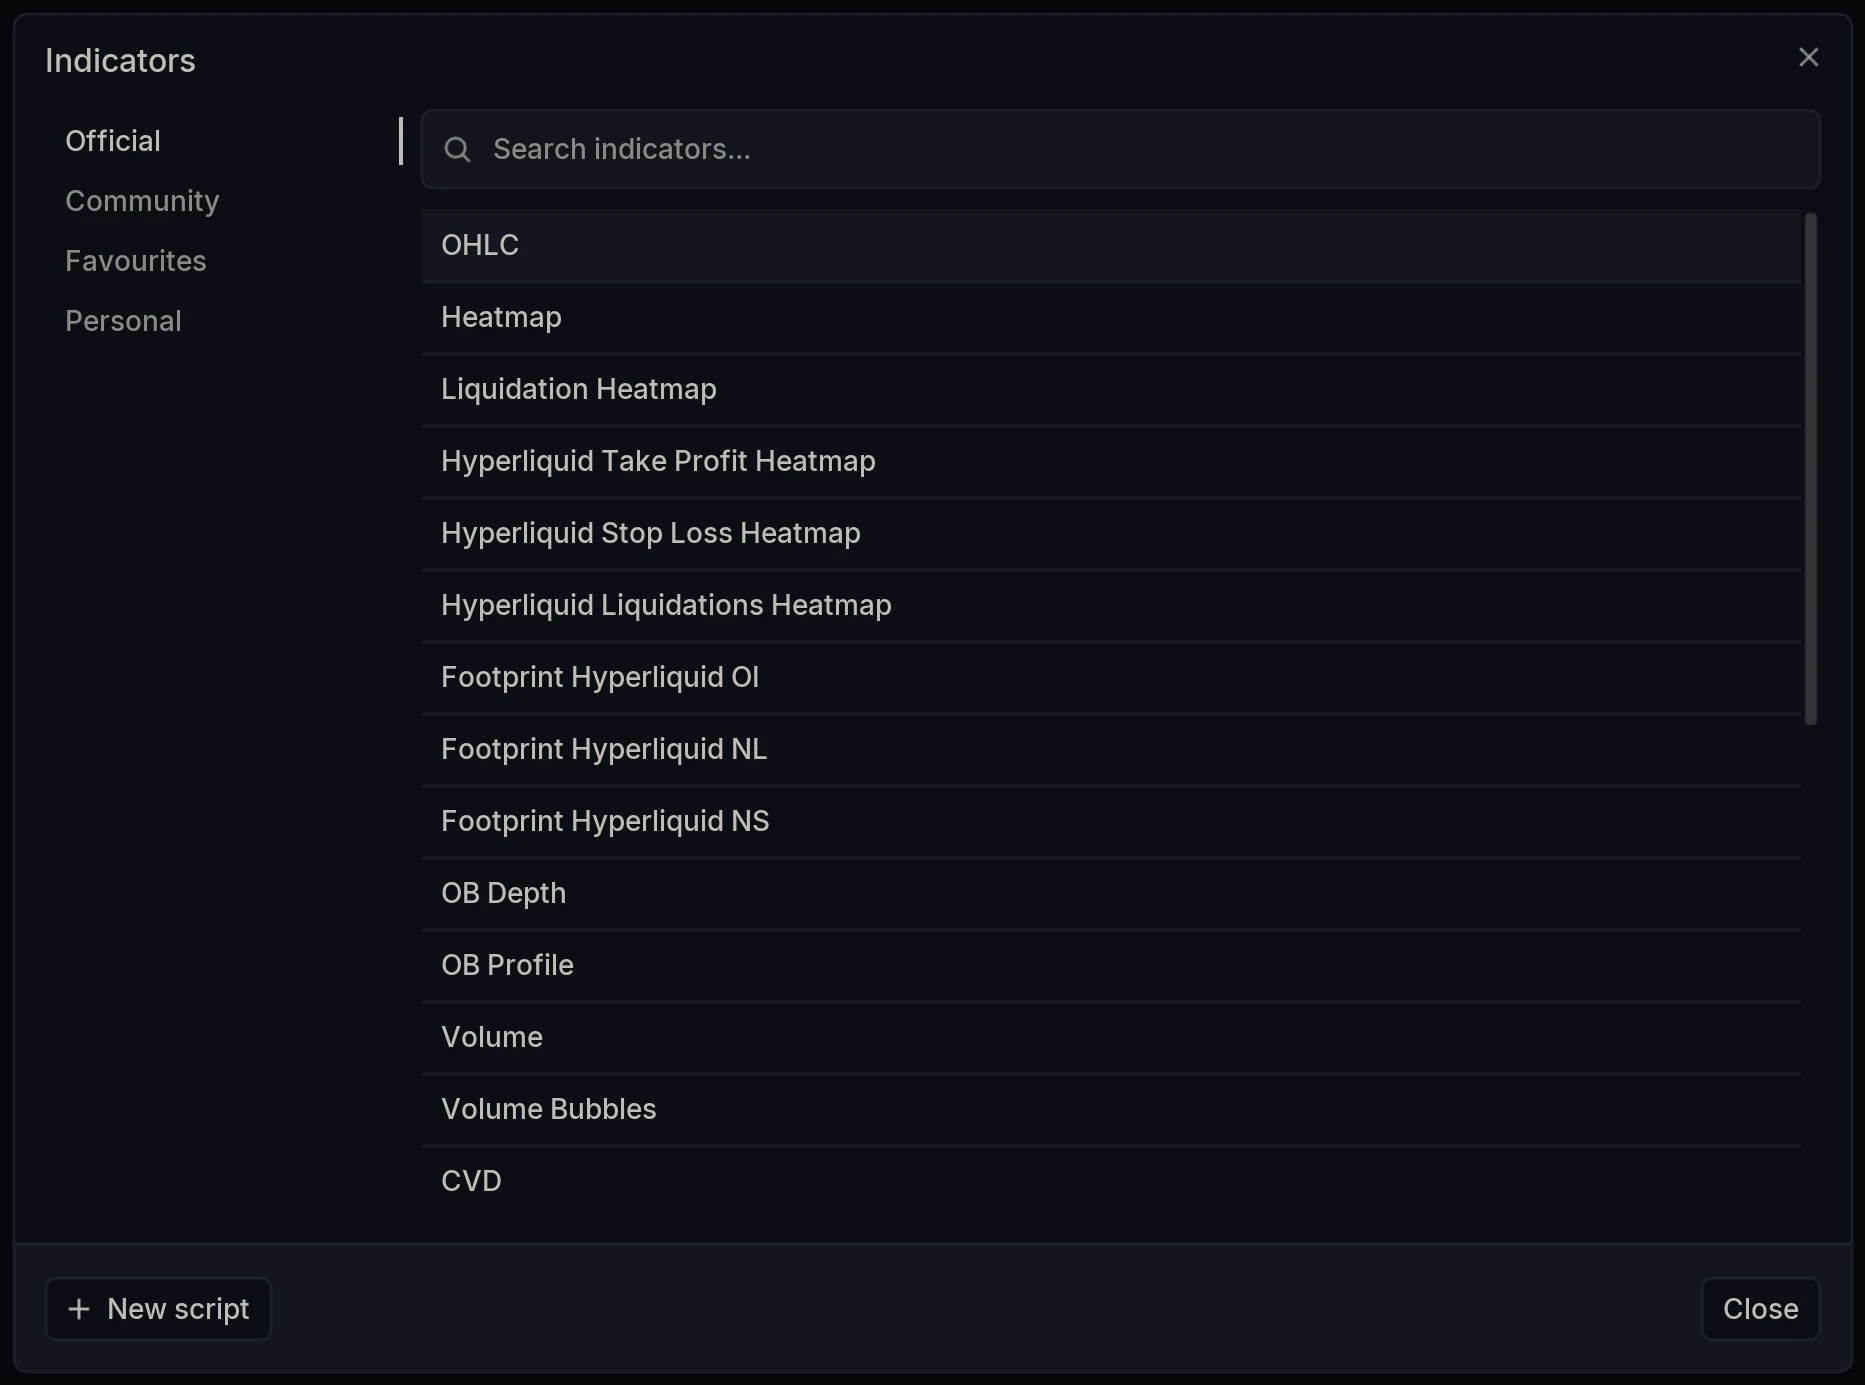
New charts include the OHLC layer automatically. To add it manually, open the Indicators dialog and select OHLC under Official - it sits at the top of the list.
How do you switch chart type?
The render mode can be changed in two places. The chart type button in the chart toolbar - beside the timeframe and Indicators - opens a menu listing OHLC candles, Heiken Ashi, Line chart, Area chart, Footprint cluster and Footprint profile together. The Render dropdown inside the settings panel covers the four OHLC modes. Choosing a footprint from the toolbar menu swaps the layer type entirely, which is why footprints appear there and not in the Render dropdown.
Alt: “The Render dropdown being switched through Candles, Heiken Ashi, Line and Area, with the chart redrawing in each mode.”
Switching the Render dropdown through all four modes on the same market makes the differences plain. The candle chart shows every hesitation and every wick; Heiken Ashi resolves the identical data into longer, cleaner runs of colour; Line strips it back to the path alone; Area fills beneath that path so price reads as a backdrop. Nothing about the data changes, only what the chart chooses to show you.
Tip: Because layers like the order book heatmap already fill the chart with detail, switching price to Line often makes both easier to read.
Layer Settings
Open OHLC Settings via the cog wheel on the layer name - the same control on every indicator. The panel has two tabs: Price Marker and Display.
Price Marker
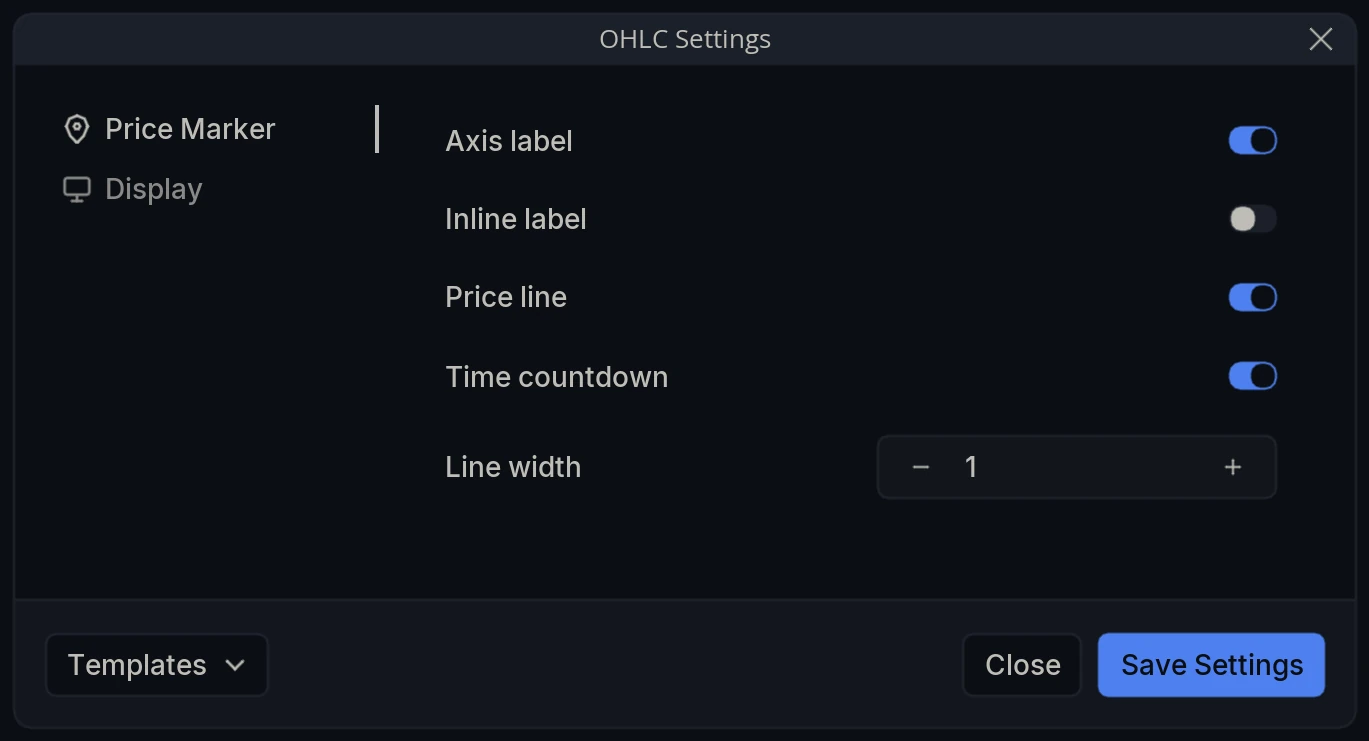
Axis label - Show the current price as a label on the price axis.
Inline label - Show the current price as a label on the chart itself, alongside the price line.
Price line - Draw a horizontal line across the chart at the current price.
Time countdown - Show the time remaining until the current candle closes.
Line width - Thickness of the price line.
Display
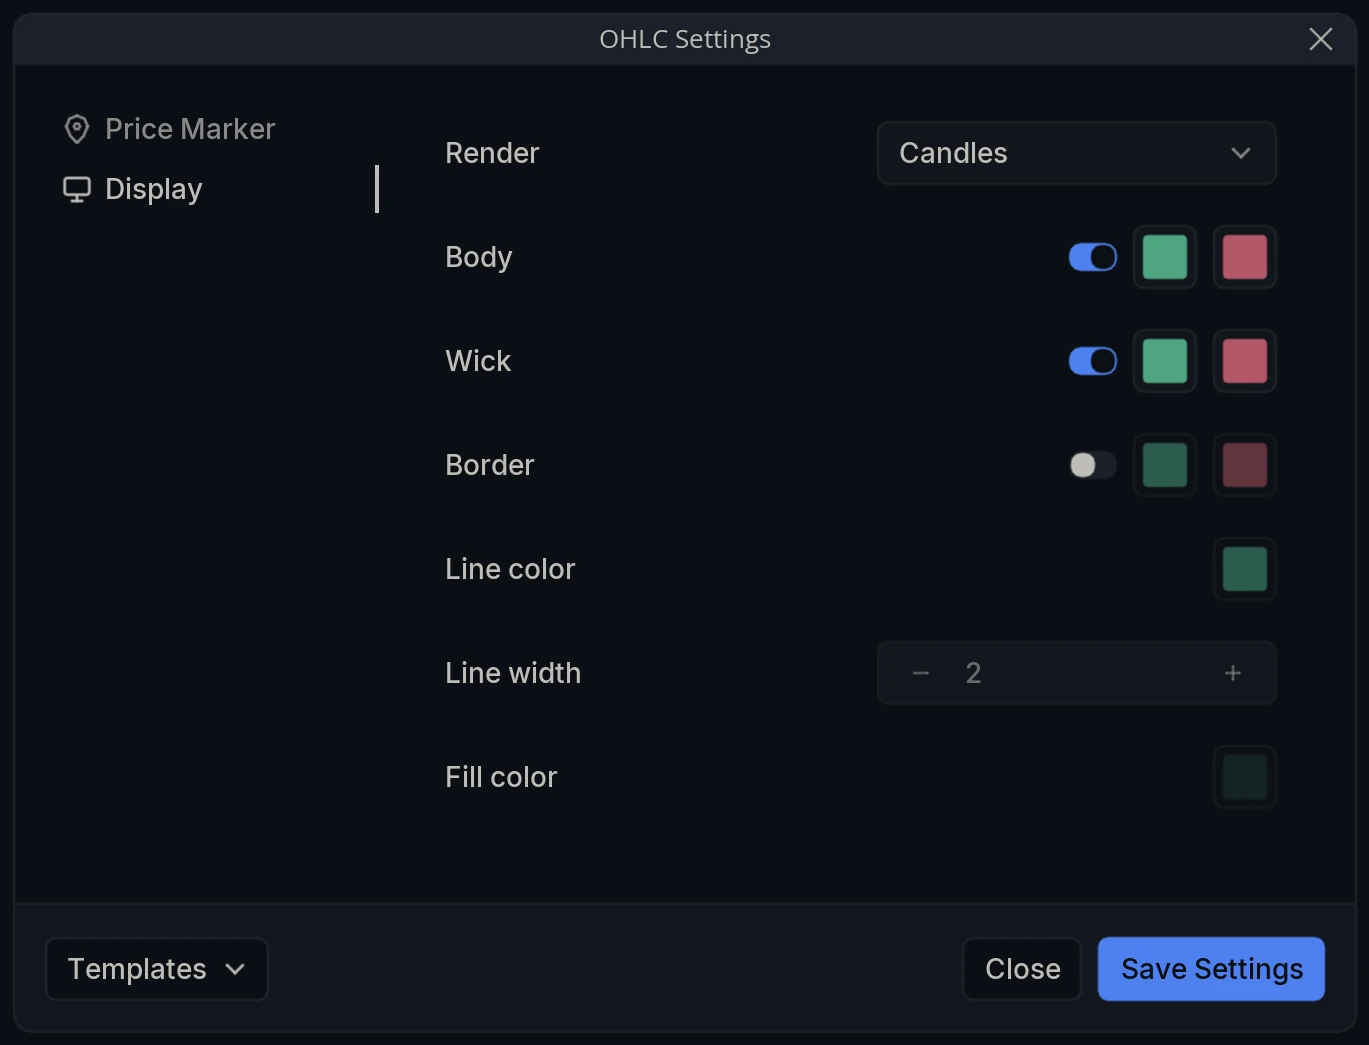
Render - Choose how price is drawn: Candles, Heiken Ashi, Line or Area. The rest of the tab stays in place whichever you pick; settings that do not apply to the current mode are greyed out.
Body - Toggle the candle body, and set its colours - the first for candles that close up, the second for candles that close down.
Wick - Toggle the wicks, and set their up and down colours independently of the body.
Border - Toggle an outline around the body, with its own up and down colours.
Line color - Colour of the plot in Line and Area modes.
Line width - Thickness of that plot.
Fill color - Colour of the shaded area beneath the plot in Area mode.