What is a liquidation heatmap?
By MichaelUpdated August 26, 2026
A liquidation heatmap estimates where leveraged positions would be forced to close, and plots those price levels as bands of color. Bright areas mark prices where a large amount of leverage is projected to be liquidated, so the chart shows where forced buying or selling is likely to occur.
How does a liquidation heatmap work?
Every leveraged position has a price at which the exchange closes it. That price is not arbitrary: it follows from the entry and the leverage used. A position opened at 100,000 with 10x leverage runs out of margin roughly 10% away; the same entry at 100x runs out roughly 1% away. Leverage sets the distance, the entry sets the starting point.
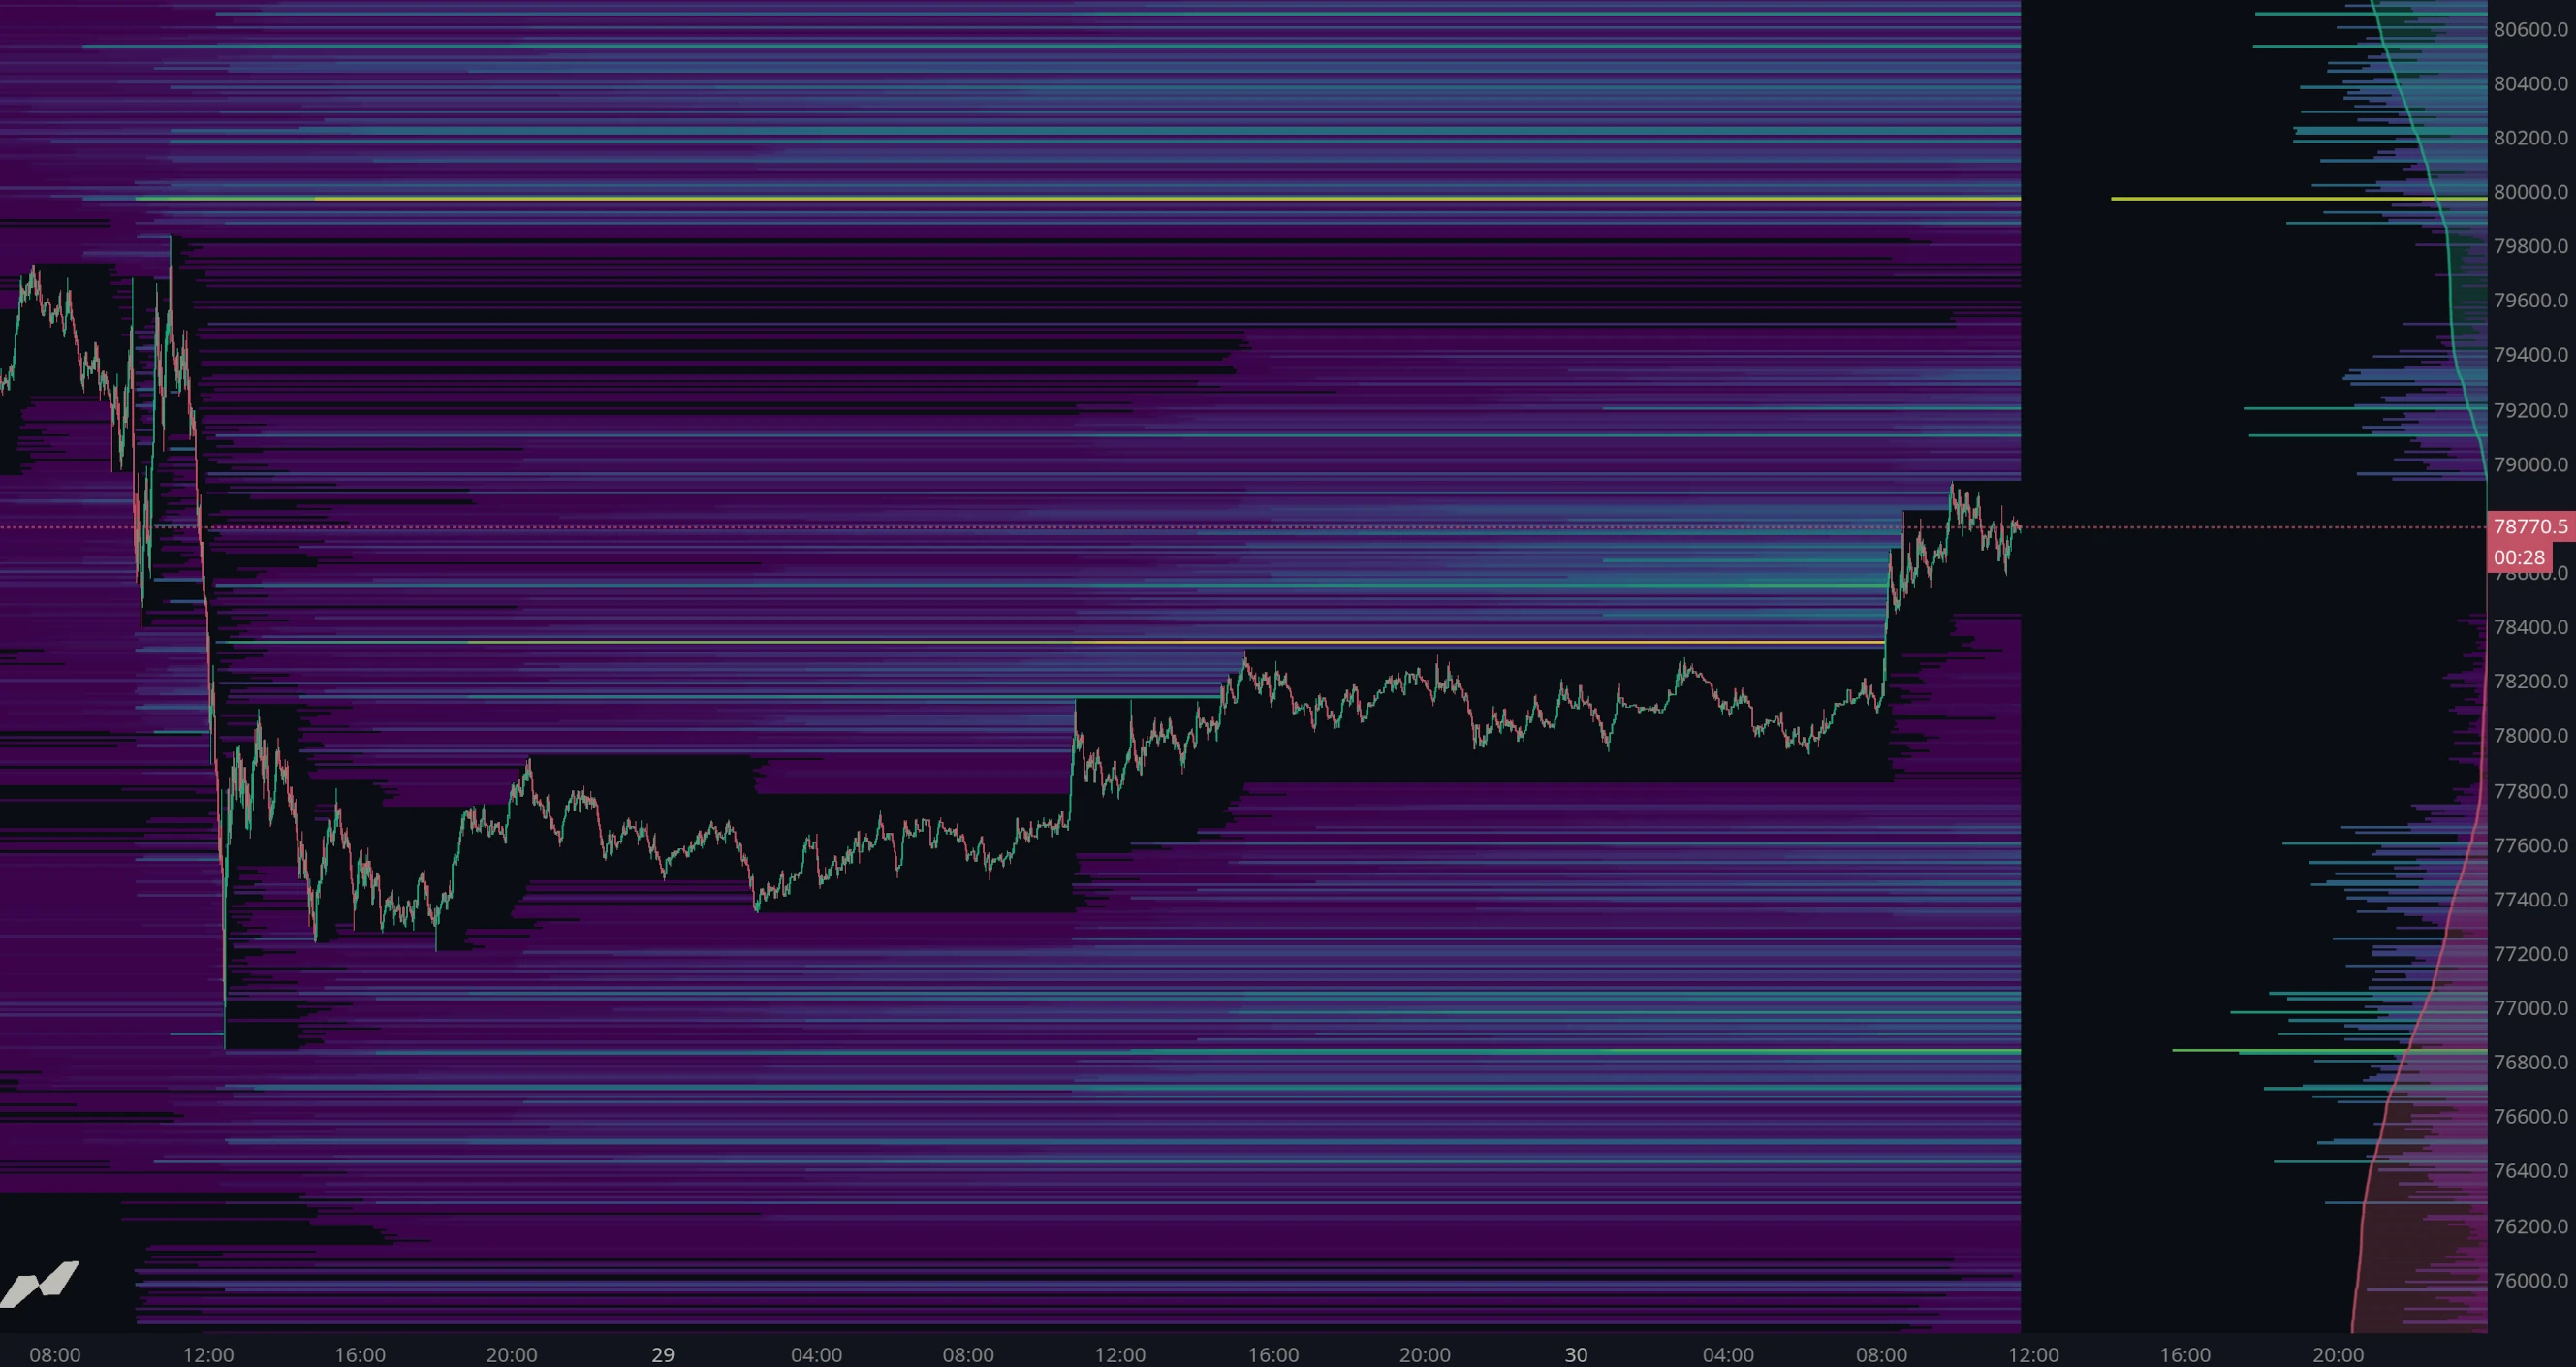
A liquidation heatmap applies that arithmetic across the whole market. Working from where positions were opened and at what leverage they plausibly ran, it projects each one forward to the price that would close it, then adds them all up. Prices where many projected liquidations land come out bright. Prices where few land stay dark.
The result is a forward-looking map. It is not a record of anything that has happened; it is an estimate of what is sitting out there waiting to happen if price reaches a given level.
That is worth being precise about, because it is the source of both the tool’s value and its weaknesses. Nobody publishes a list of open positions and their liquidation prices. The map is a model, and it is only as good as its assumptions.
What do the bright bands mean?
A bright band is a concentration of estimated liquidation prices at one level. If price reaches it, a large amount of forced closing is expected to execute there.
Direction follows position. Bands above the current price are where shorts would be liquidated, and a liquidated short is force-bought, so reaching that level should produce buying. Bands below price are where longs would be liquidated, and a liquidated long is force-sold, so reaching that level should produce selling. The map is asymmetric by nature: what sits above and what sits below are two different pools of fuel.
Two readings follow from that.
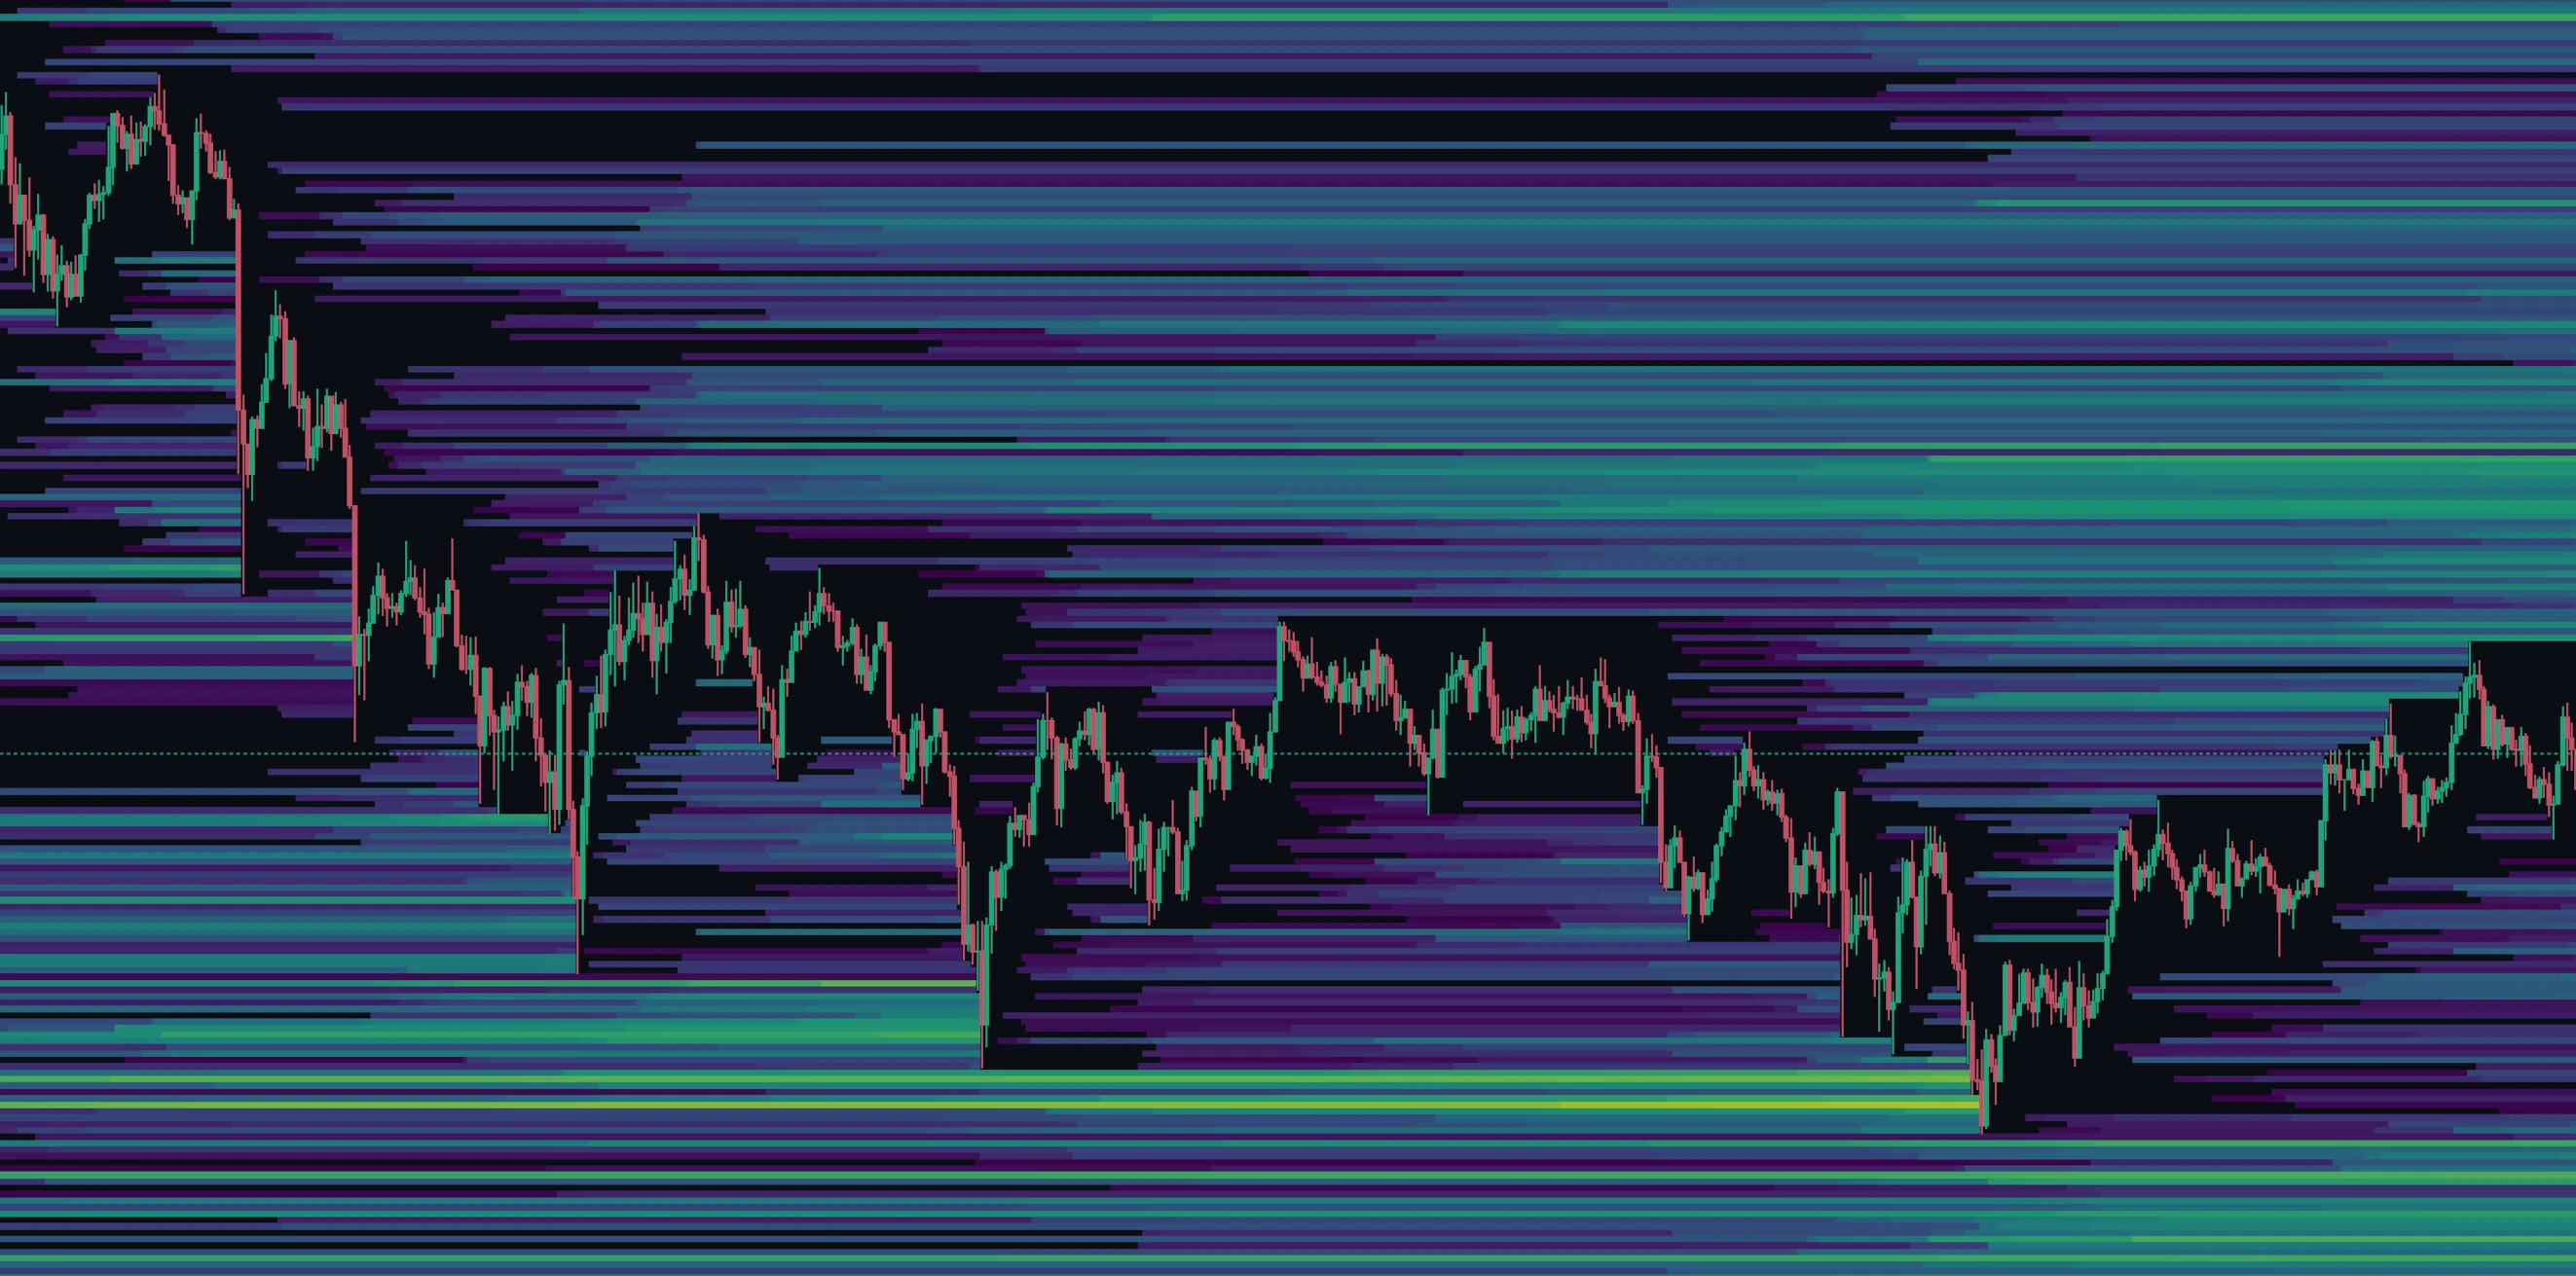
Clusters attract price. A large band is a pocket of guaranteed market orders. Markets tend to move toward liquidity rather than away from it, and a heavy cluster sitting a few percent away is a plausible target, which is why traders speak of price being drawn toward liquidations.
Clusters accelerate moves. Reaching a band supplies aggression that was not there before, and that aggression pushes price further in the same direction, potentially into the next band. That is the cascade mechanic, and the map shows you its fuel in advance.
It follows that the map is not a fixed set of levels. Once price trades through a band, the positions behind it have been closed and cannot be liquidated a second time, so that band is spent. Meanwhile new positions are being opened at the prices price is trading at now, and those create new bands of their own.
What you are looking at is leverage as it stands at this moment, redrawn as positioning changes beneath it. A cluster is worth watching because it exists today, not because it will still be there next week.
Why does leverage matter on the map?
Leverage decides how far a liquidation price sits from its entry, so each leverage tier produces a different layer of the map.
High leverage sits close. A 100x position is liquidated by a move of roughly 1%, so those levels crowd tightly around the current price and are consumed constantly by ordinary volatility. They are the most likely to be hit and individually the least significant.
Low leverage sits far. A 5x position needs roughly a 20% move, so those levels lie well outside the recent range. They are rarely reached, but when they are, they belong to larger and more patient positions, and clearing them tends to matter more.
Being able to separate the tiers is what makes the map usable. Looking at every leverage level at once produces a wash of color; isolating one tier answers a specific question, such as where the fast money would be flushed on a 1% move against it.
What are the limits of a liquidation heatmap?
It is an estimate, not data. Most exchanges publish nothing about individual positions, so every level on the map is inferred, and the inference rests on assumptions about entries and leverage that cannot be verified. The exception is where the underlying position data can be obtained directly: on Hyperliquid the real liquidation, stop loss and take profit levels are known rather than modelled, which is a stronger basis for a level than any estimate.
Real leverage is continuous. Positions are not opened neatly at 5x, 10x or 100x. Modelling in tiers approximates a spectrum, so the bands are indicative rather than exact prices.
Margin moves. Traders add collateral, take partial profit, or run cross margin against other positions, all of which shift a real liquidation price away from where the model puts it.
Everyone can see it. Widely watched liquidation clusters change behavior. Some participants defend them, others target them, and a level that is obvious to the whole market does not behave like a hidden one.
It says nothing about timing. A cluster can sit untouched for weeks. The map describes where, never when.
How is this different from a liquidations indicator?
They are opposite halves of the same subject.
A liquidations indicator is backward-looking. It reports forced closures that have already executed, as reported by the exchange, so it is a record of fact.
A liquidation heatmap is forward-looking. It estimates closures that have not happened yet, so it is a projection.
Used together they check each other. The map suggests where a cascade could run; the liquidations feed confirms whether one actually did when price got there, and how much was cleared.
Related: Liquidations · Open interest · Order book heatmap · Net positioning
Using the Liquidation Heatmap in MMT
MMT’s Liquidation Heatmap projects estimated liquidation levels across six leverage tiers, each of which can be toggled independently from the settings panel or from a quick toolbar on the chart. A profile alongside the map totals the estimated liquidations by price, and the whole layer can be pooled across exchanges.
How do you add the Liquidation Heatmap to a chart?
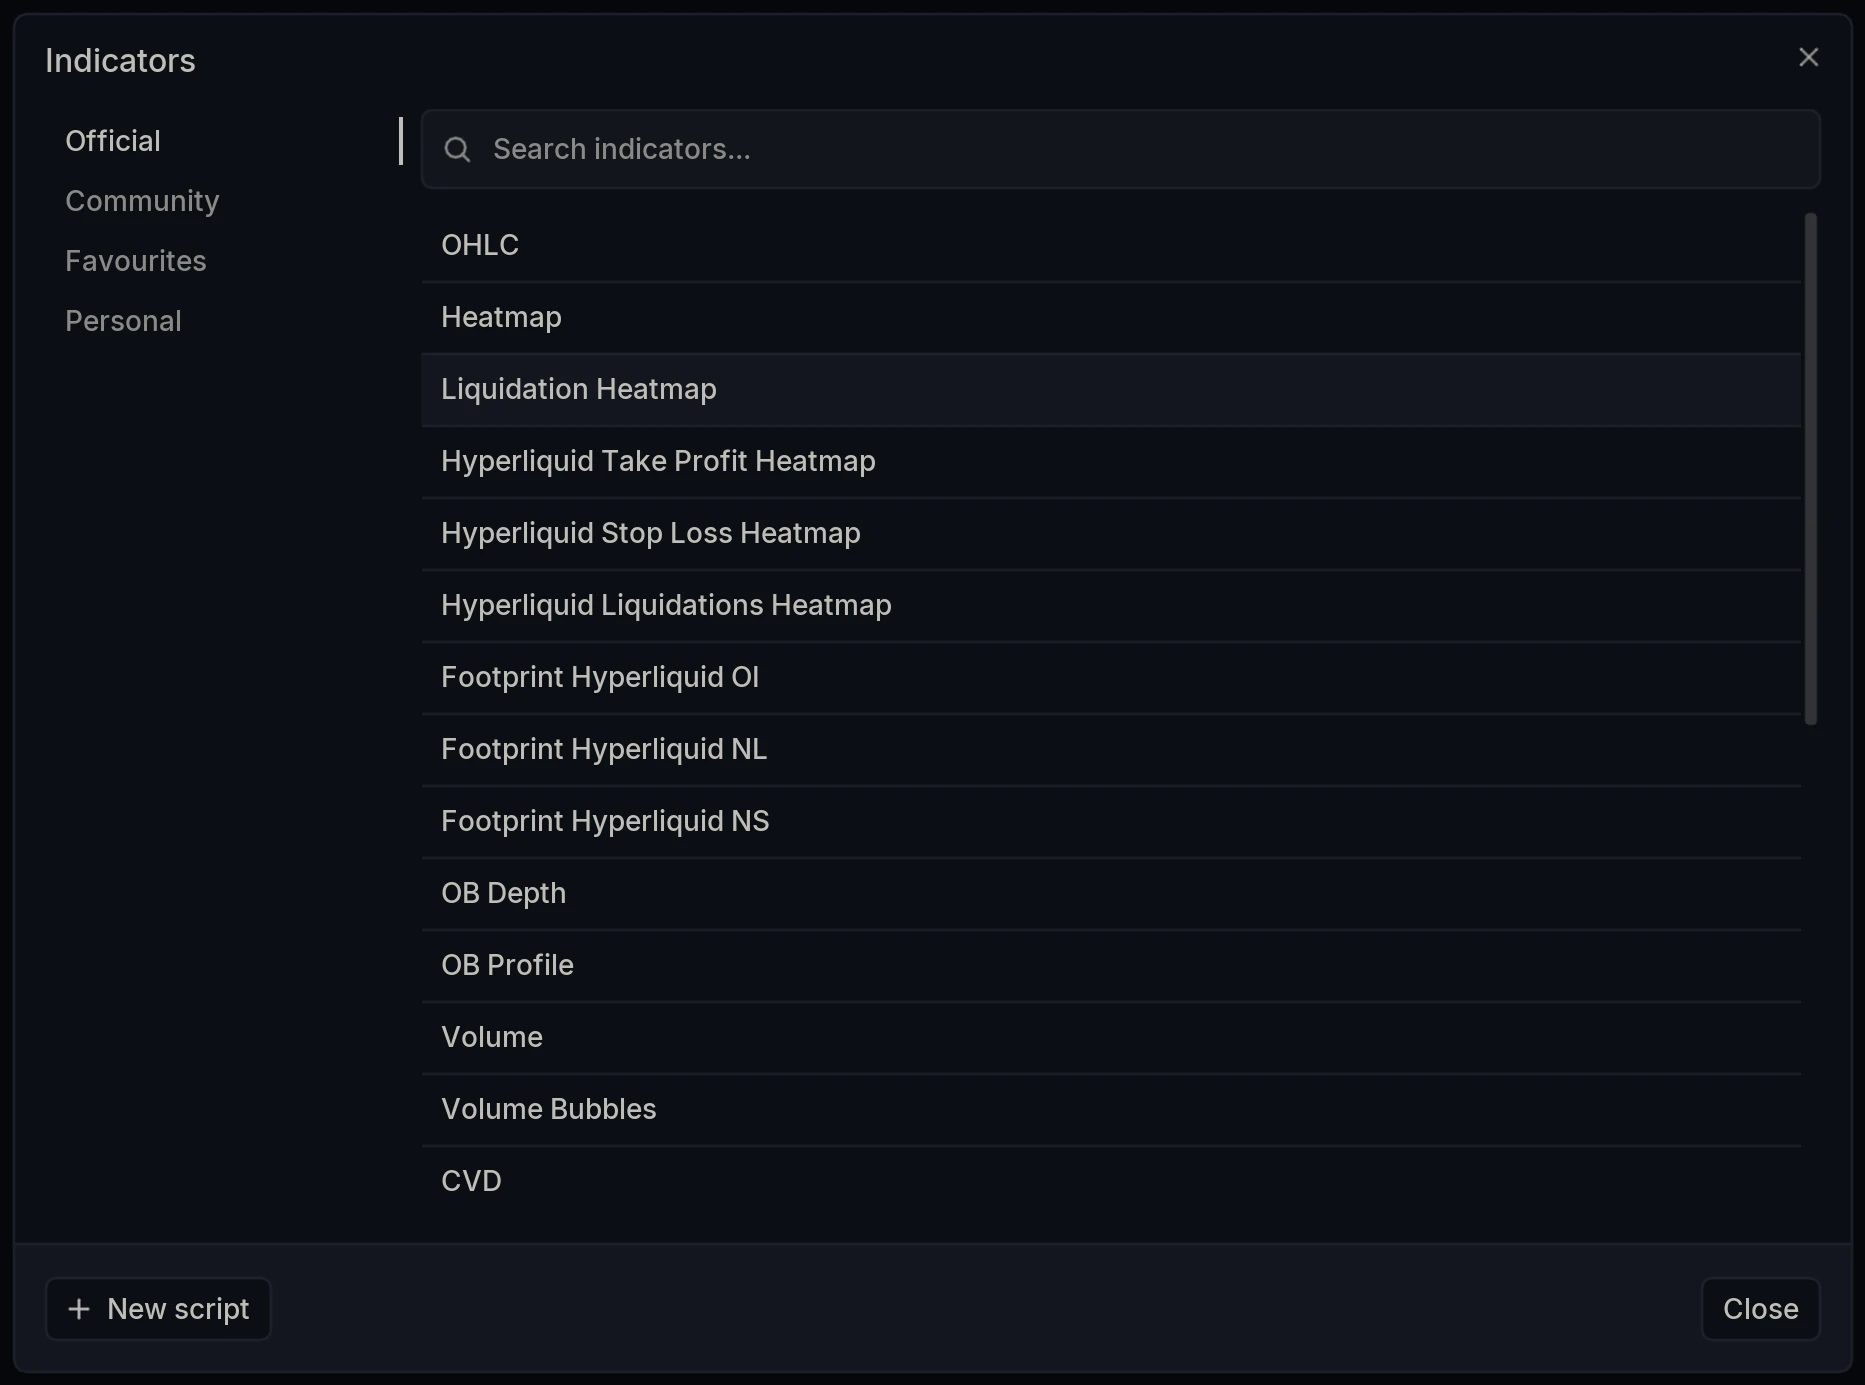
Open the Indicators dialog and select Liquidation Heatmap under Official.
What does the liquidation profile show?
Show liquidation profile draws a horizontal histogram against the price axis, totalling the estimated liquidations at each level so the concentrations can be compared directly rather than judged by brightness alone.
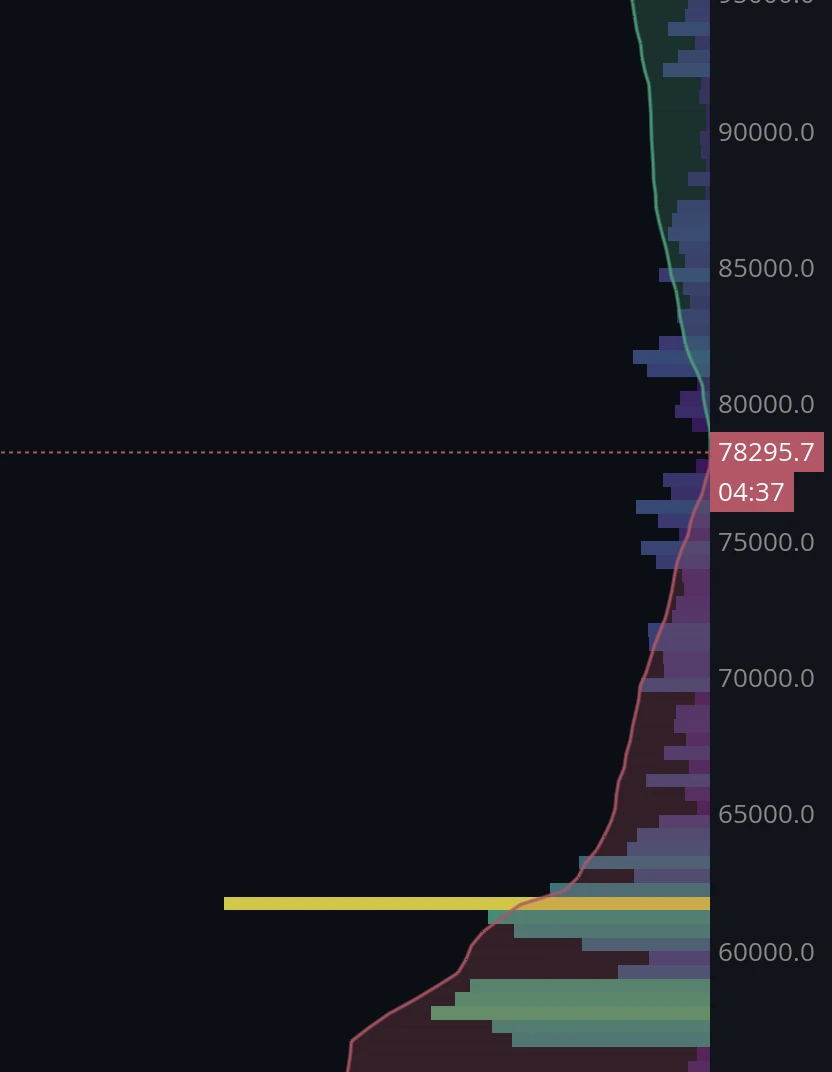
Each row is colored by the active colormap, so the heaviest levels stand out in the brightest color. Profile outline traces the shape of the profile as a line, drawn separately above and below the current price, which makes the split between the two pools obvious: everything traced on one side is shorts waiting to be force-bought, everything on the other is longs waiting to be force-sold.
Profile width sets how far the histogram extends across the chart, and Profile scale multiplies the row lengths, which is useful when one enormous level would otherwise flatten everything else.
How do you switch leverage tiers?
Six tiers are available: 5x, 10x, 25x, 50x, 75x and 100x, each toggled independently. All are on by default.

The Quick toolbar puts those toggles on the chart itself, along with a cog for the full settings and a handle for repositioning it. Because isolating a tier is the main thing you do with this layer, it is worth leaving on.
How do Colormap and Gamma work?
Colormap and Gamma do the same job here as on the order book heatmap. The colormap sets the palette, with the built-in options and any custom colormaps both available. Gamma is the contrast curve: raising it suppresses the weak levels so that only genuine concentrations render brightly, which matters more here than on most layers because a map with every tier enabled contains a great deal of faint noise.
Layer Settings
Open Liquidation Heatmap Settings via the cog wheel on the layer name or the cog on the quick toolbar. The panel has four tabs: General, Style, Leverage Bands and Aggregate.
General
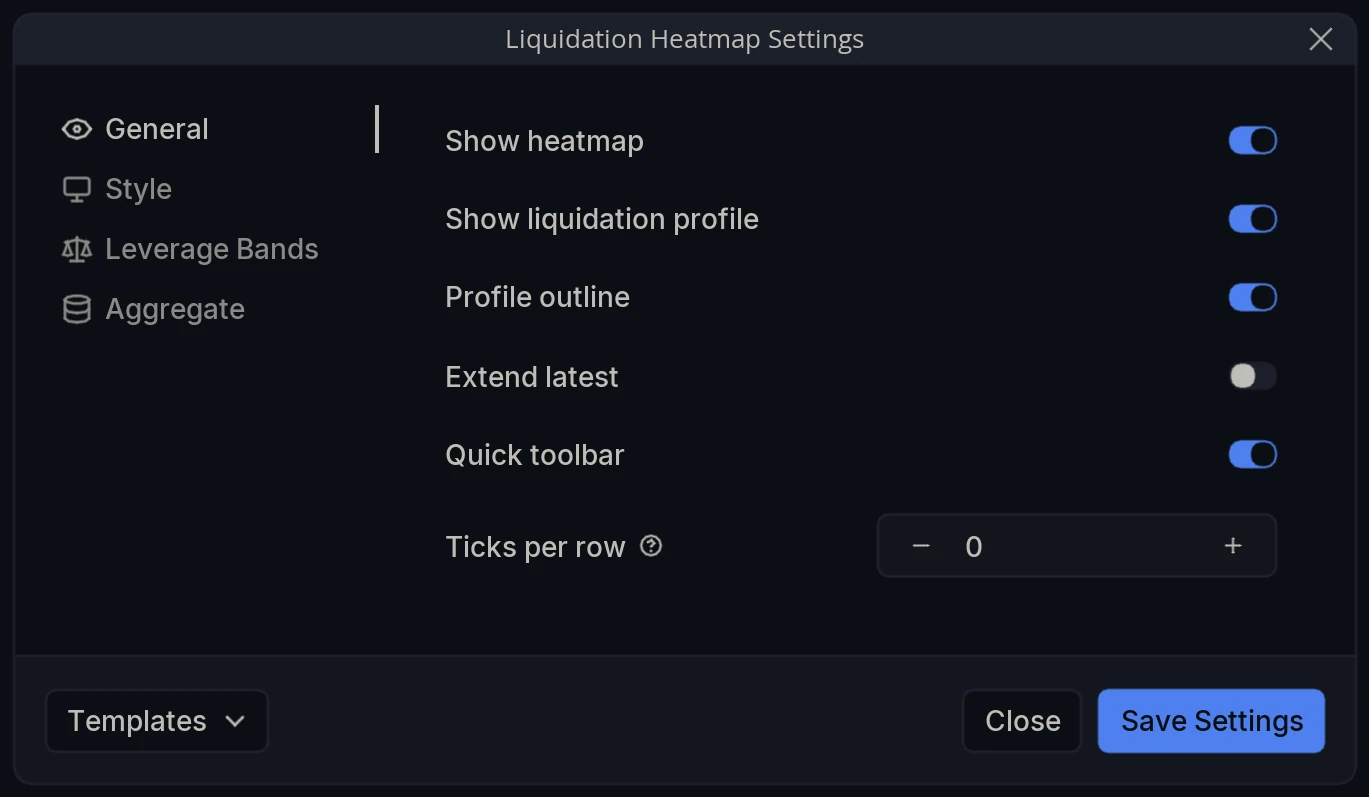
Show heatmap - Draw the heatmap itself.
Show liquidation profile - Draw the horizontal profile totalling estimated liquidations by price level.
Profile outline - Trace the profile’s shape as a line, drawn separately above and below the current price.
Extend latest - Carry the most recent column forward across the empty chart space, so current levels stay visible ahead of price.
Quick toolbar - Show the on-chart toolbar with the leverage band toggles and a settings cog.
Ticks per row - The price height of each row. As the tooltip in the panel puts it, set 0 for automatic sizing, which is the default.
Style
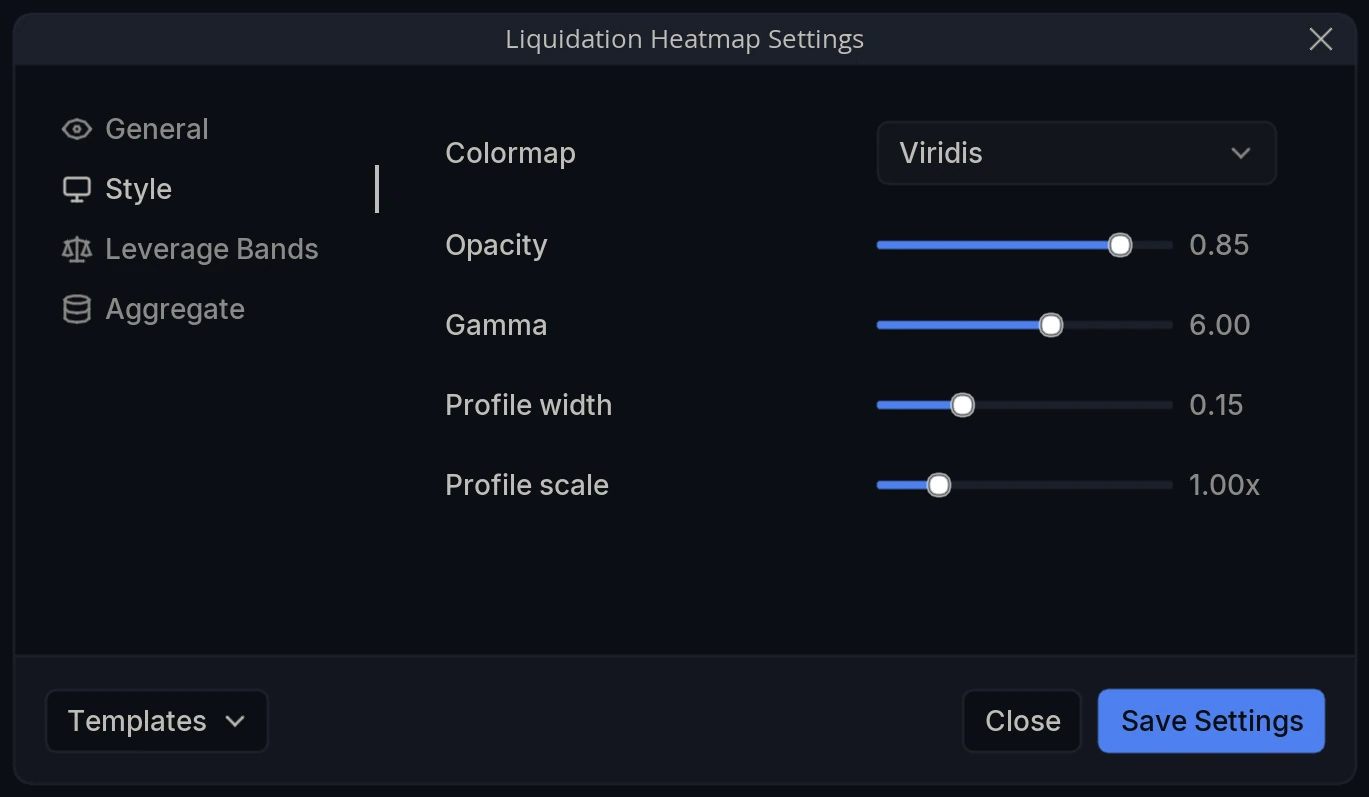
Colormap - The palette used for intensity. Built-in and custom colormaps both apply.
Opacity - How strongly the layer renders against the chart beneath it. 0.85 by default.
Gamma - The contrast curve on the colormap. Higher values suppress weak levels so only real concentrations show. 6.00 by default.
Profile width - How far the profile extends across the chart, as a fraction of the available width. 0.15 by default.
Profile scale - A multiplier on the profile’s row lengths. 1.00x by default.
Leverage Bands
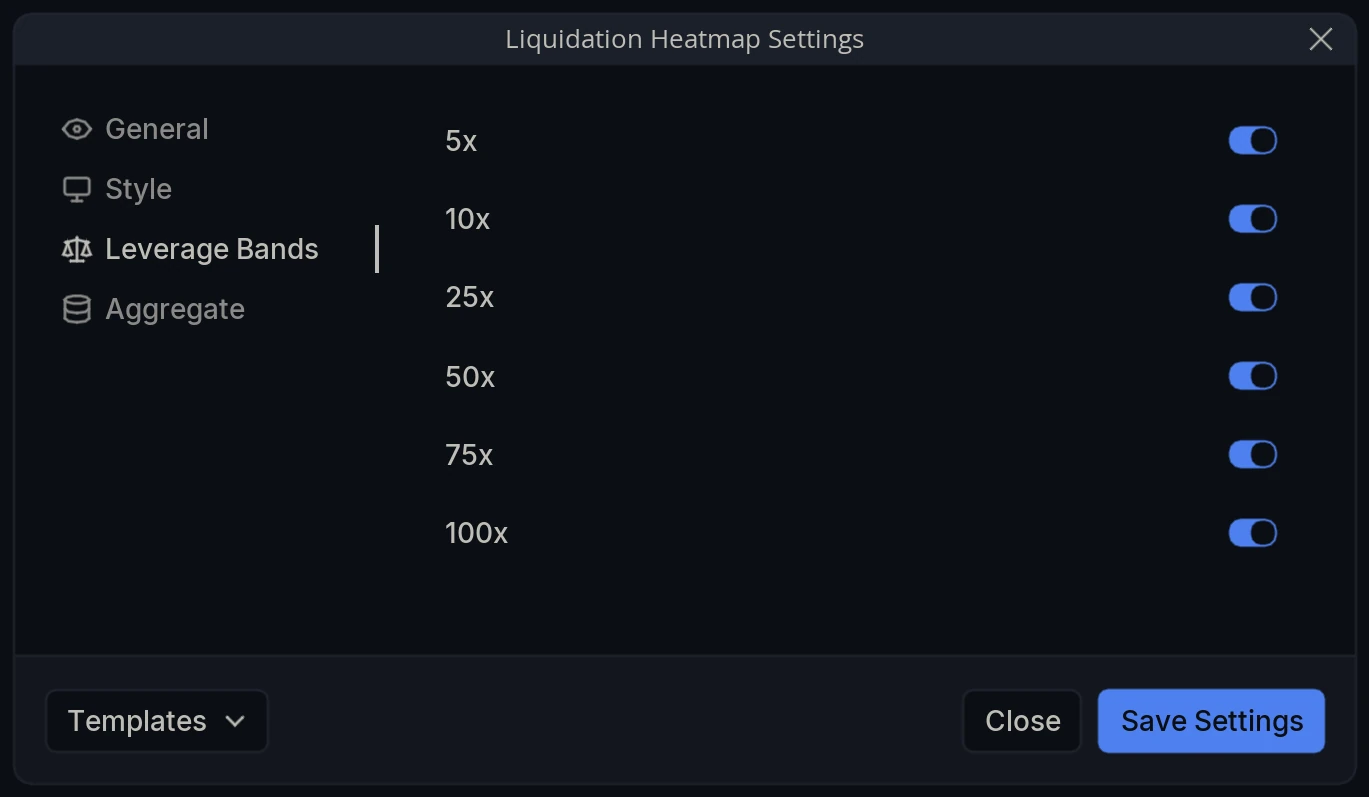
5x / 10x / 25x / 50x / 75x / 100x - Include or exclude each leverage tier. Each is the same set of positions projected at a different leverage assumption, so the higher tiers sit close to price and the lower ones far from it. All six are enabled by default.
Aggregate
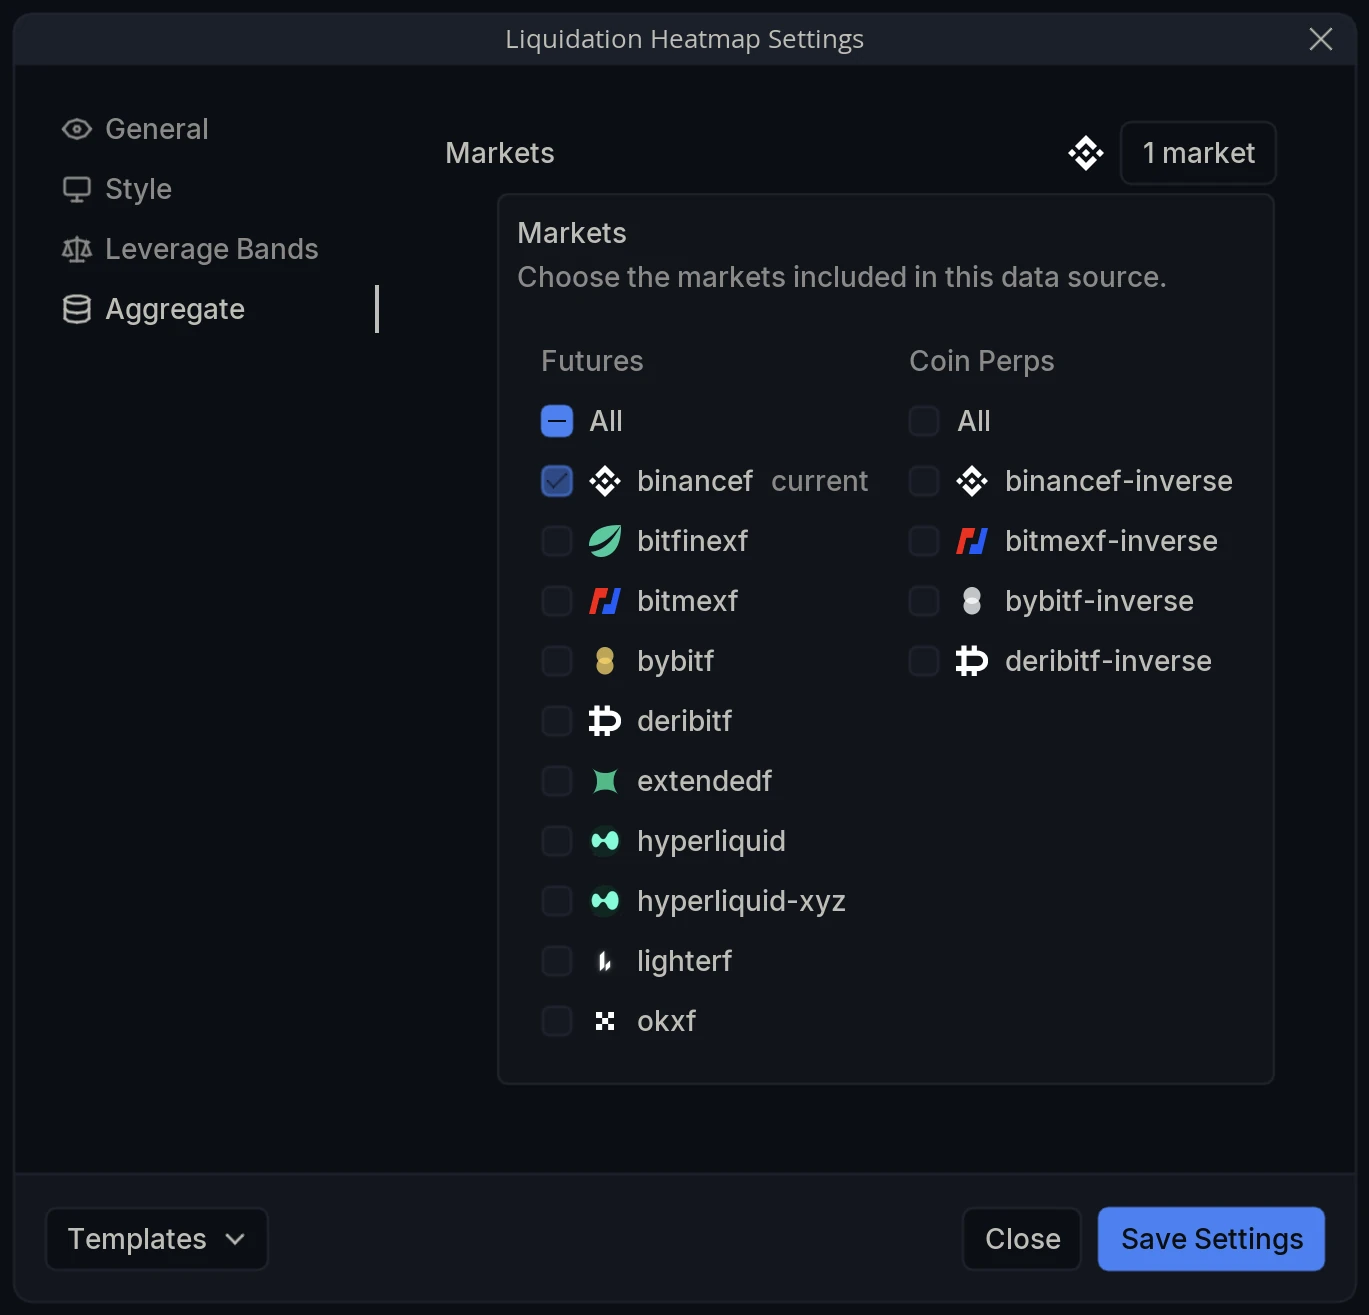
Markets - Choose the markets included in the projection. The selector offers Futures and Coin Perps only, with no Spot column, because spot markets have no leverage and therefore no liquidations to project. Your chart’s own market is tagged current.