What is CVD (Cumulative Volume Delta)?
By MichaelUpdated August 25, 2026
Cumulative Volume Delta (CVD) is a running total of aggressive buying minus aggressive selling. Each candle's delta, the difference between market buy volume and market sell volume, is added to the previous total, producing a line that rises while buyers are more aggressive and falls while sellers are.
How does CVD work?
Every trade is aggressive on one side. A buyer who crosses the spread to hit the offer is a market buy; a seller who crosses it to hit the bid is a market sell. Delta is the difference between the two over a period: positive when aggressive buying dominated, negative when aggressive selling did.
CVD accumulates those deltas rather than showing each one separately. Candle by candle, the delta is added to a running total, so the line traces the balance of aggression over time rather than in a single bar. A rising CVD means aggressive buyers have been in control across the whole period; a falling CVD means aggressive sellers have.
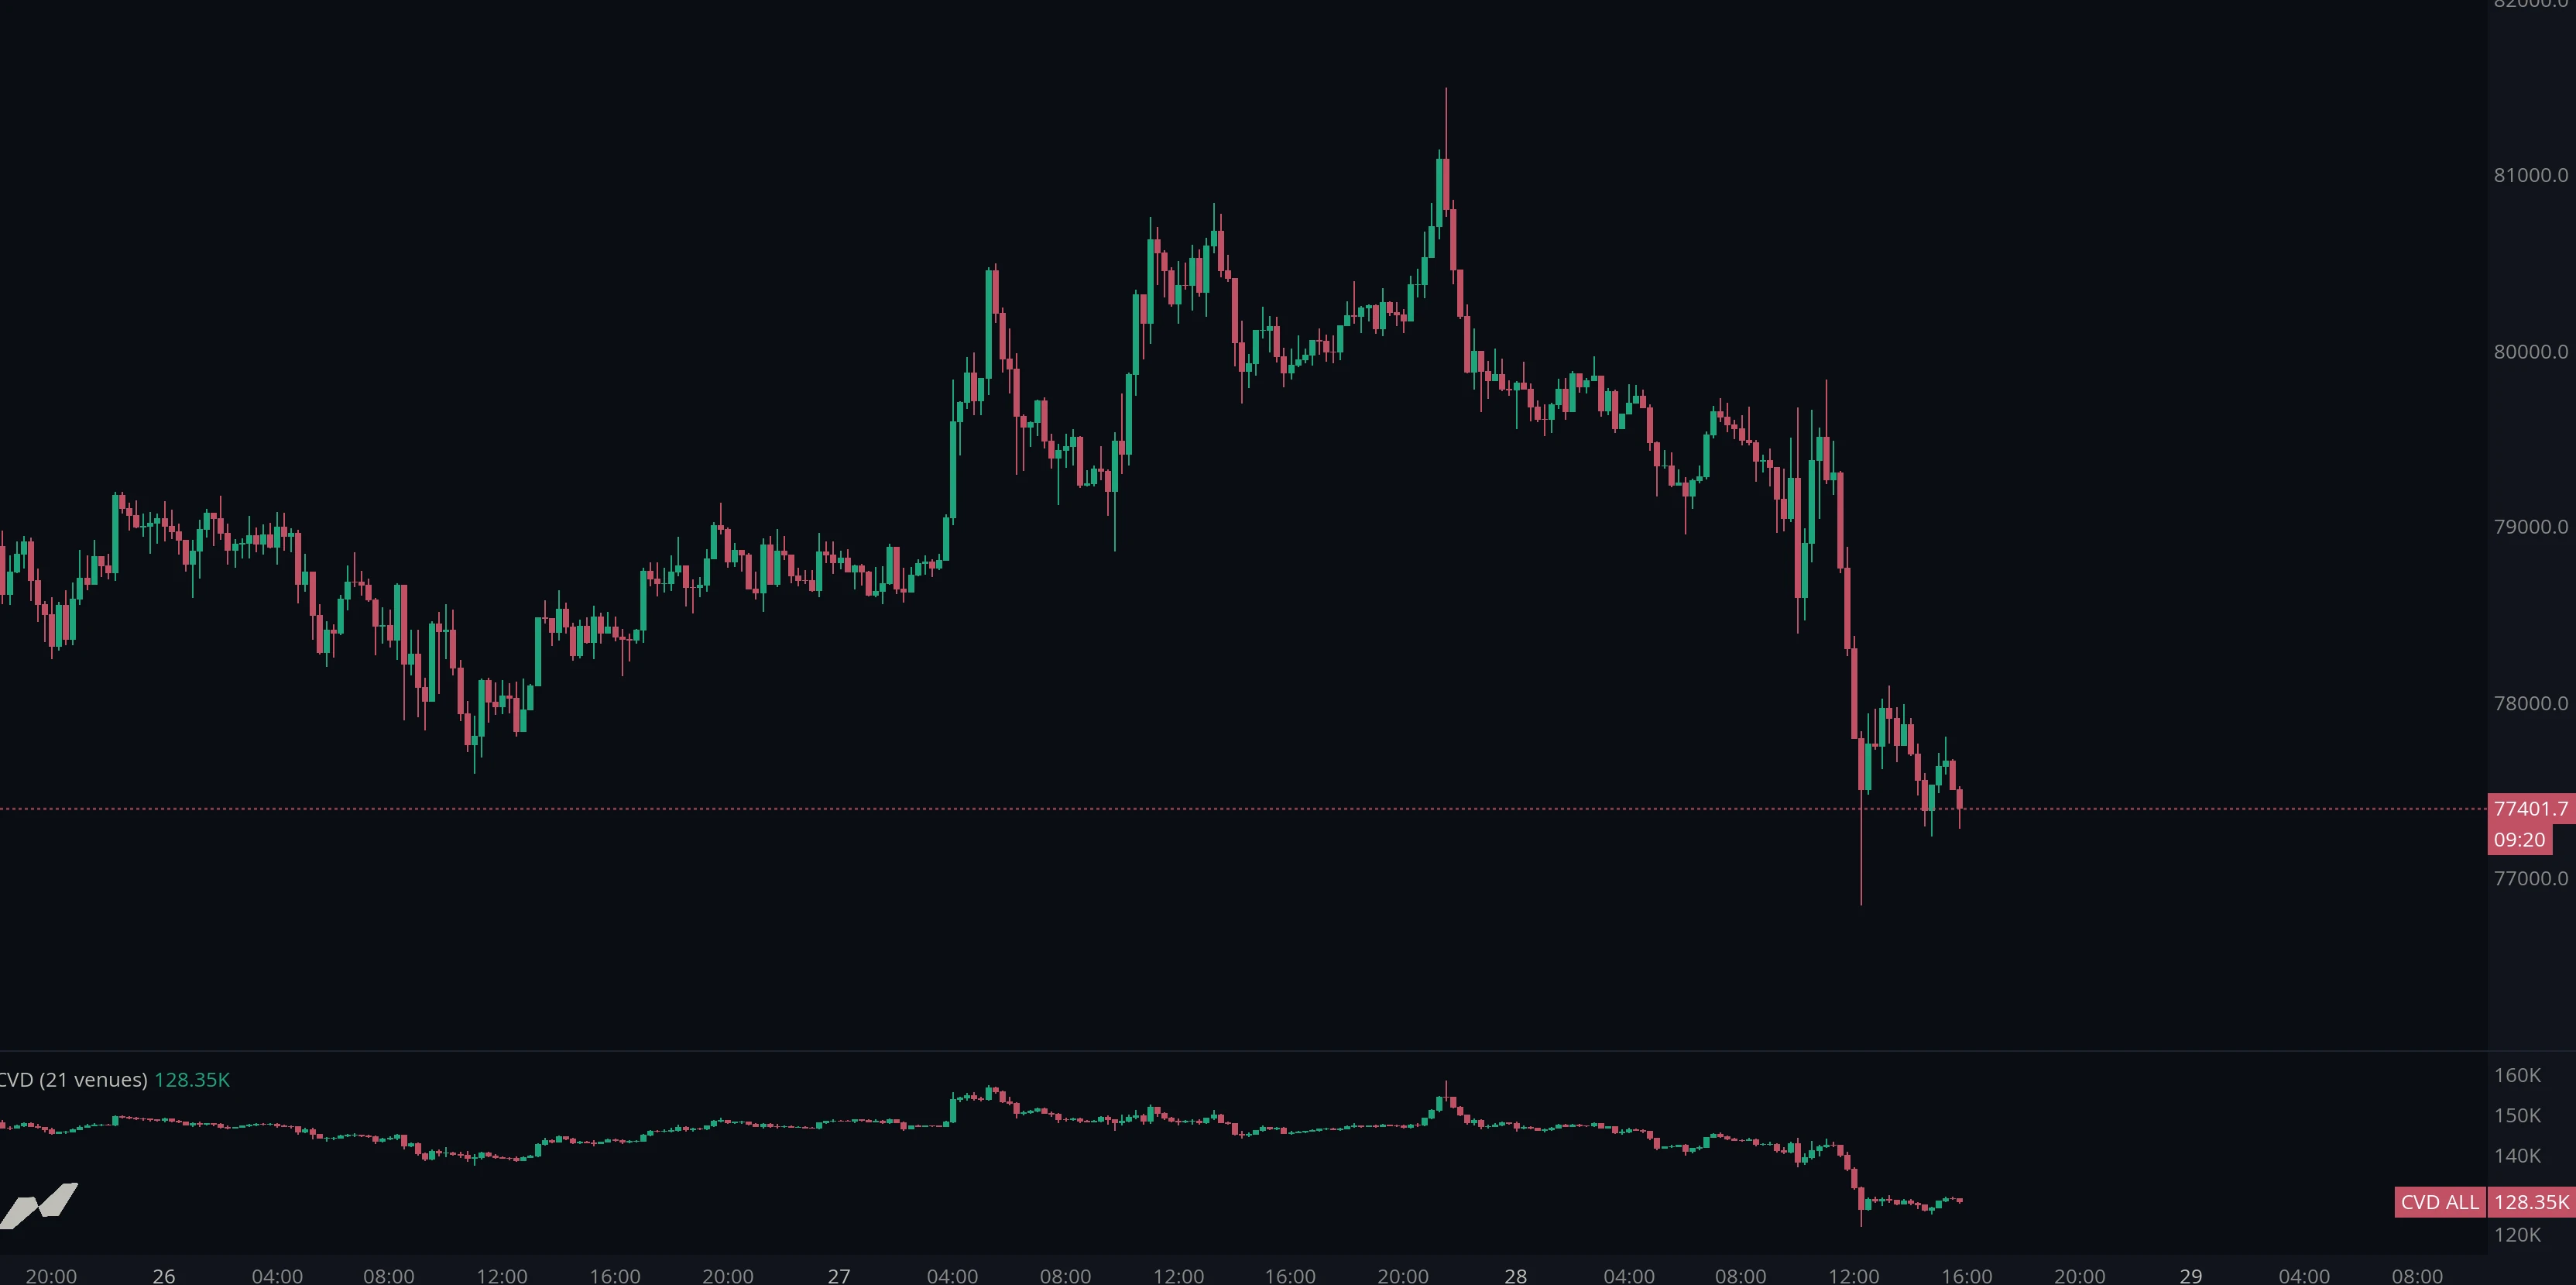
Accumulating matters because a single candle’s delta is noisy. One large order can dominate it, and a strong reading in isolation rarely means much. The cumulative view smooths that out and lets you compare the aggression behind a move with the move itself, which is where CVD earns its place: not in agreeing with price, but in disagreeing with it.
How do you read CVD?
On its own, CVD rising with price and falling with price is unremarkable: aggression and price agree, which is what normally happens.
The information is in divergence, when the two disagree. A market making new highs while CVD fails to is being lifted by less aggression than the previous move required. A market holding a level while CVD collapses is absorbing a great deal of selling without giving ground. Both situations say something the price chart alone does not.
Two named patterns cover most of what traders look for.
What is exhaustion in CVD?
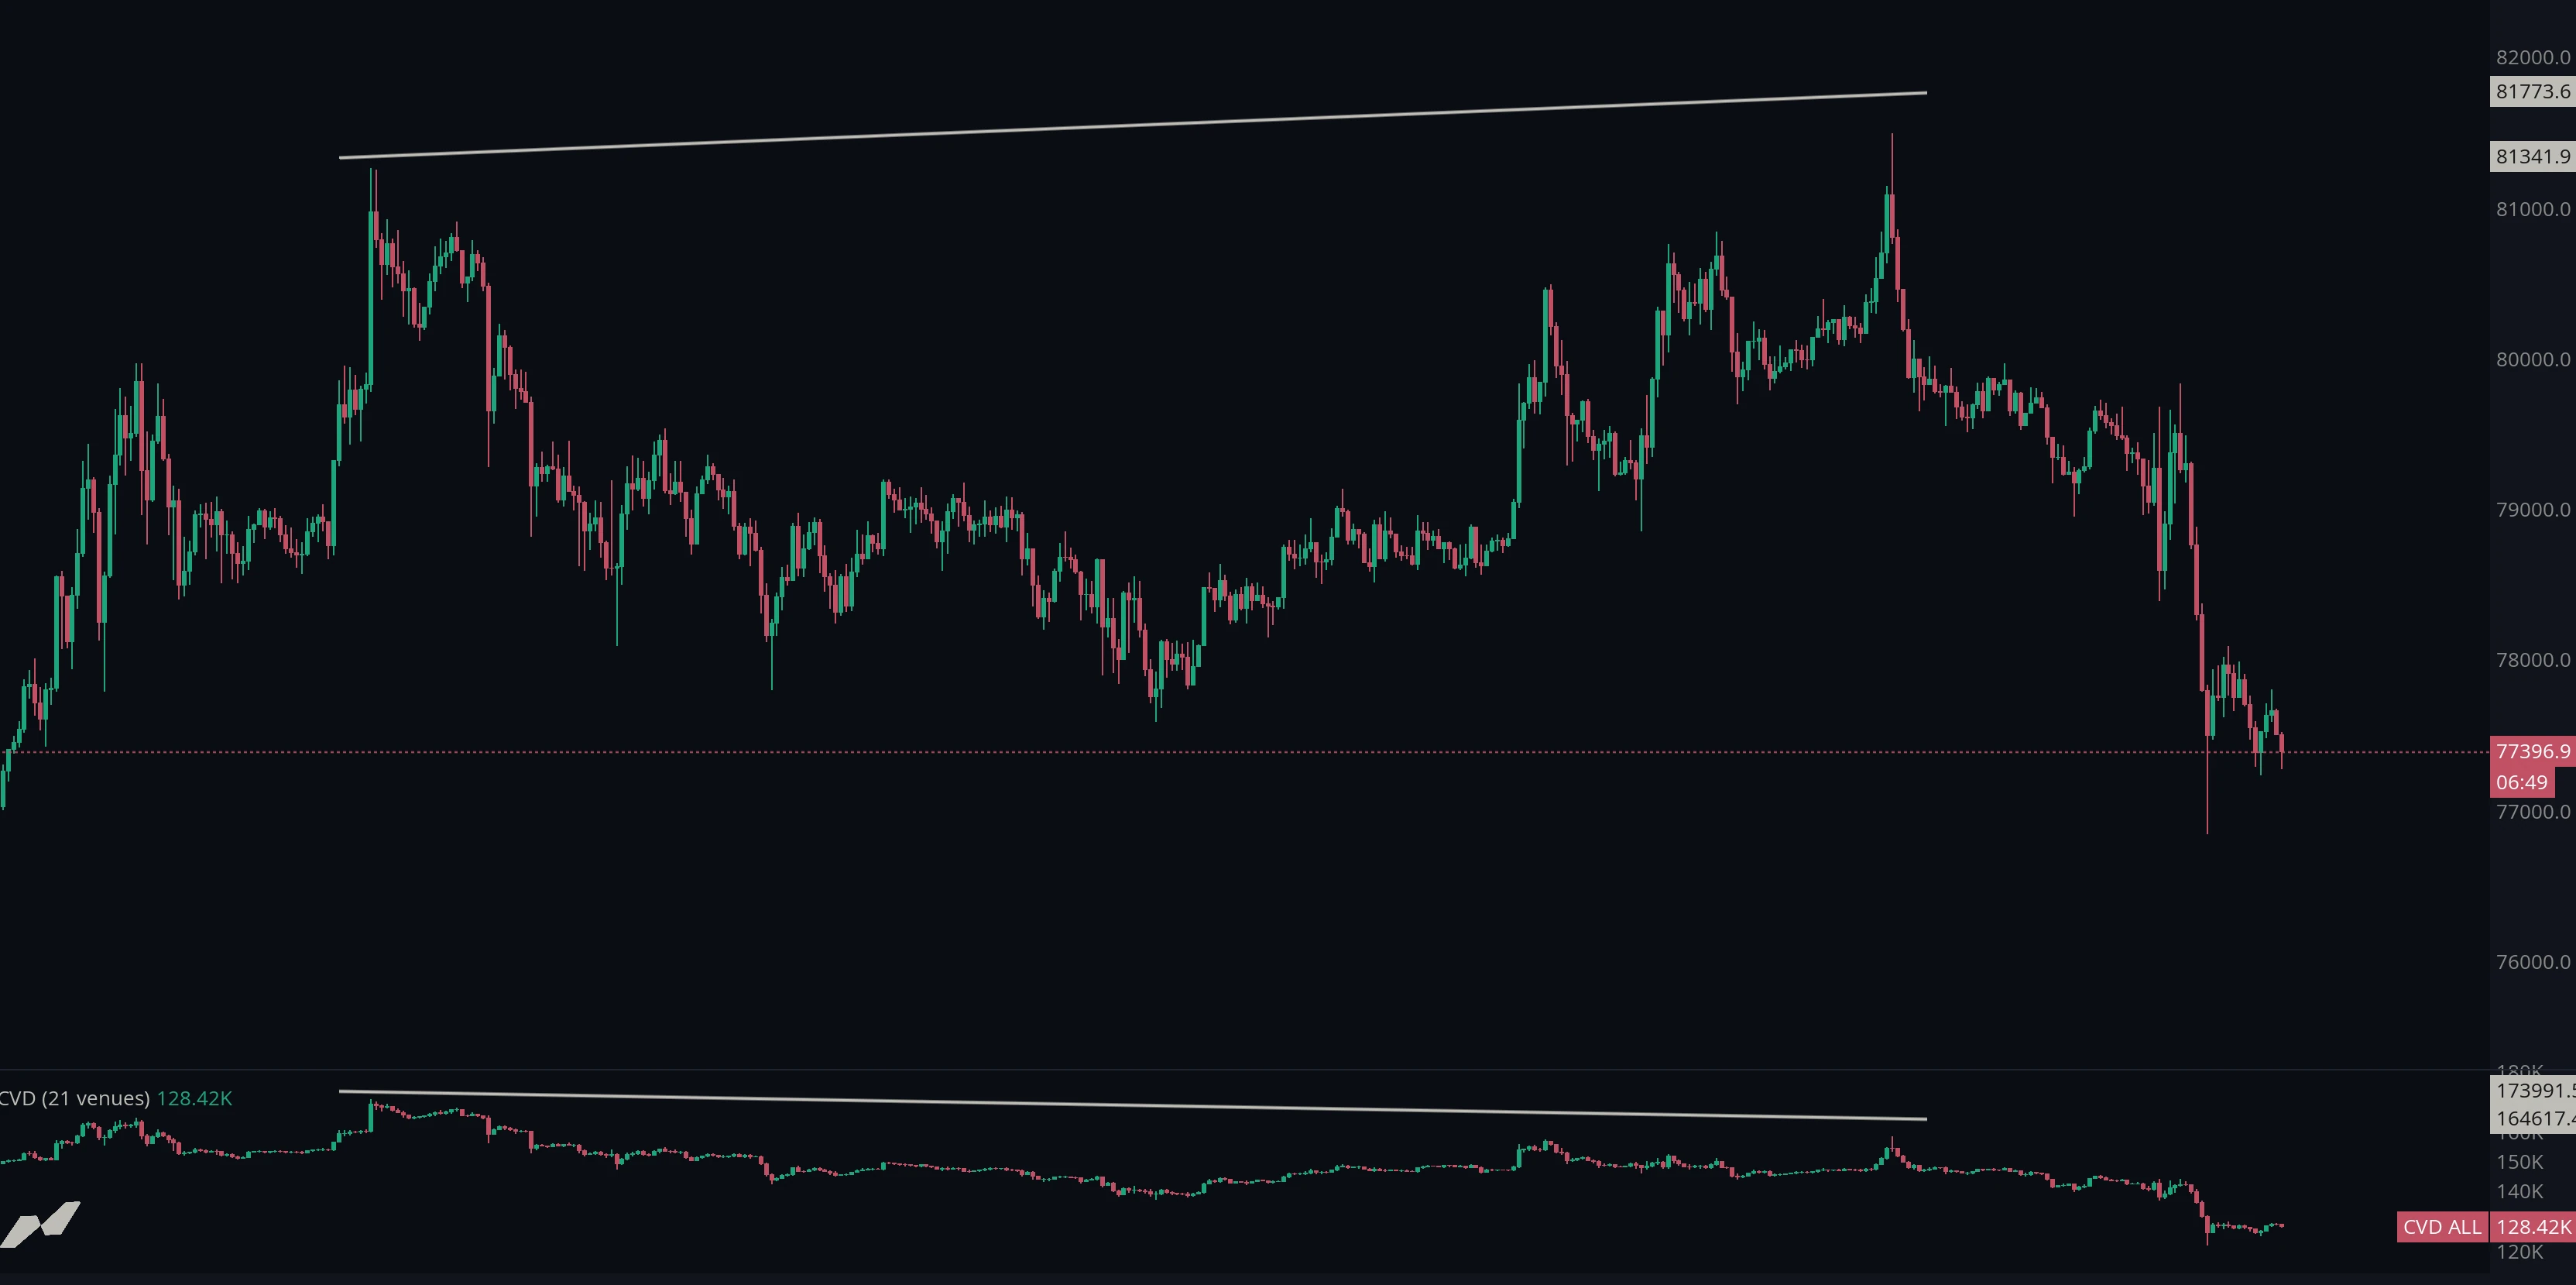
Exhaustion is when price makes a higher high or lower low, but CVD does not follow.
Price reaches a new extreme while the aggression behind it shrinks. Fewer aggressive participants are pushing in the same direction than on the previous leg, so the move is running out of the fuel that drove it. Exhaustion often precedes a reversal, because the trend is being sustained by momentum rather than by fresh commitment.
What is absorption in CVD?
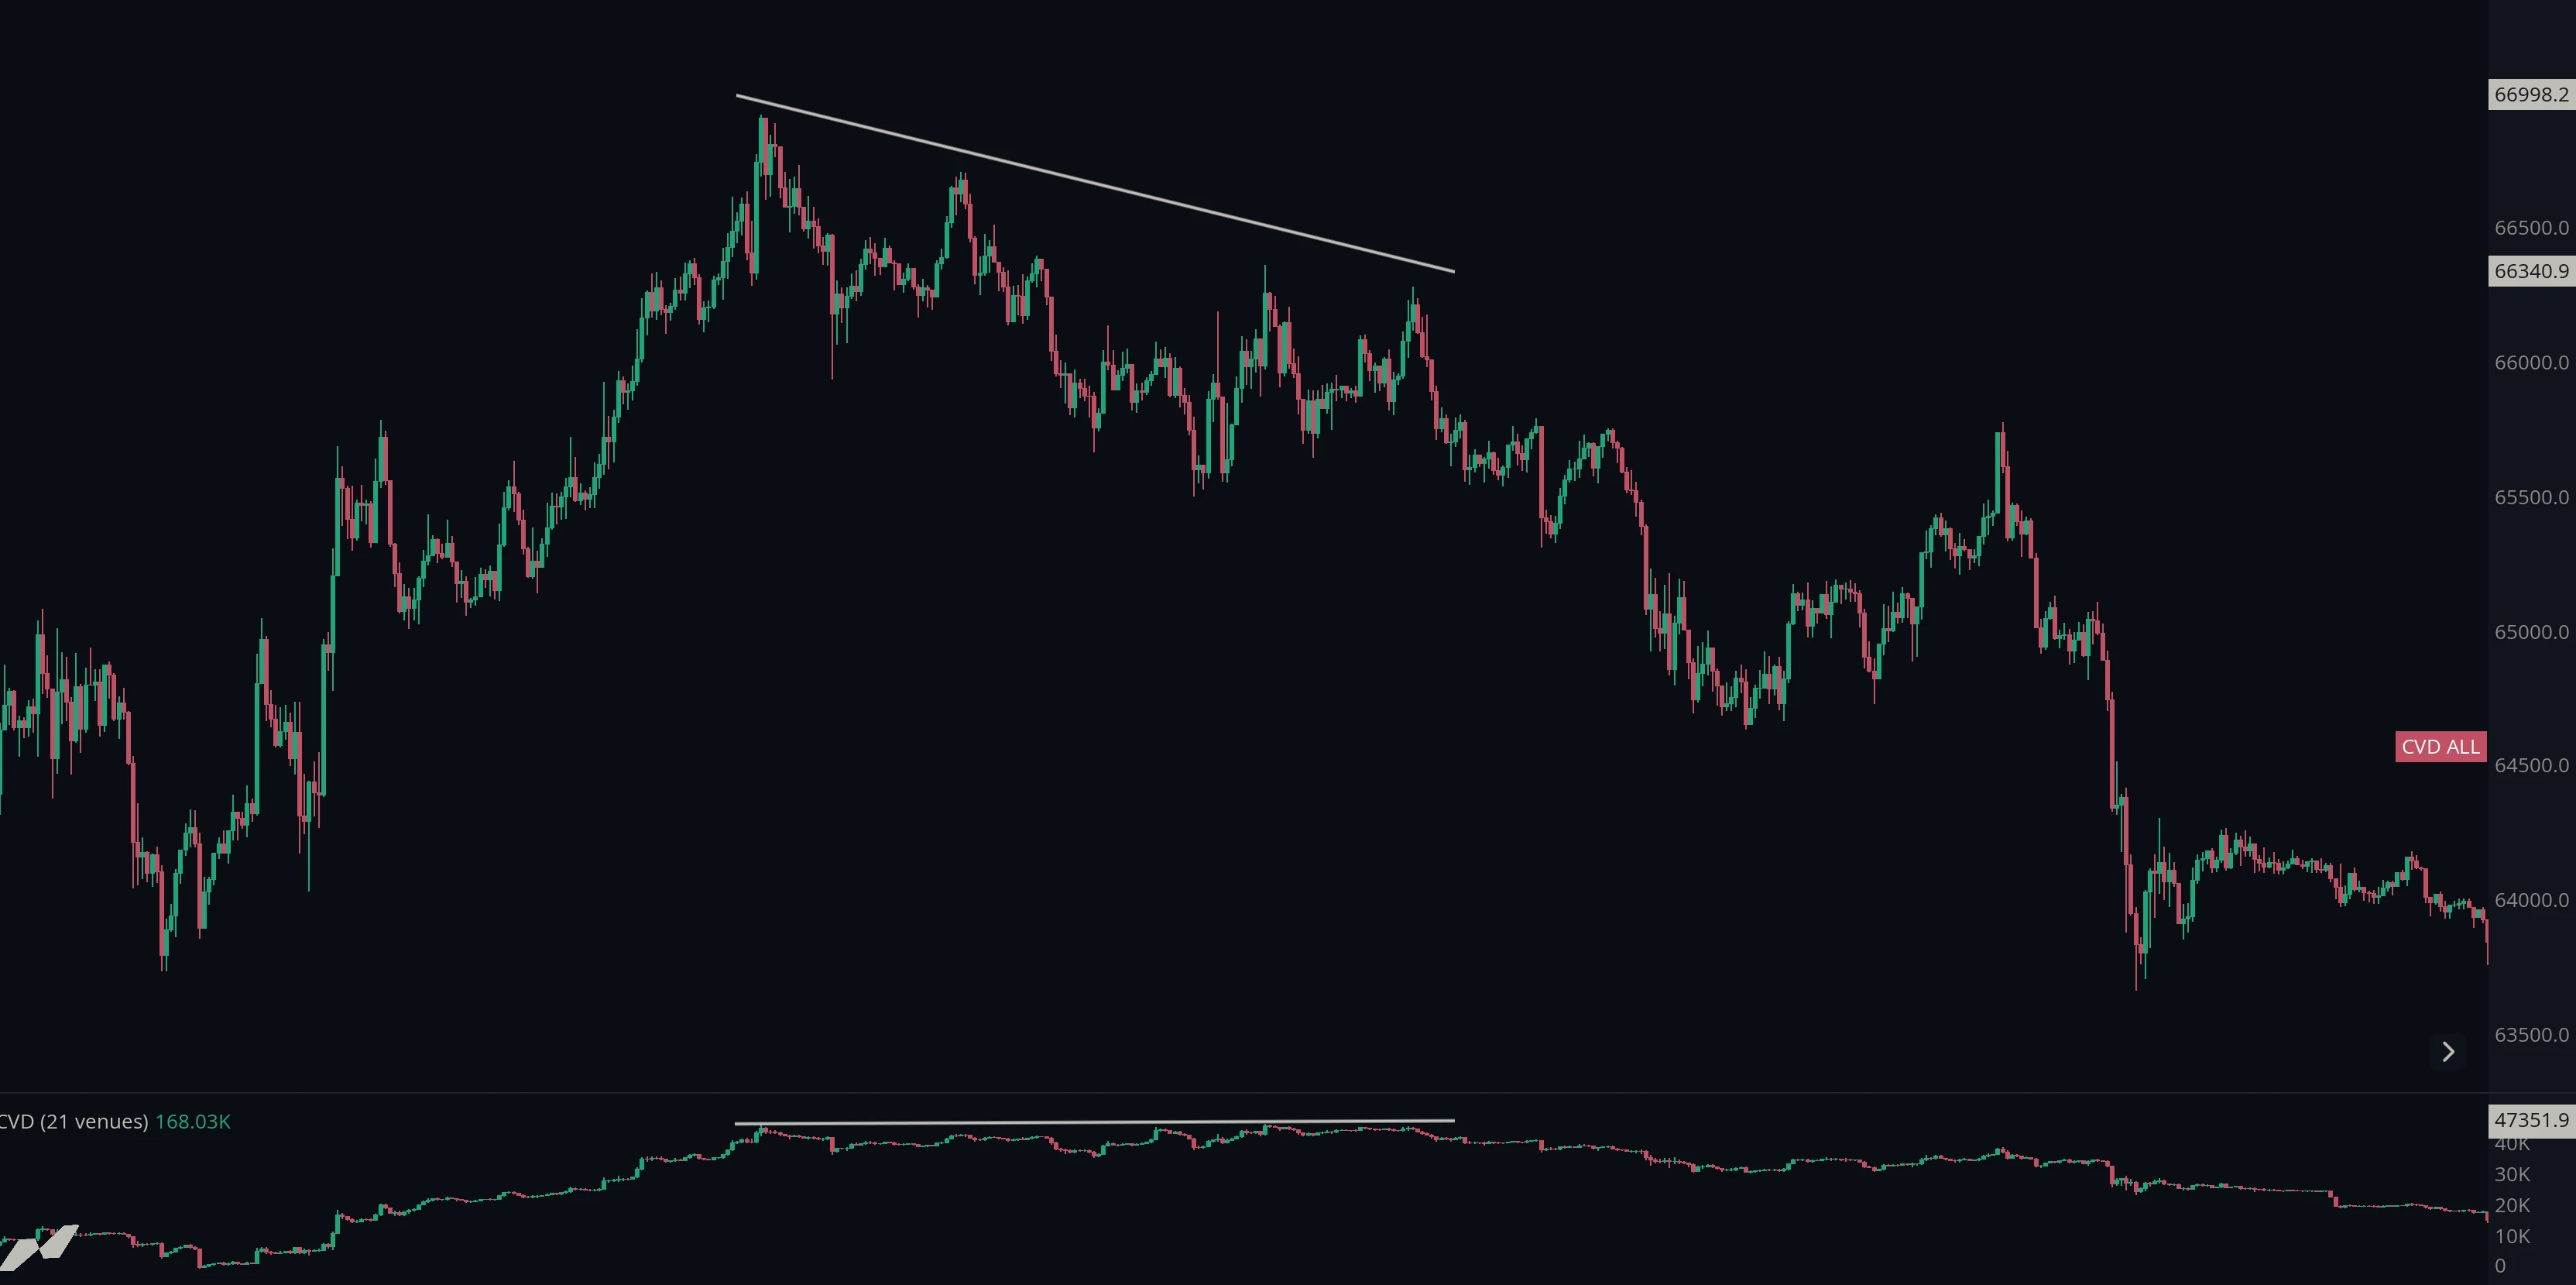
Absorption is the reverse: CVD makes a higher high or lower low, but price does not.
Aggressive participants are hitting the market hard and price is not moving. That means someone is meeting all of that aggression with resting limit orders, absorbing it without letting price travel. Heavy selling that fails to push price down is being bought by a passive participant, and when the aggressive sellers are finished the market frequently turns.
Why filter CVD by trade size?
A single CVD line treats a $500 trade and a $5 million trade as contributions to the same total, differing only in magnitude. Filtering by trade size separates them, and the separation is often where the useful information sits.
Restricting CVD to large trades shows what size participants are doing. Restricting it to small trades shows what everyone else is doing. When those two disagree - small trades buying aggressively while large trades sell into them - the disagreement is far more informative than the blended total, which averages them into something that looks like neither.
What are the limits of CVD?
It measures aggression, not intent. CVD counts which side crossed the spread. It cannot tell you whether that was an entry, an exit, a hedge or a liquidation, and a forced sale looks identical to a considered one.
It is venue-specific. Each exchange reports only its own trades. A CVD built from one venue can diverge from price simply because the flow happened elsewhere, which is why aggregating across exchanges gives a more reliable reading.
Divergences take time to resolve. A divergence can persist far longer than it seems it should. It describes a condition, not a trigger.
Related: Volume · Delta volume · Order book heatmap
Using CVD in MMT
MMT’s CVD is added as an indicator in its own panel below the price chart. It can be drawn as candlesticks or as a line, filtered by trade size, and aggregated across exchanges.
How do you add CVD to a chart?
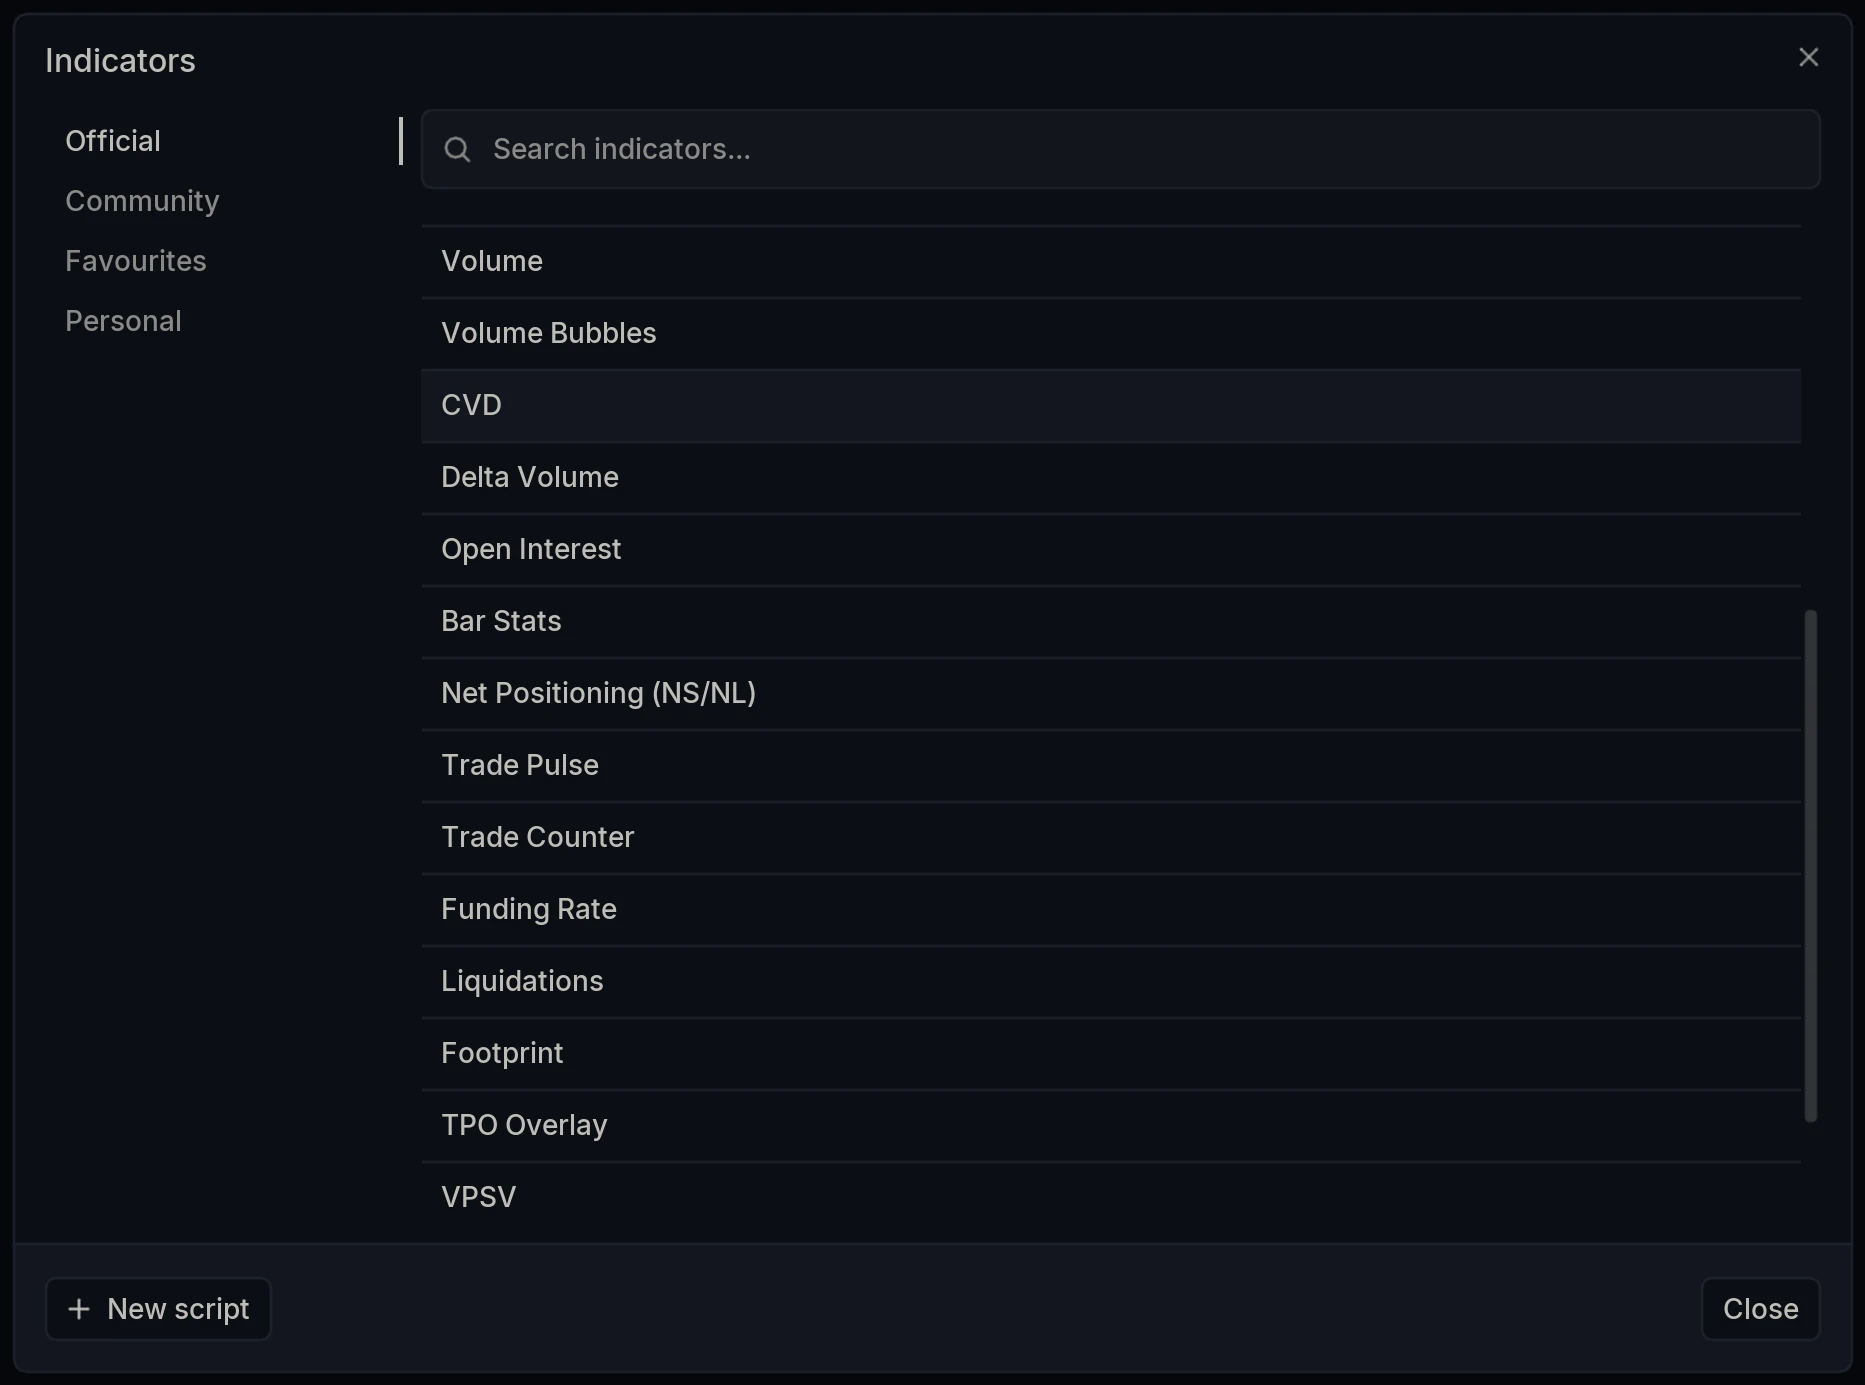
Open the Indicators dialog and select CVD under Official.
Should you use candlestick or line CVD?
Candlestick gives each period an open, high, low and close for the cumulative delta, so you can see the full rotation within a candle rather than just where it finished. Useful when the path matters: a period that ran far positive before closing flat tells you more than the close alone.
Line plots the running total as a single continuous path. It is the cleaner view for spotting divergence against price, because the shape of the line is easier to compare with the shape of the price chart.
Layer Settings
Open CVD Settings via the cog wheel on the layer name. The panel has three tabs: Display, Price Marker and Aggregate.
Display
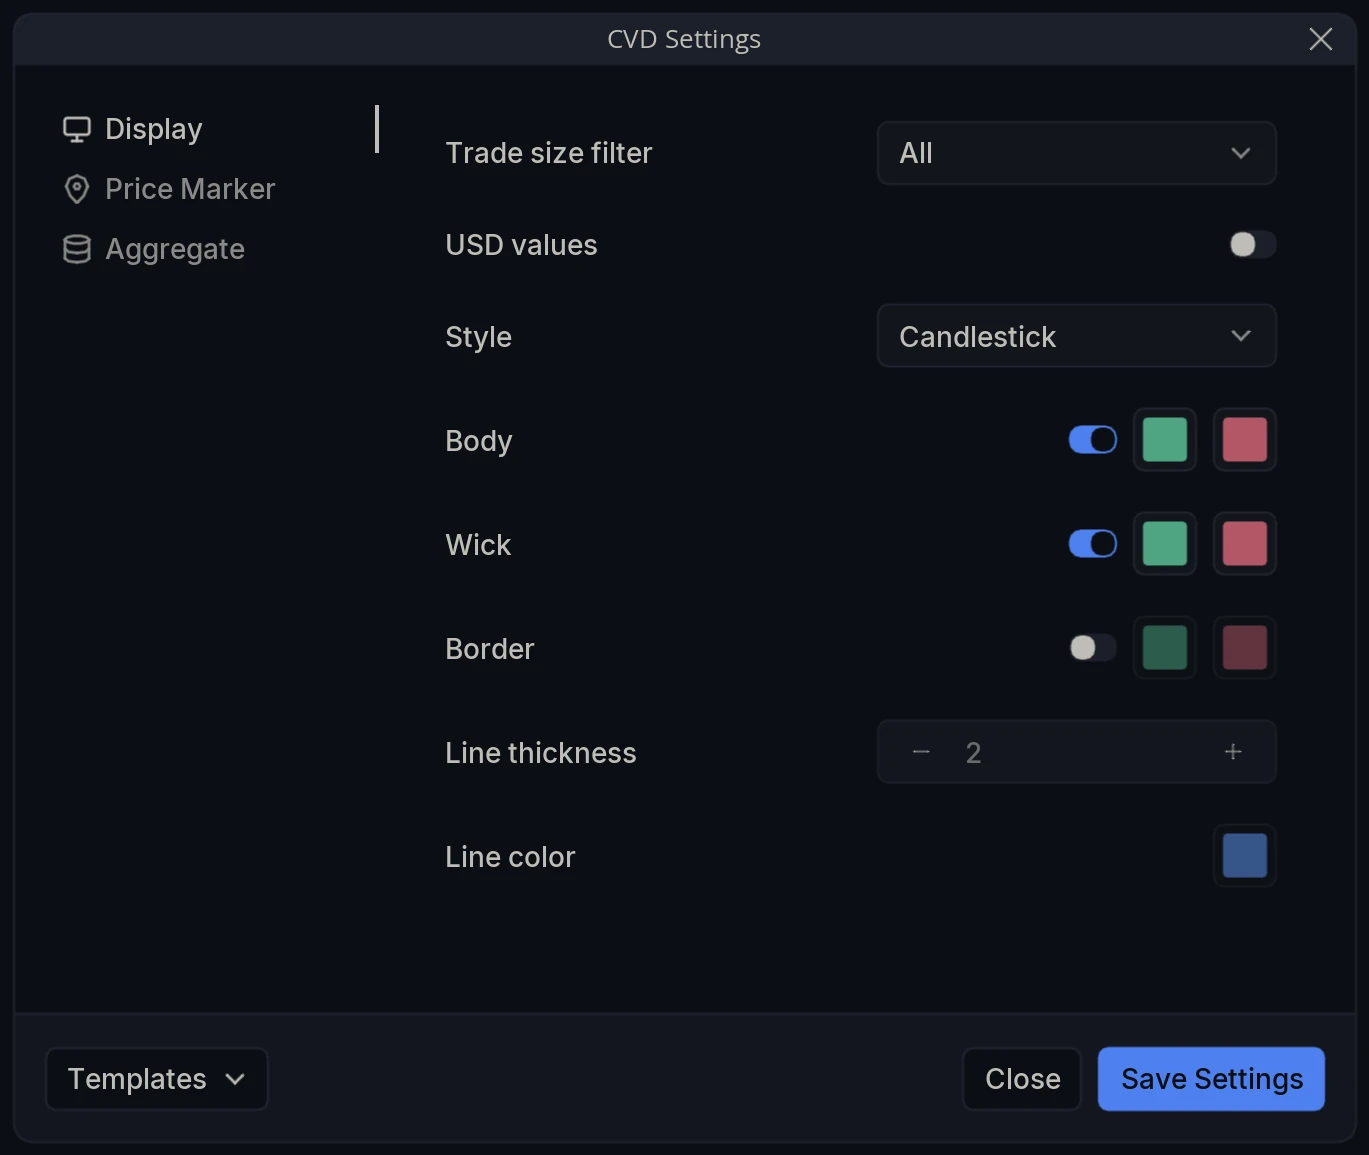
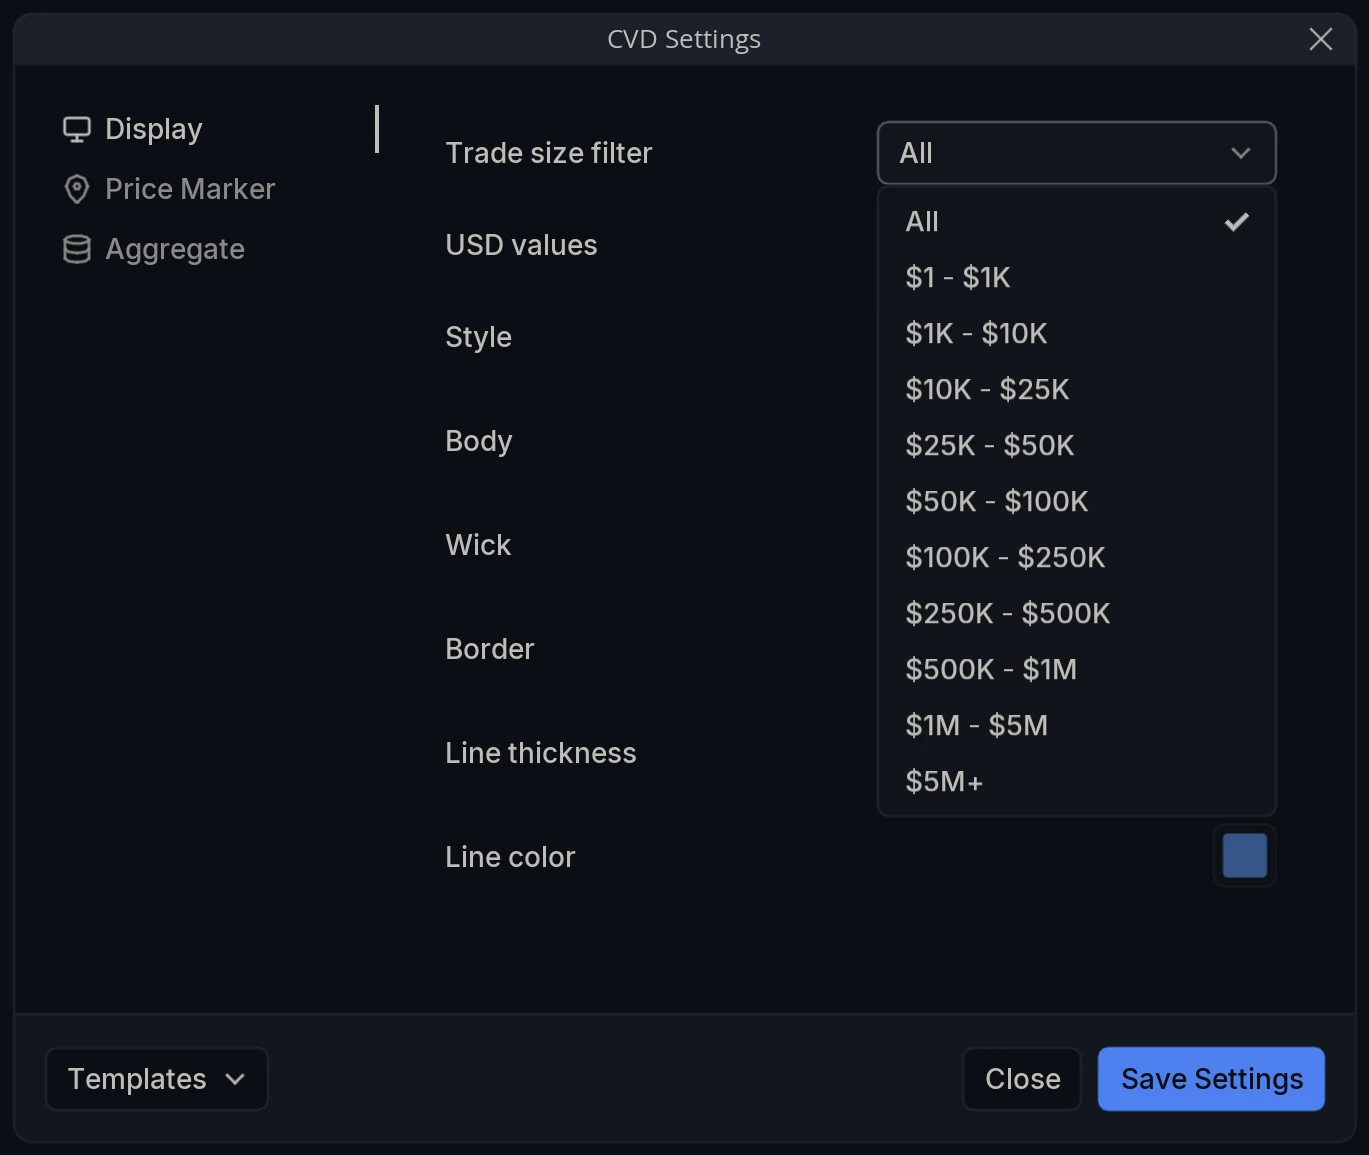
Trade size filter - Restrict CVD to trades within a size bucket: All, or one of the ranges from $1 - $1K up to $5M+. Setting this to a large bucket isolates the flow of size participants; setting it to a small one isolates everyone else.
USD values - Report values in USD rather than in units of the base asset.
Style - How the plot is drawn: Candlestick or Line.
Body - Toggle the candle body and set its up and down colors. Candlestick only.
Wick - Toggle the wicks and set their up and down colors independently of the body. Candlestick only.
Border - Toggle an outline around the body, with its own up and down colors. Candlestick only.
Line thickness - Thickness of the plot in Line style.
Line color - Color of that plot.
Price Marker
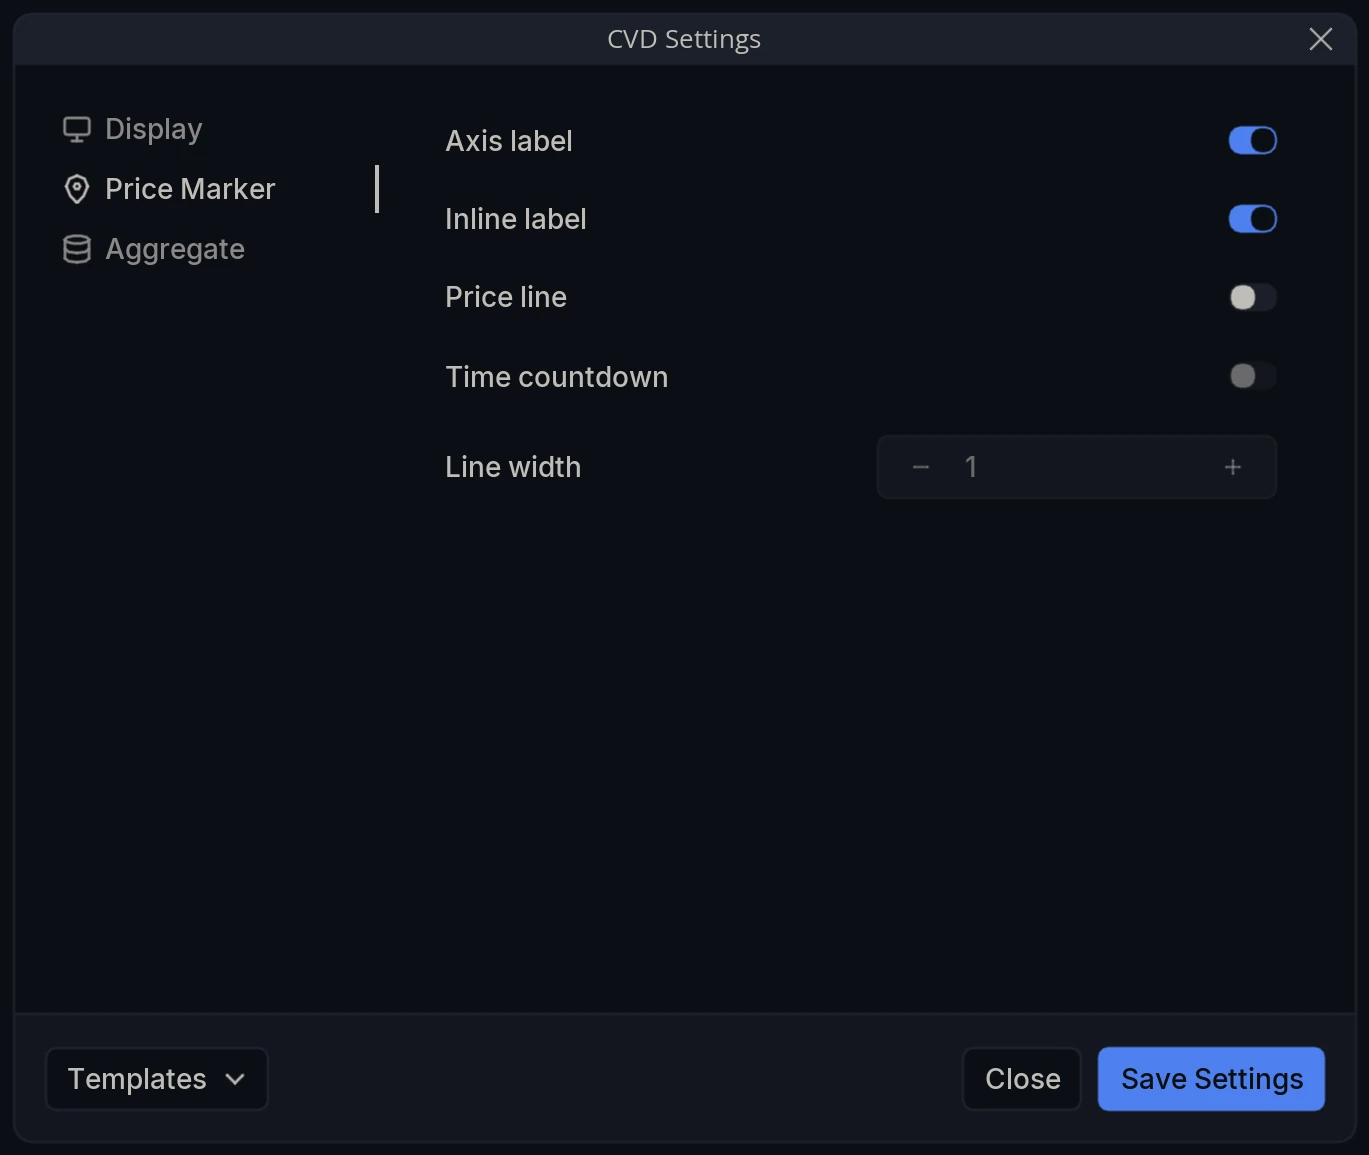
Axis label - Show the current value as a label on the panel’s axis.
Inline label - Show that value on the panel itself rather than on the axis.
Price line - Draw a horizontal line across the panel at the current value.
Time countdown - Show the time remaining until the current candle closes.
Line width - Thickness of that line.
Aggregate
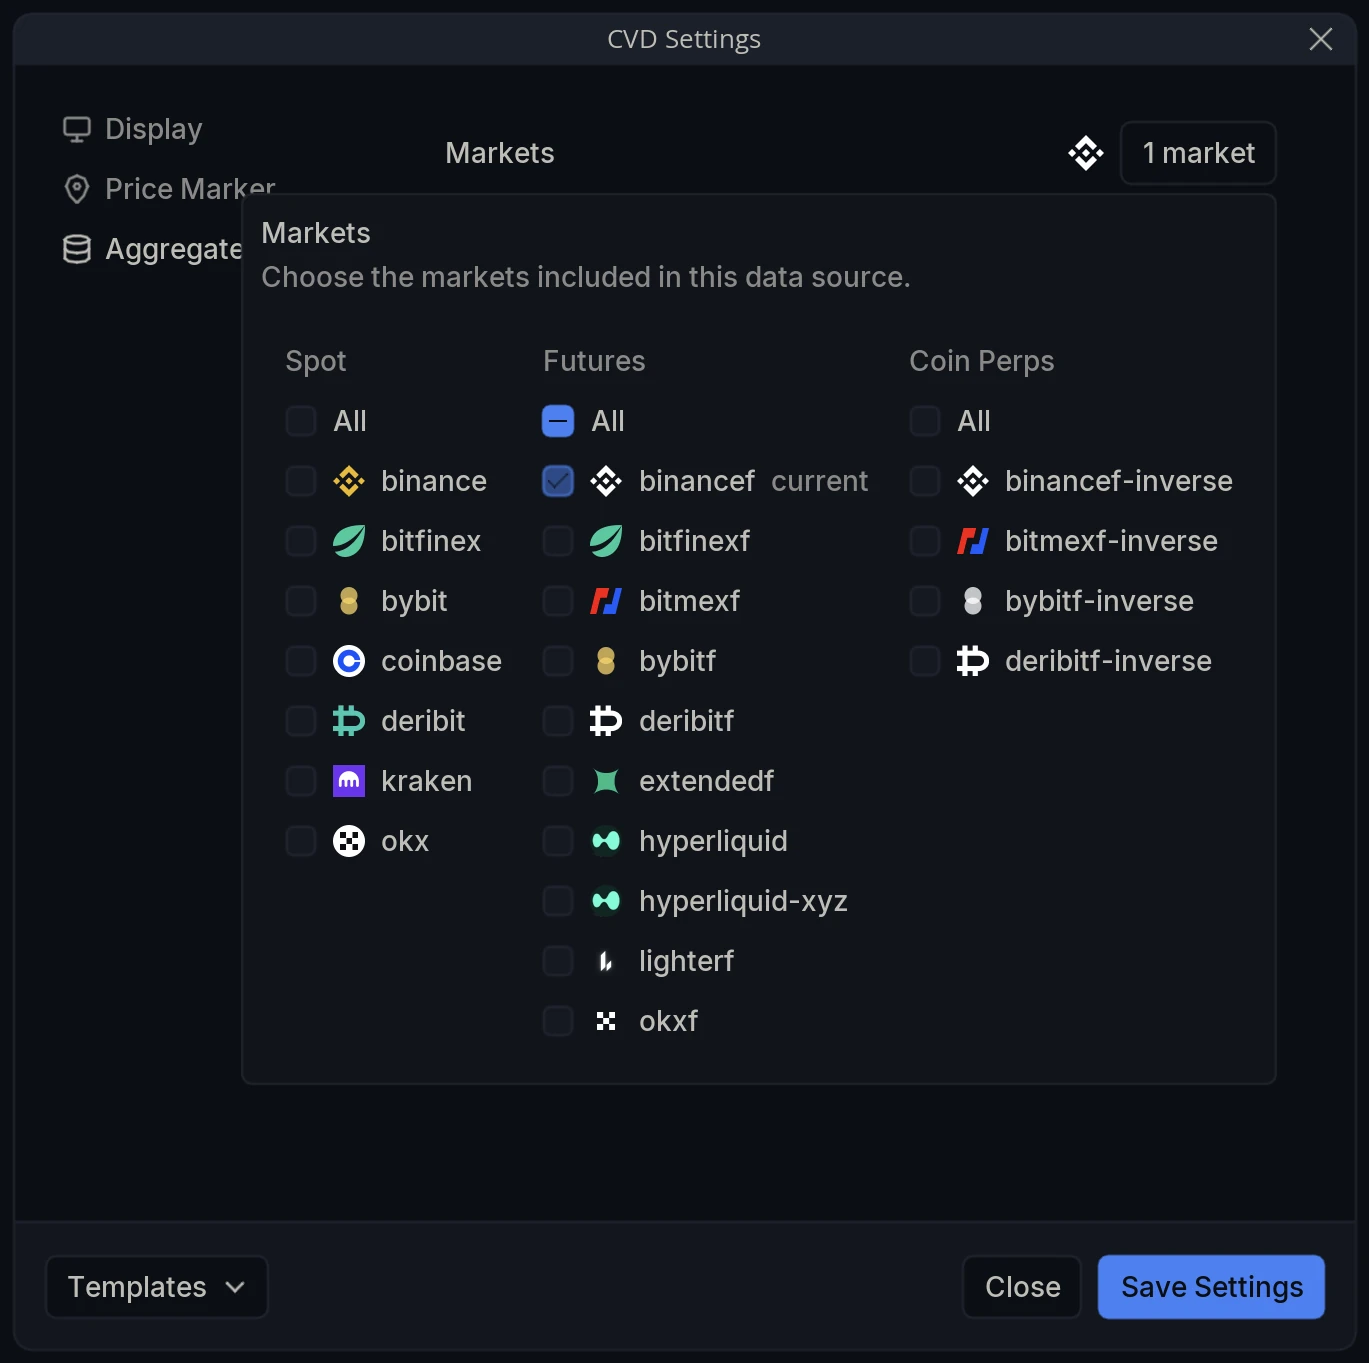
Markets - Choose the markets included in the calculation. The selector is grouped into Spot, Futures and Coin Perps, with an All toggle per group; your chart’s own market is tagged current.
Aggregating matters more for CVD than for most layers. A divergence on a single venue can simply mean the aggression happened on another exchange, so pooling venues gives a far more reliable read on whether buyers or sellers are genuinely in control.