What is VPVR (Volume Profile Visible Range)?
By MichaelUpdated August 24, 2026
VPVR (Volume Profile Visible Range) is a chart tool that shows how much volume traded at each price level across whatever part of the chart is currently on screen. It draws a horizontal histogram beside price, where the longest rows mark the prices that saw the most trading activity.
How does a volume profile work?
A standard volume histogram sits under the chart and tells you how much traded during each candle. What it cannot tell you is where inside that candle the trading happened. A candle that ranges a thousand points might have done almost all its business at the low, or spread it evenly, and the volume bar looks identical either way.
A volume profile answers that question by measuring volume against price instead of against time. The price range is divided into rows, every trade is assigned to the row containing its price, and the totals are drawn as a horizontal histogram. Long rows are prices where a lot of business was done; short rows are prices the market passed through without transacting much.
What makes VPVR distinct is its range. Rather than measuring a fixed session, it profiles exactly what is visible on screen, and recalculates whenever you scroll or zoom. That makes it a tool for asking “where did the volume trade over this stretch of market”, where the stretch is whatever you choose to look at.
How is a volume profile built?
The visible price range is divided into rows of equal height. Every trade that occurs is allocated to the row containing its price, and the row grows in proportion to the volume it accumulates.
Row height matters more than it first appears. Tall rows group many prices together and produce a smooth, readable shape with little detail. Short rows resolve individual price levels but can look noisy on a long range. The right setting depends on how much of the market you are looking at.
Because buys and sells can be counted separately, most volume profiles can split each row into the volume that traded into the offer and the volume that traded into the bid, which is what makes the buy/sell composition of a level visible rather than just its total.
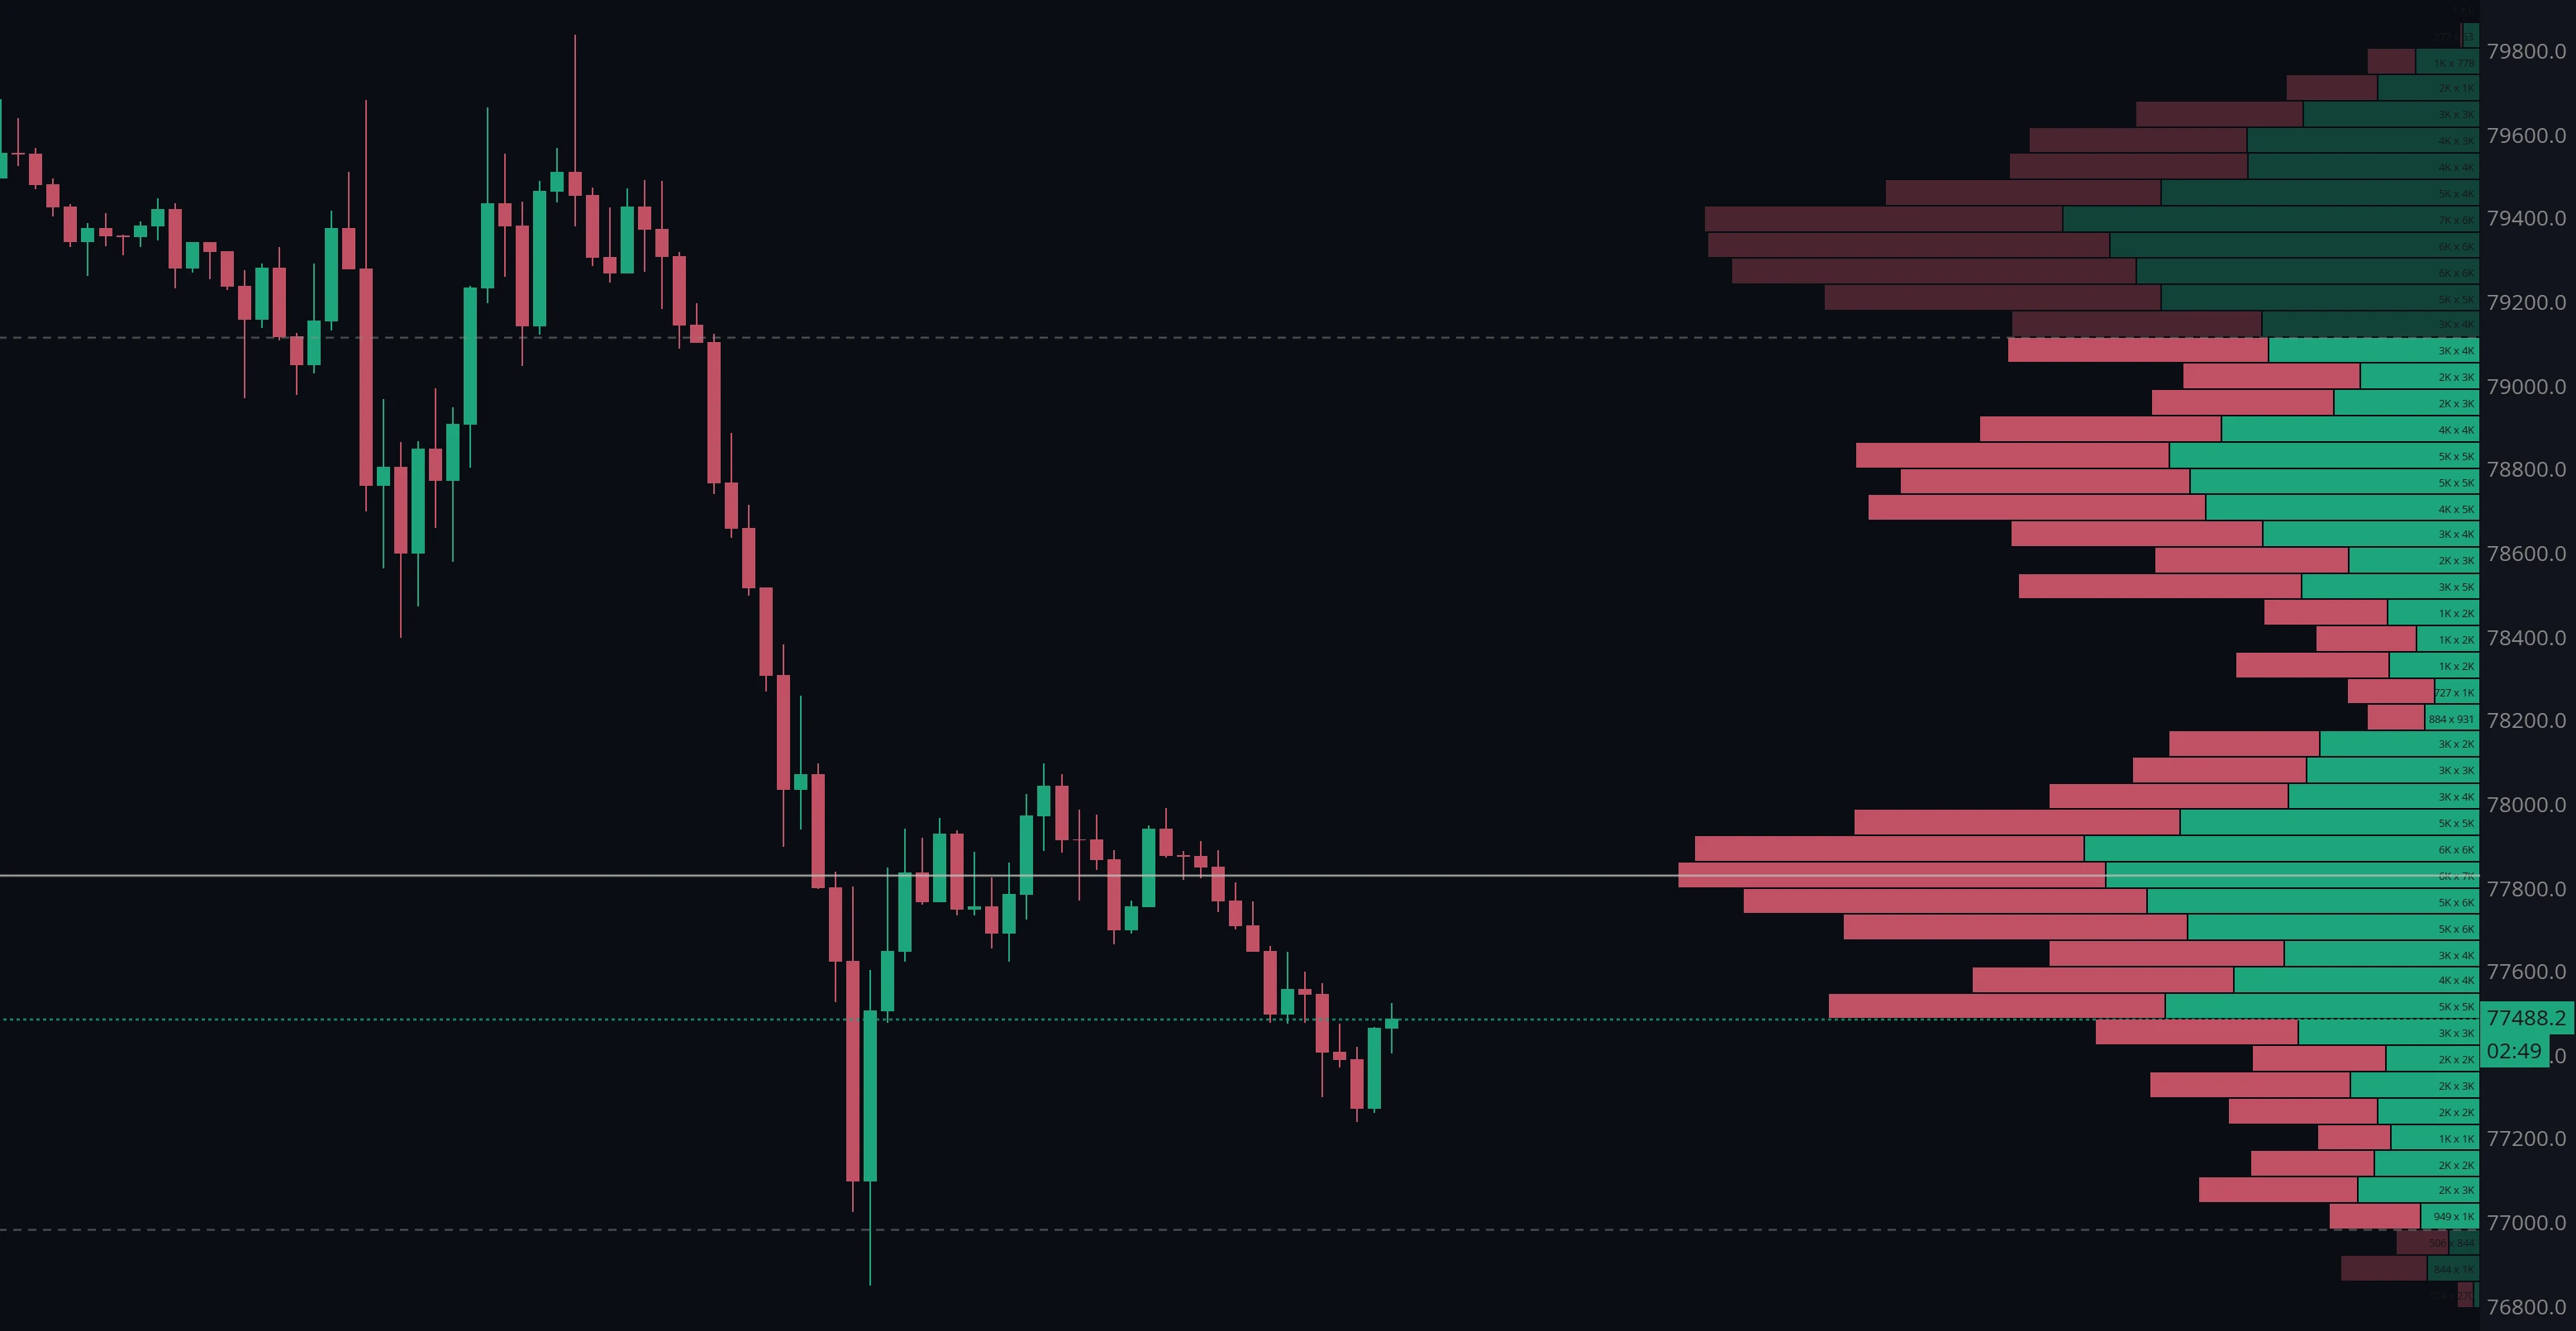
What is the point of control (POC)?
The point of control is the price with the most traded volume: the longest row in the profile.
It is generally read as the fair price for the period being measured, because it is where buyers and sellers found agreement most often. Markets frequently return to test a previous point of control, and in ranging conditions it tends to act as a magnet that price rotates around.
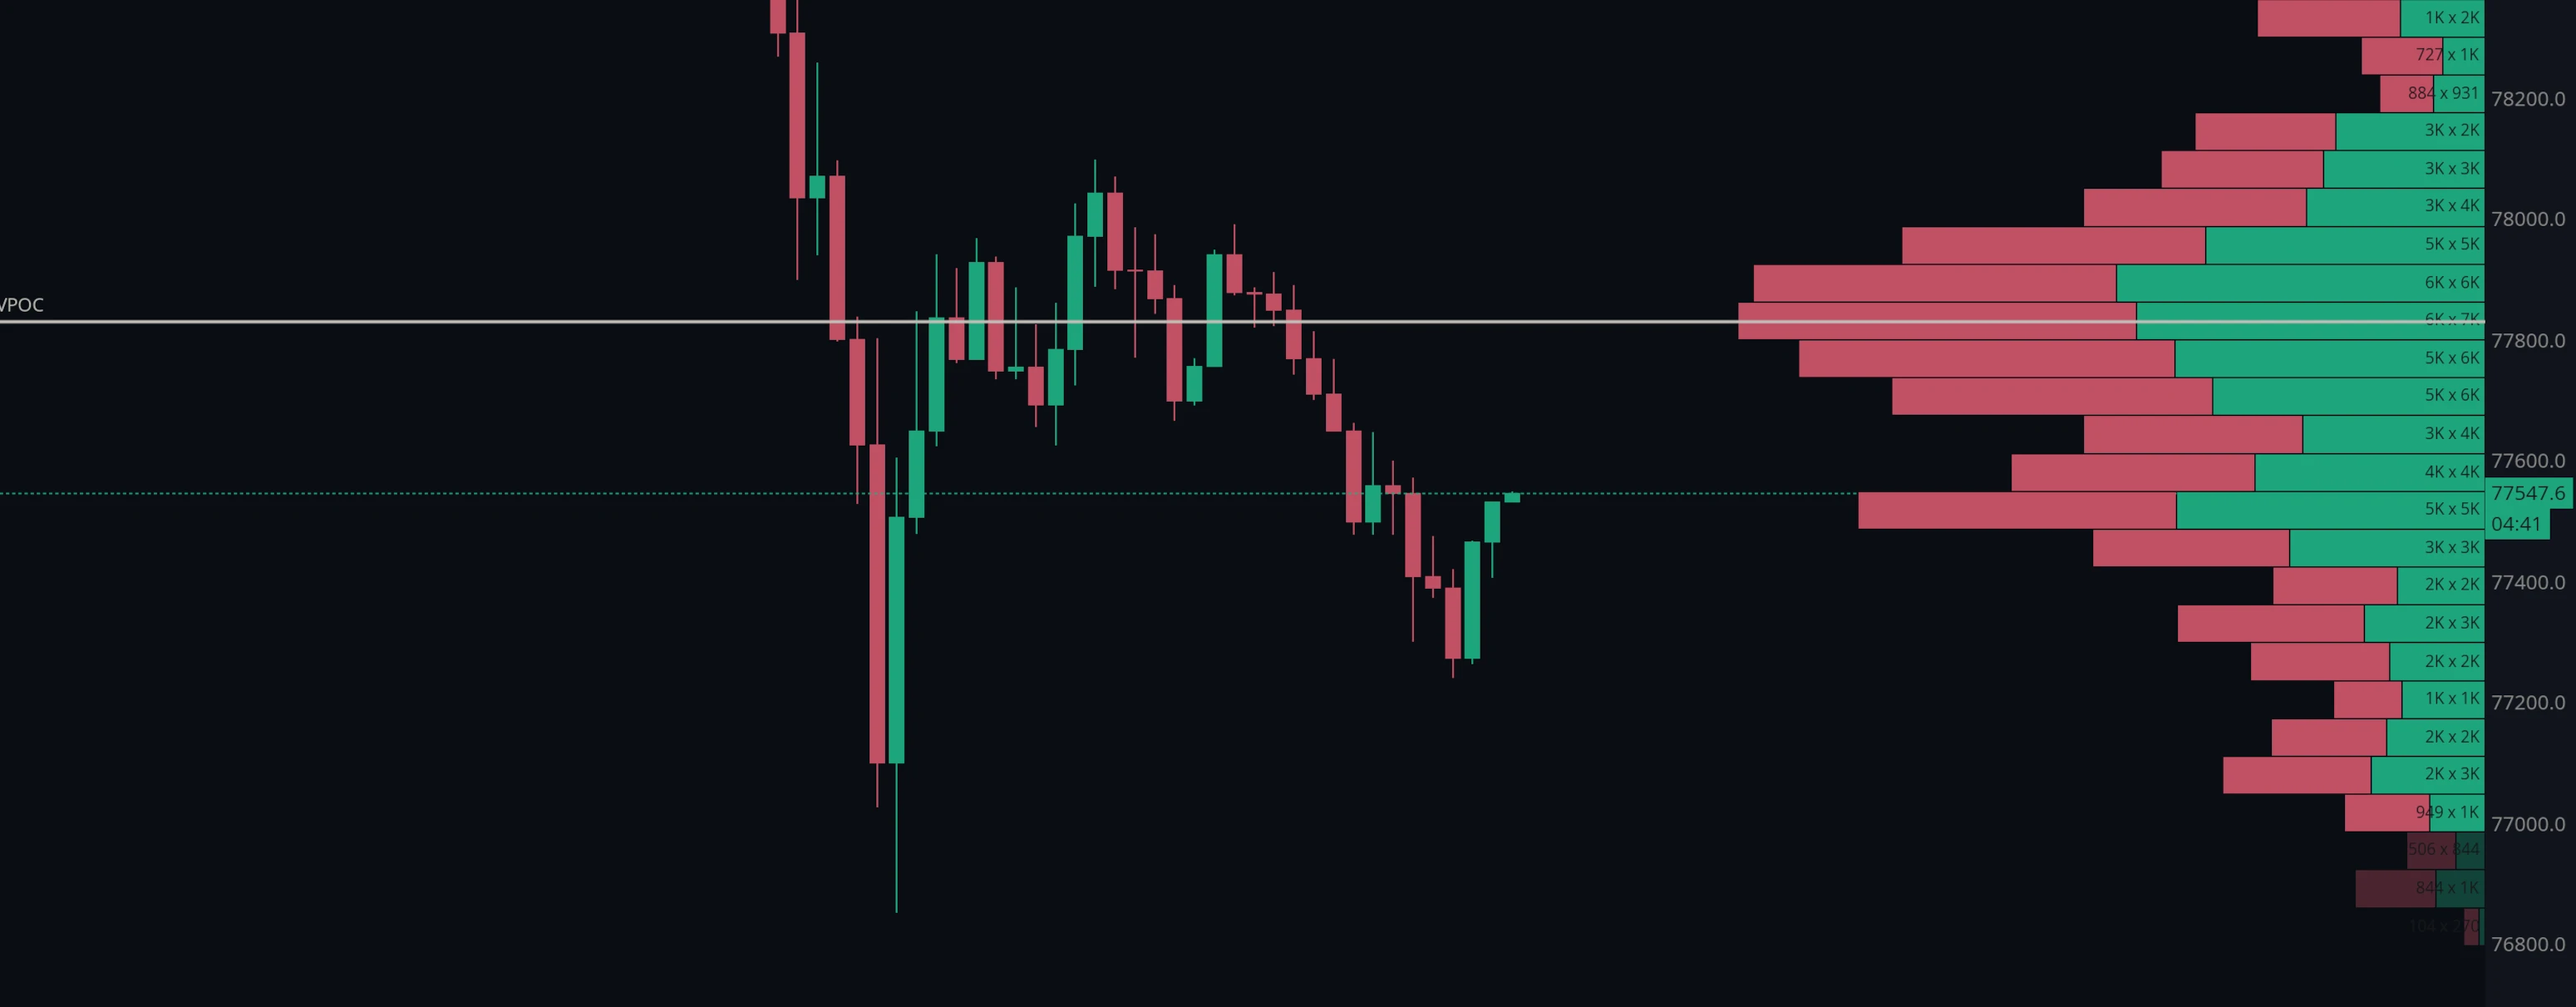
What is the value area?
The value area is the range of prices containing the bulk of the traded volume, 70% by default.
It is calculated outward from the point of control: the rows immediately above and below are compared, the larger is added, and the process repeats until the target percentage is reached. The top of the resulting range is the value area high (VAH) and the bottom is the value area low (VAL).
Those two edges are what most traders watch. Price accepted back inside a value area suggests the market agrees with that valuation again; price rejected at VAH or VAL suggests it does not.
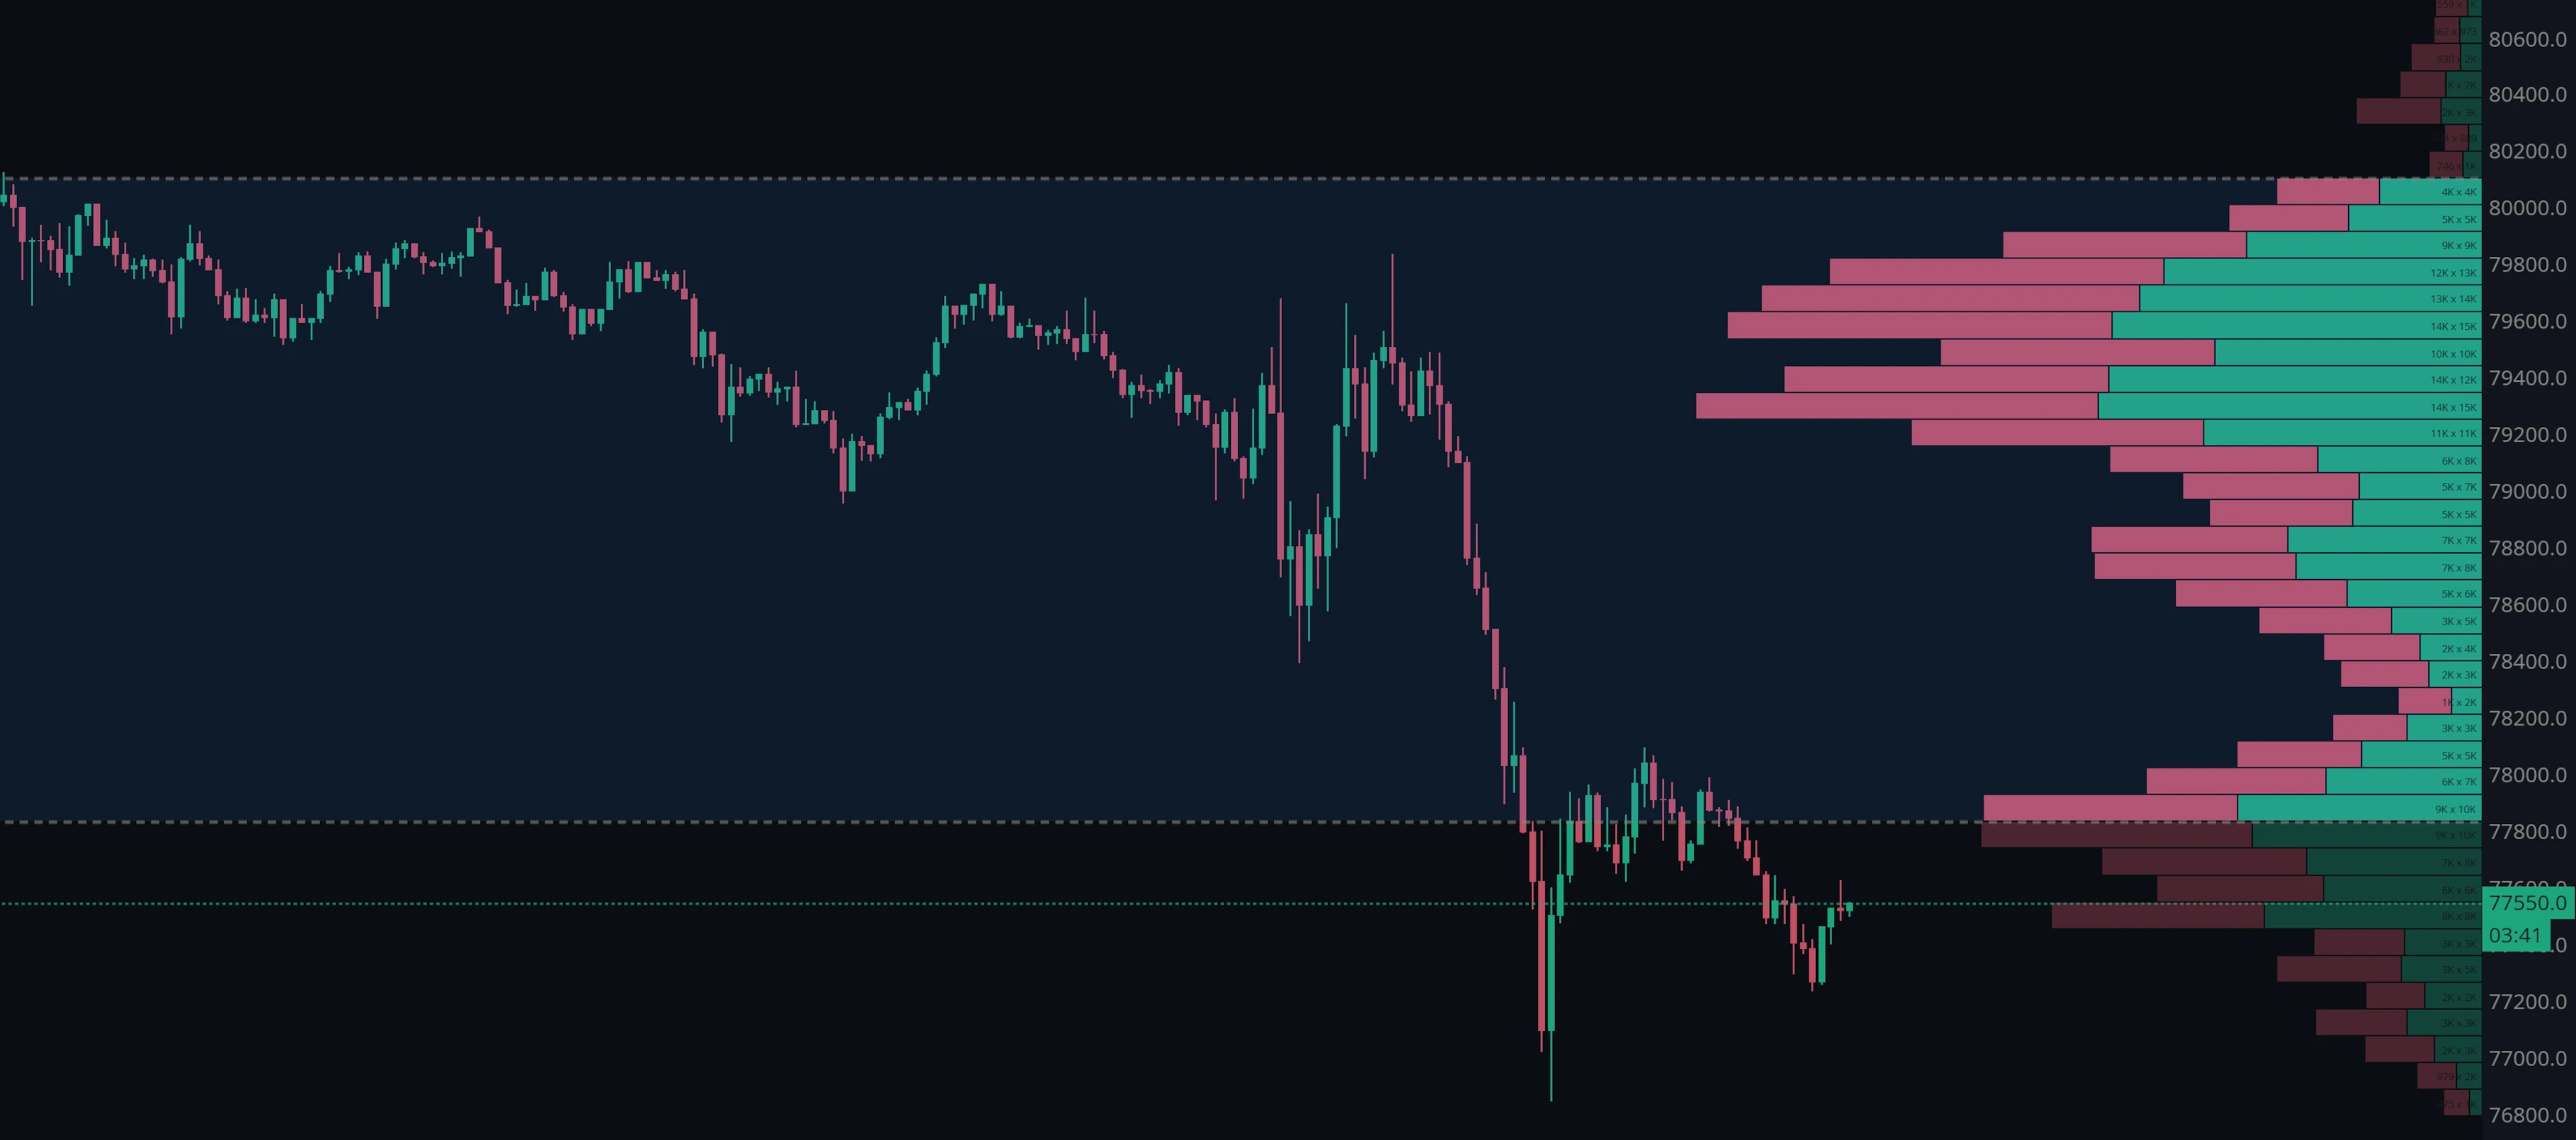
What is the difference between VPVR and a session volume profile?
Both measure volume at price. The difference is what defines the range being measured.
A session volume profile builds one profile per fixed period - a day, a week - so the profiles are anchored to the calendar and stay put as you scroll. VPVR builds a single profile from whatever is currently on screen, so it moves and recalculates as you navigate.
That makes them answer different questions. A session profile tells you what happened during a specific day, which is what you want when comparing one session with the next. VPVR tells you where volume sits across a stretch of market you have chosen yourself, which is what you want when framing a range, a swing or a consolidation that does not align with session boundaries.
When should you use VPVR?
VPVR is at its most useful on ranging markets, where the profile takes on a clear bulge and the point of control and value area edges become levels the market repeatedly tests.
It is also the natural tool for measuring a structure by eye. Zoom to exactly the swing, consolidation or trend leg you care about and the profile describes that structure and nothing else, which is difficult with any fixed-period tool.
Its weakness is the same as its strength: the profile depends entirely on what is on screen. Two traders looking at the same market with different zoom levels will see different points of control, so a VPVR level is only meaningful alongside the range that produced it.
Related: Volume Profile Session Volume (VPSV) · TPO market profile · Order book heatmap
Using VPVR in MMT
MMT’s VPVR recalculates live as the visible range changes. Dragging or zooming the chart redraws the profile continuously rather than after the fact, so you can sweep across a market and watch where the volume concentration sits as your window moves.
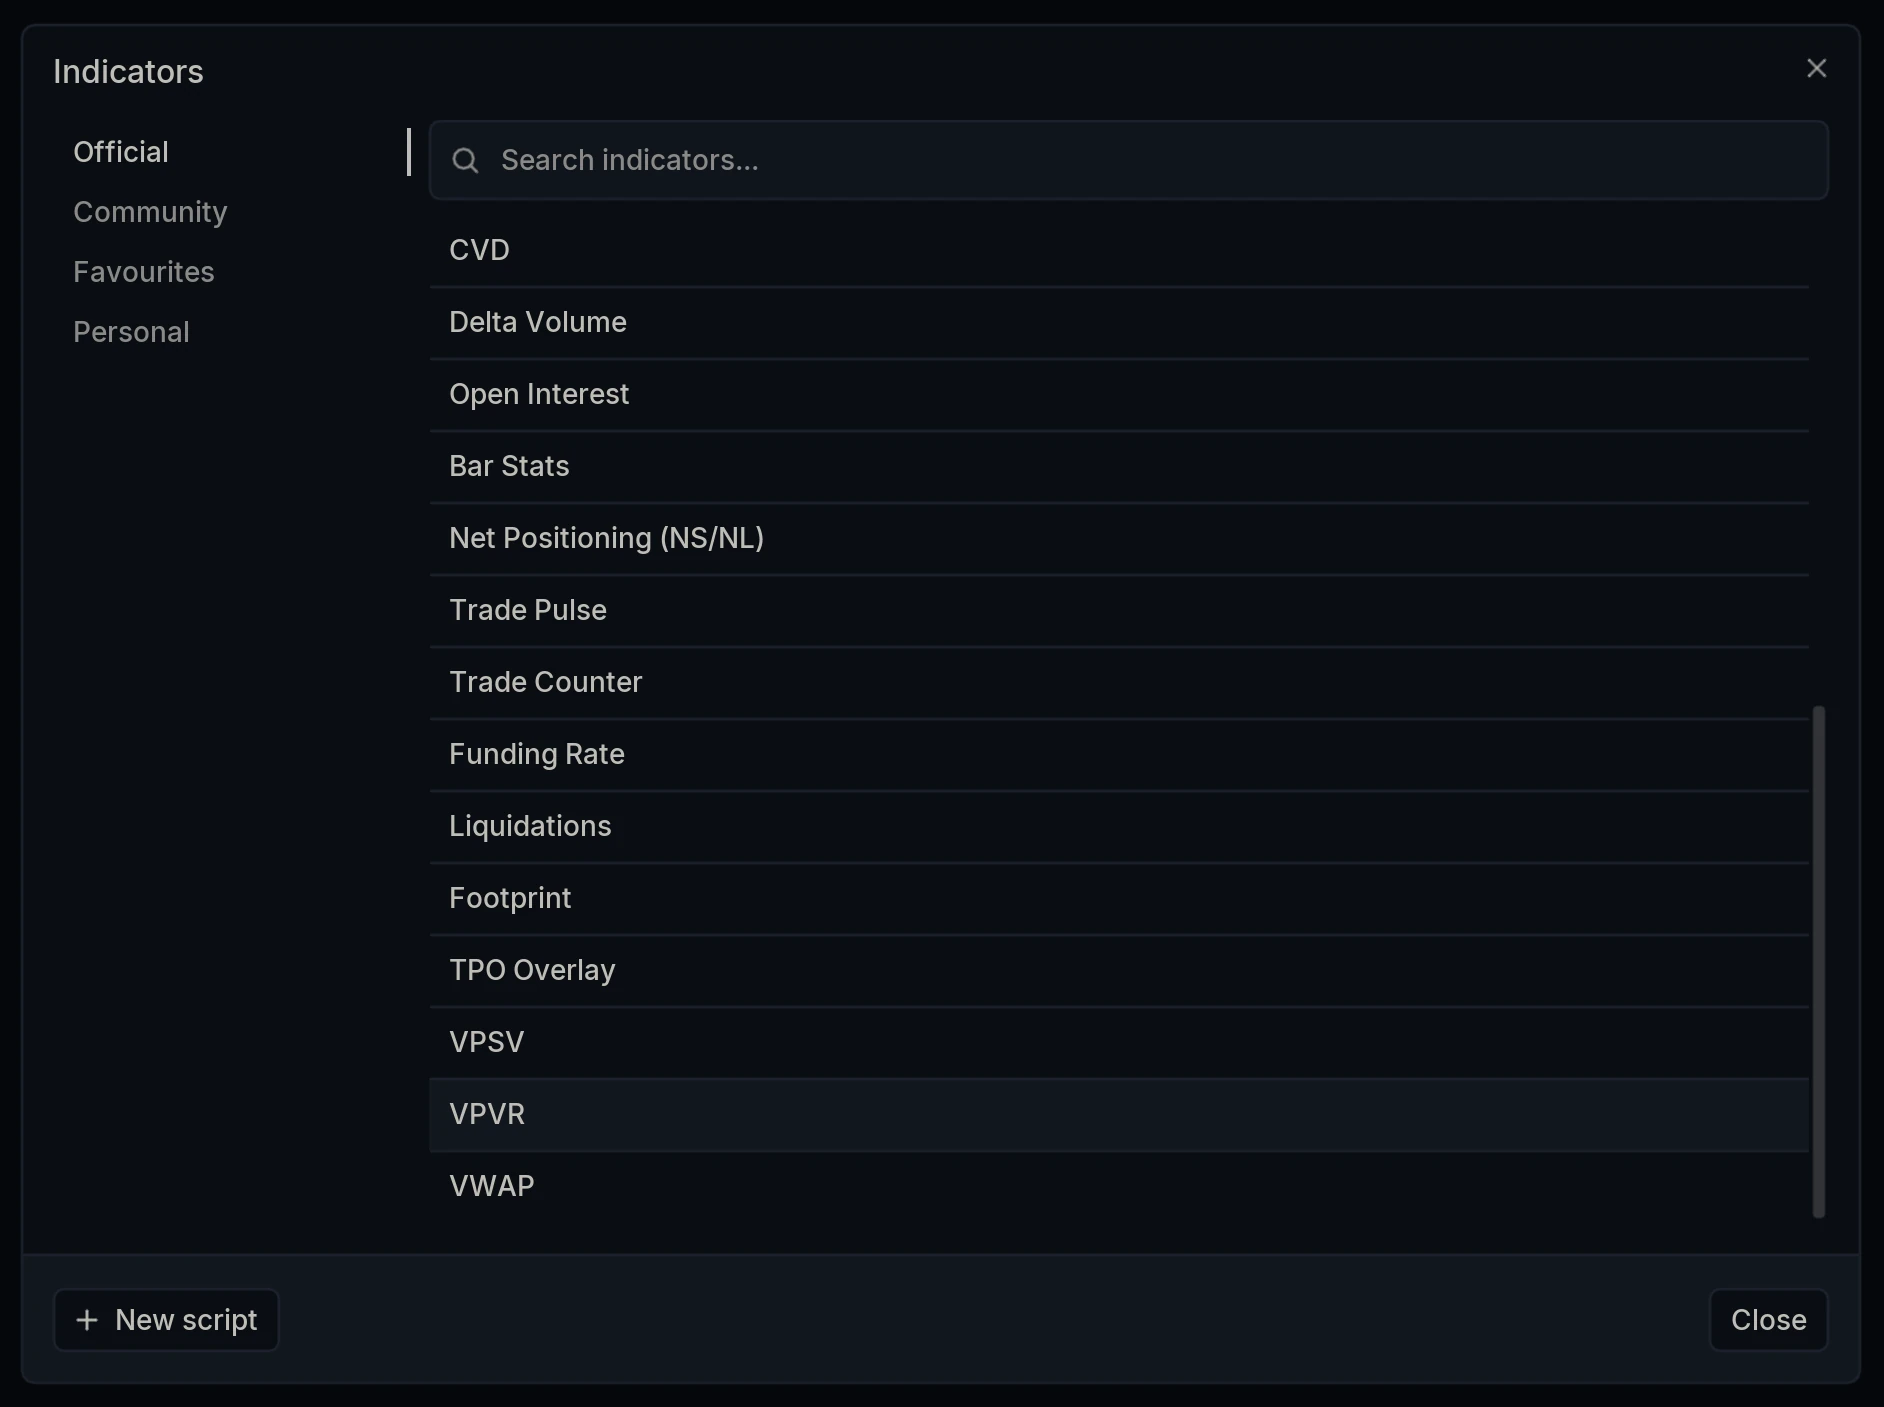
How do you add VPVR to a chart?
Open the Indicators dialog and select VPVR under Official.
What are the render modes?
The Render mode dropdown changes what each row displays. The five modes answer different questions of the same data.
Up/Down splits each row into buy and sell volume, drawn in separate colors. This is the default, and the one to use when the composition of a level matters as much as its size.
Total merges both sides into a single figure per row, rendered in one color. The cleanest read when you only care where volume concentrated.
Delta shows the net difference between buy and sell volume at each level, so a row reflects which side was in control rather than how much traded.
Combined layers the views together, showing total volume with the dominant side and the delta drawn over it.
Profile outline draws the profile as an outline rather than filled bars, which keeps the shape readable while leaving the price action behind it clear.
Layer Settings
Open VPVR Settings via the cog wheel on the layer name. The panel has five tabs: Display, Row / Scaling, POC, Value Area and Aggregate.
Display
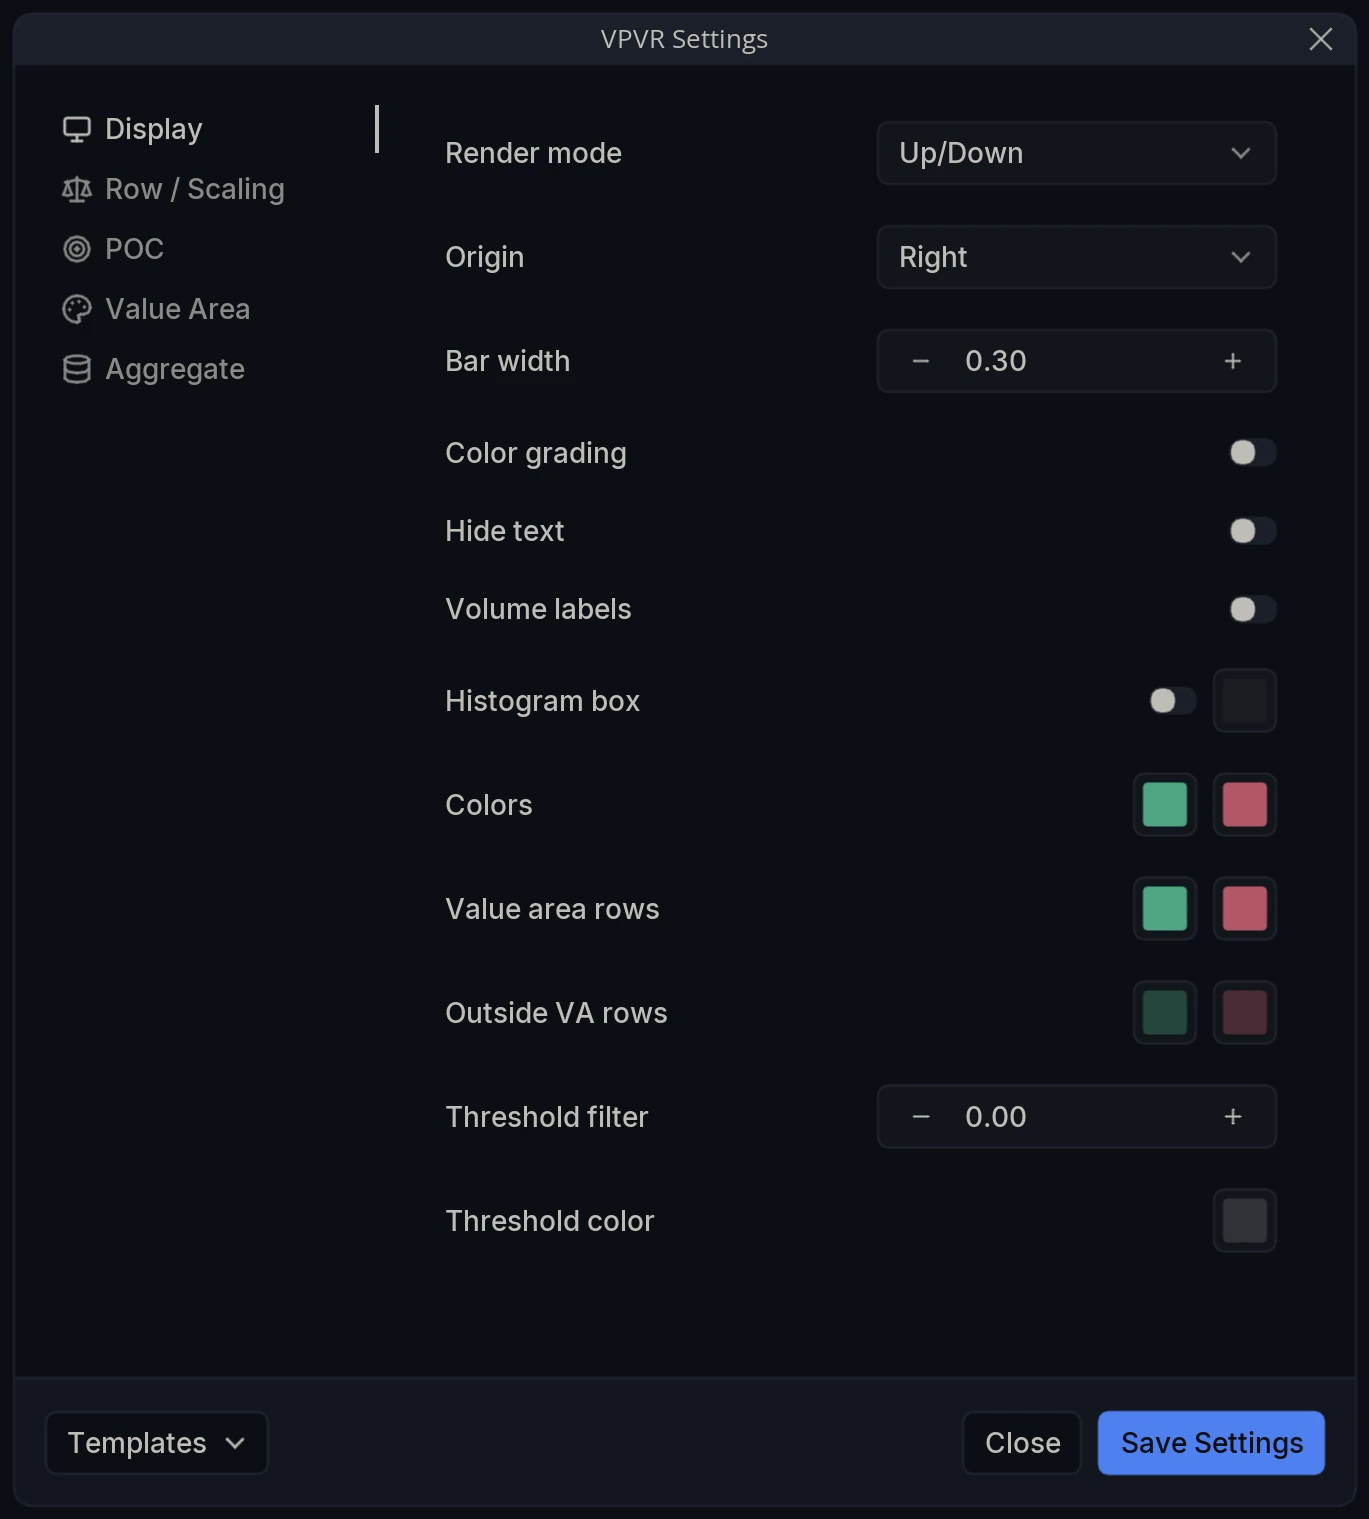
Render mode - How each row is drawn: Up/Down, Total, Delta, Combined or Profile outline.
Origin - Which side of the chart the profile is anchored to, Left or Right.
Bar width - The maximum width of the longest row, as a fraction of the chart width. 0.30 means the widest row spans 30% of the screen.
Color grading - Shade each row by its volume so the largest rows render most strongly and smaller ones fade back.
Hide text - Hide the POC label drawn on the chart.
Volume labels - Print the volume figure inside each row.
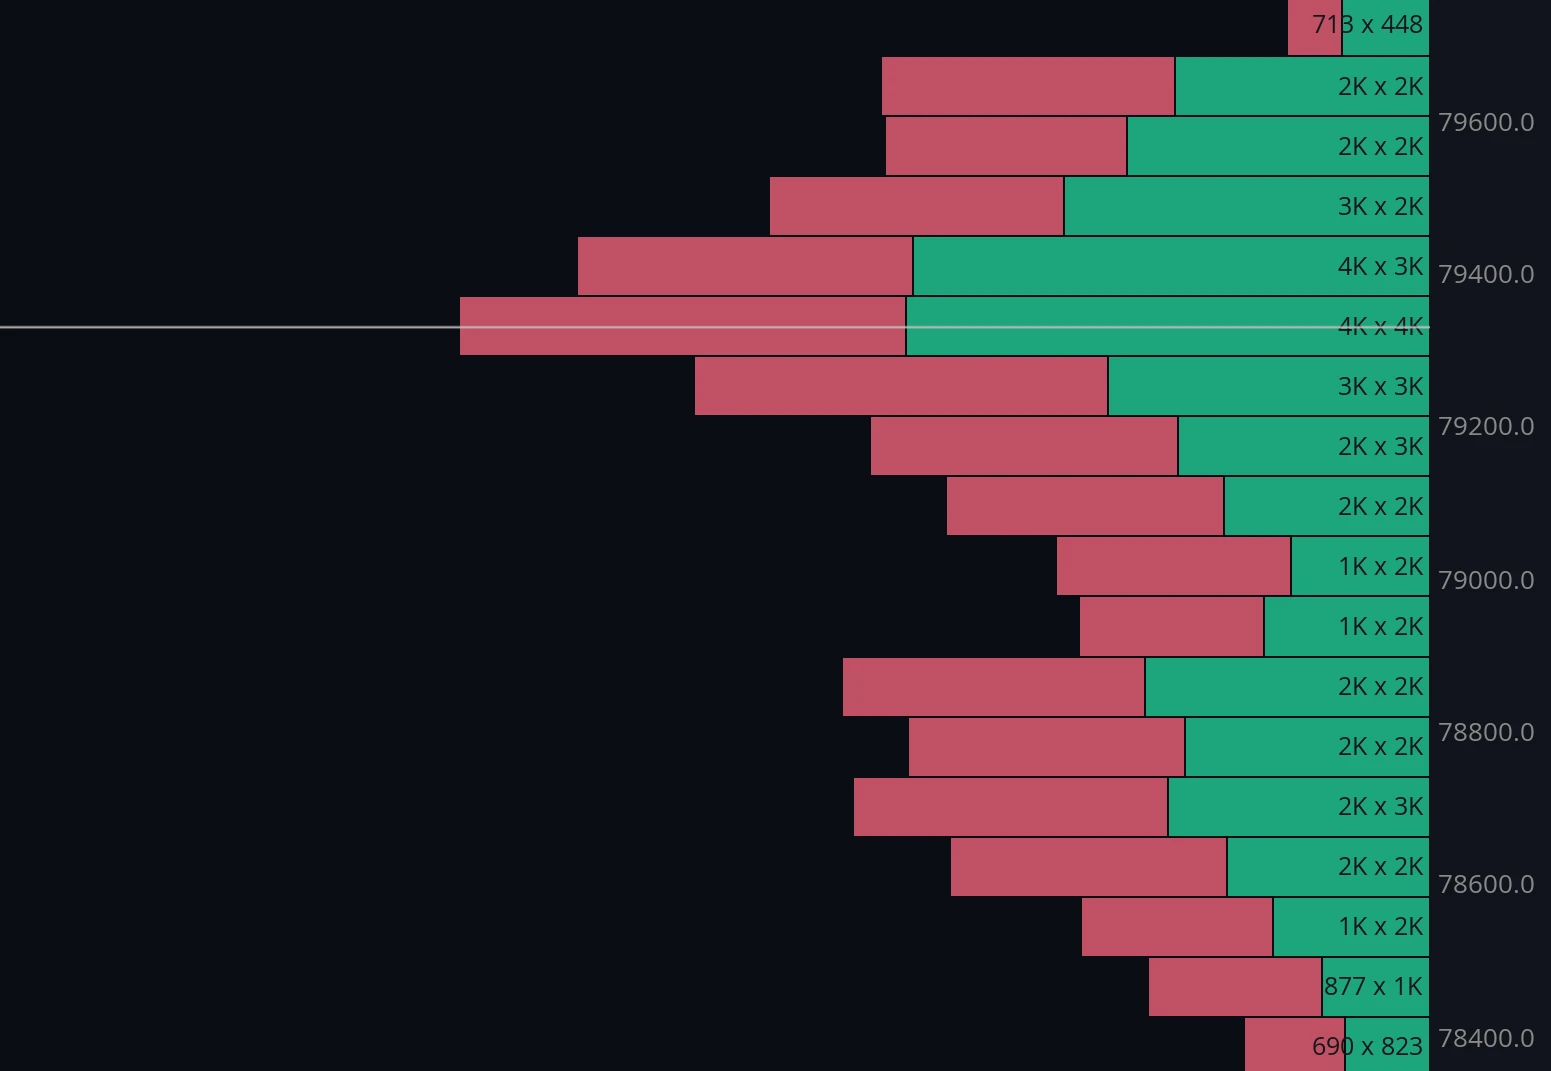
Histogram box - Draw a shaded box around the profile spanning the visible range, with its own color.
Colors - The two colors used for buy and sell volume.
Value area rows - Colors applied to rows inside the value area.
Outside VA rows - Colors applied to rows outside the value area, so the value area stands out from the rest of the profile.
Threshold filter - The volume level a row must exceed to be highlighted.
Threshold color - The color applied to every row above that threshold.
Row / Scaling
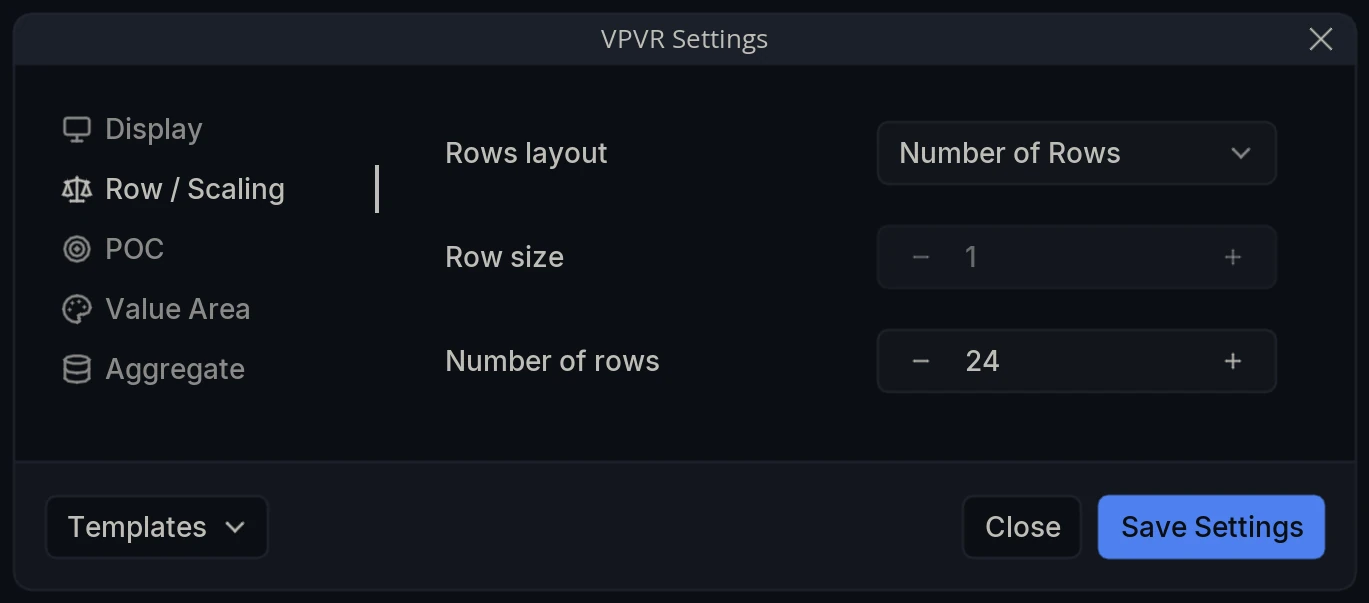
Rows layout - How row height is decided: Number of Rows divides the visible range into a fixed count, Ticks Per Row sets each row to a fixed number of ticks, and Global (per-pair) uses the shared per-pair value that other indicators in global mode also use.
Row size - The ticks per row, active when Rows layout is set to Ticks Per Row.
Number of rows - How many rows the visible range is divided into, active when Rows layout is set to Number of Rows.
POC
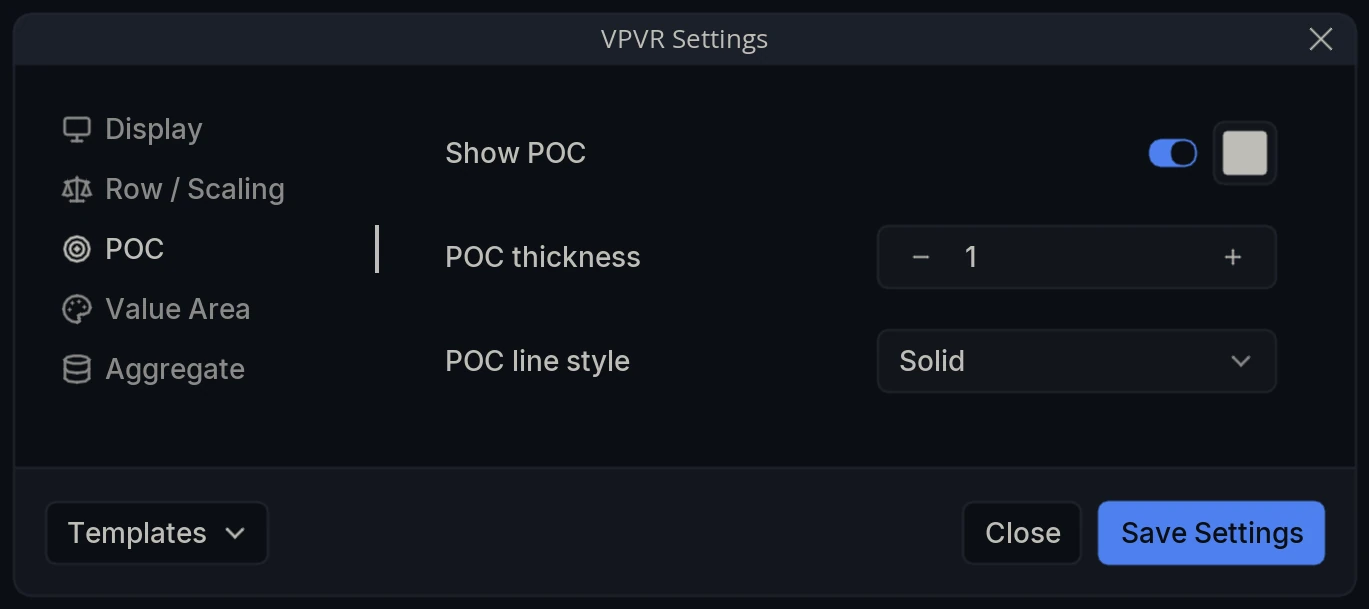
Show POC - Draw the point of control line, with its own color.
POC thickness - Thickness of that line.
POC line style - Solid, or one of the dashed styles.
Value Area
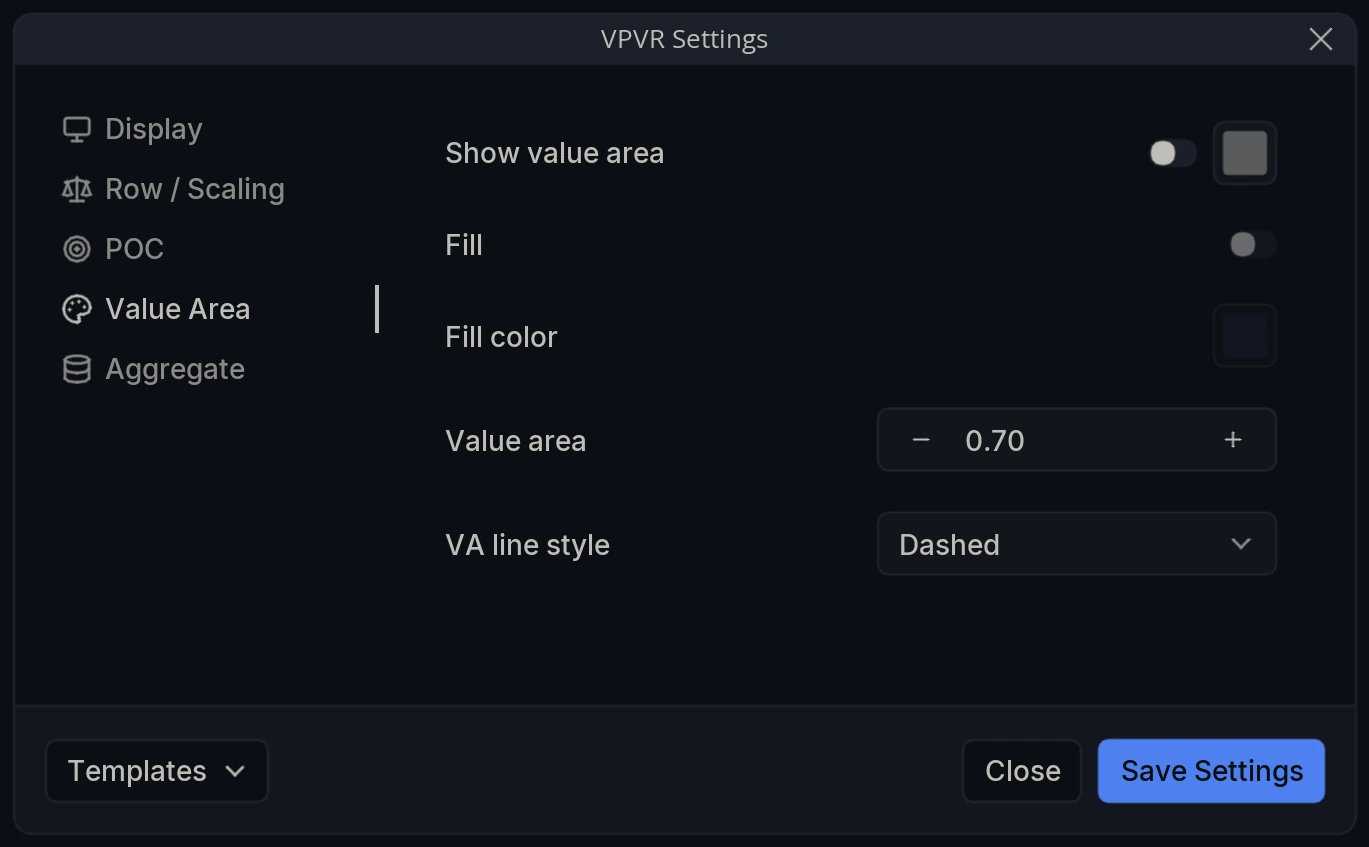
Show value area - Draw the value area high and low lines, with their own color.
Fill - Shade the area between VAH and VAL.
Fill color - Color of that shading.
Value area - The proportion of total volume the value area contains. 0.70 by default.
VA line style - Dashed by default, or one of the other line styles.
Aggregate
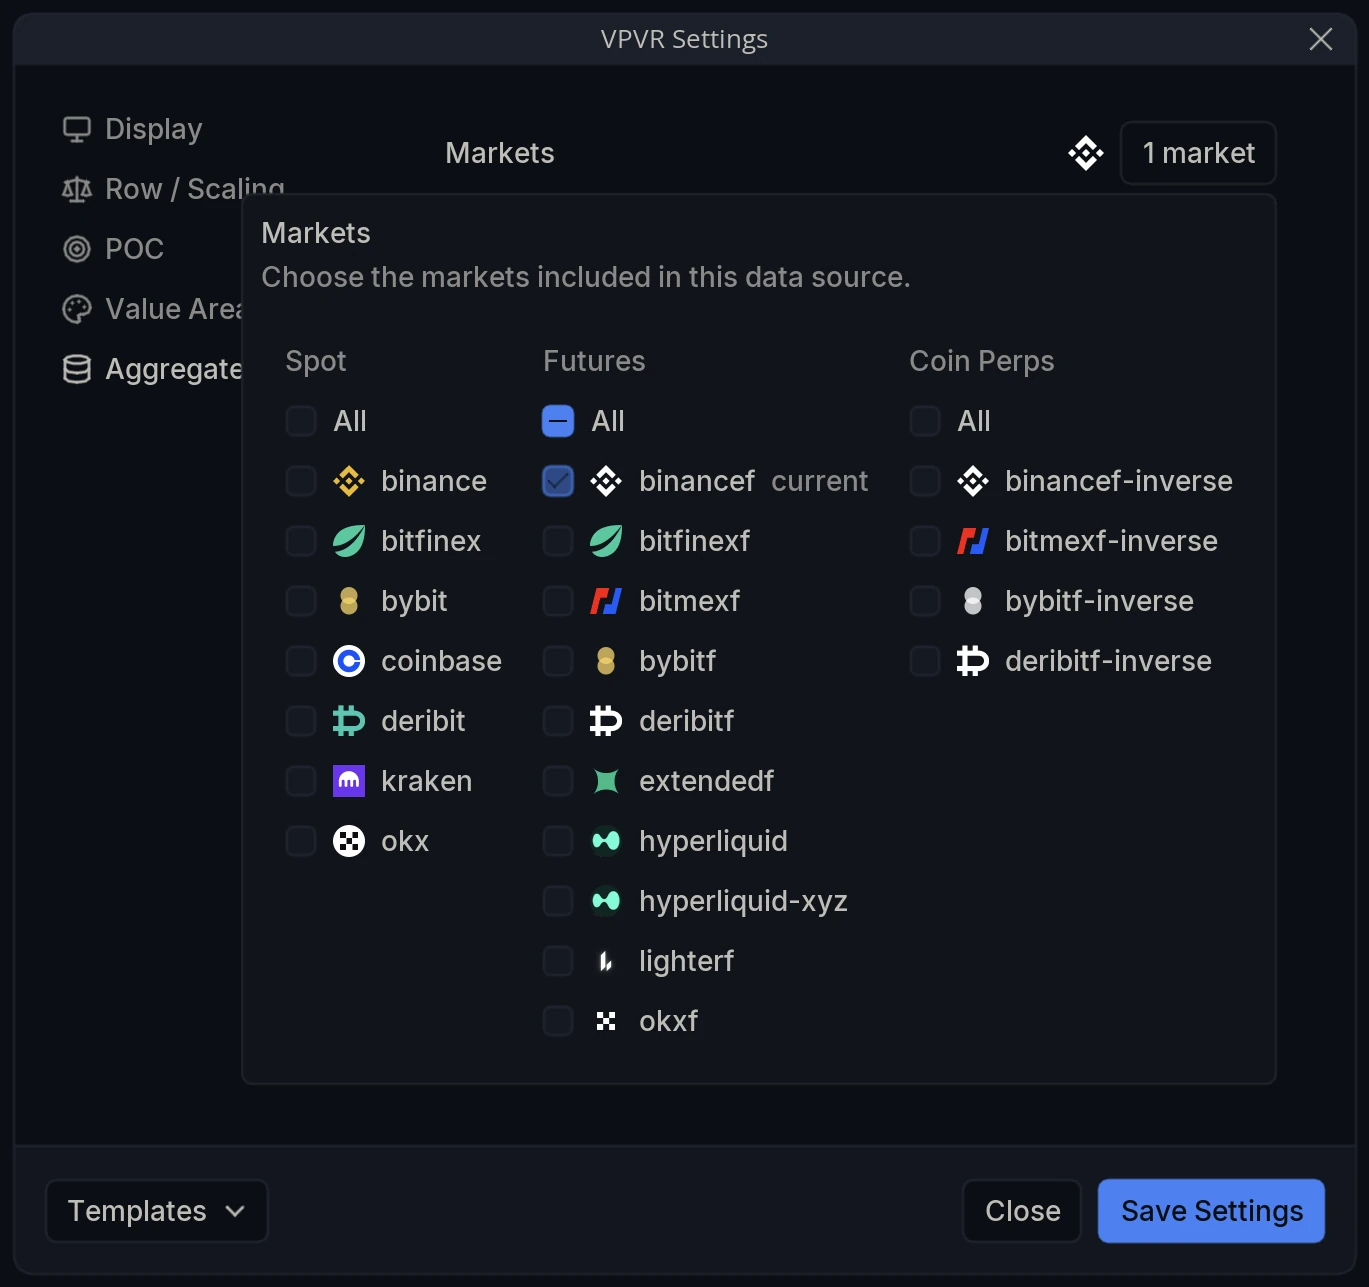
Markets - Choose the markets included in the profile. Clicking the market count opens a selector grouped into Spot, Futures and Coin Perps, with an All toggle per group; your chart’s own market is tagged current. Combining venues builds the profile from their pooled volume rather than one exchange alone.