What are bar statistics?
By MichaelUpdated August 25, 2026
Bar statistics are the underlying numbers behind each candle on a chart: how much volume traded, how it split between buyers and sellers, how many trades made it up, what happened to open positions. Displayed as a grid aligned to the bars, they can be read directly rather than estimated from an indicator.
How do bar statistics work?
Every candle on a chart is a summary. It compresses a period of trading into four prices, and everything else about that period is discarded the moment the bar is drawn.
Indicators recover some of that by plotting one measurement at a time as a line or a histogram. That works, but it costs screen space, it only ever shows the shape of a value rather than the value itself, and comparing three measurements means running three panels and reading them against each other by eye.
A statistics table takes the other approach. It lays the numbers out in a grid aligned to the bars: each column belongs to one candle, each row to one measurement. Nothing is plotted, so nothing is approximated. You read the figure for that bar, and you read the bar next to it, and the comparison is exact.
The cells are usually shaded by size, which is what keeps a wall of numbers legible. Color carries the magnitude so the eye can find the outliers, and the text carries the precision so you can check what an outlier actually was.
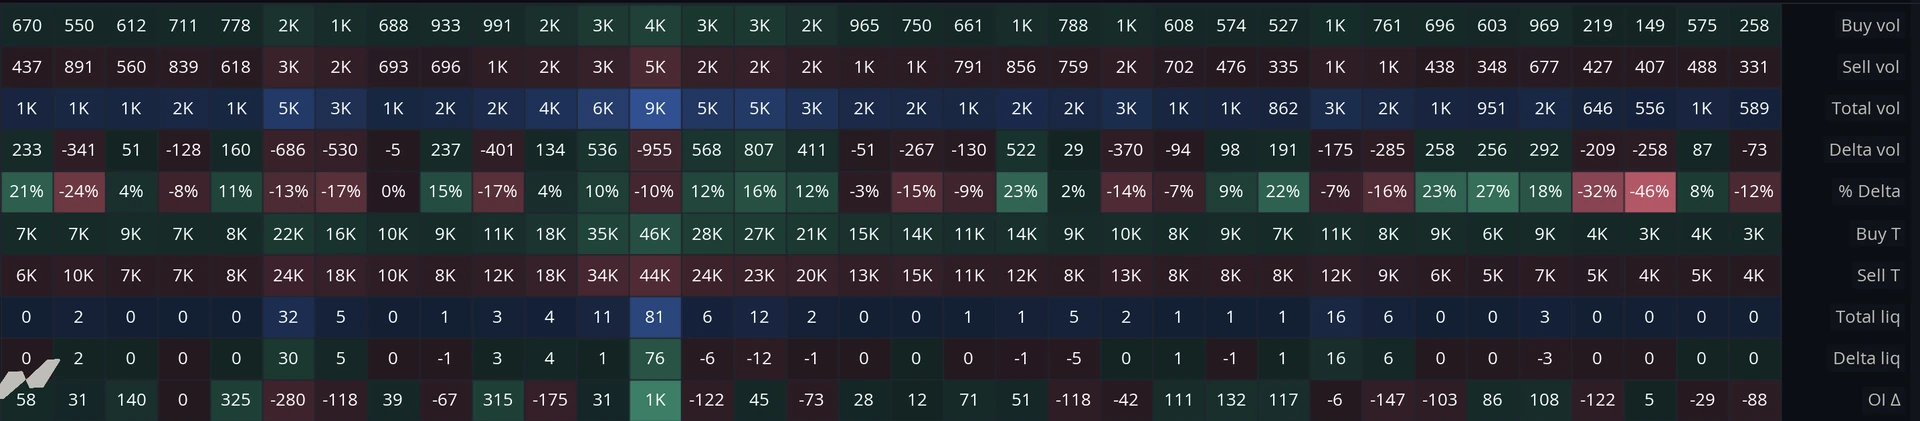
Reading down a single column gives you a complete picture of one bar. In the column above, a spike shows in total volume, in both trade counts and in liquidations at the same time, which describes a very specific event: a lot of participants, trading a lot of size, with forced closures among them.
Why read the numbers instead of an indicator?
Indicators and tables answer different questions, and the difference is precision against shape.
An indicator is better for shape. A cumulative delta line, a volume histogram, a trend in open interest - anything where the pattern over many bars is the point is easier to see plotted than tabulated.
A table is better for precision, and for breadth. Three things it does that a stack of panels does not:
It shows many measurements at once. Ten rows in a table occupy the space of one indicator panel, and every row is aligned to the same bars, so cross-reading is free.
It gives you the actual figure. “Delta was strongly negative” is what a histogram tells you. “Delta was -955 on 9K total volume” is what a table tells you, and the second is a claim you can act on.
It makes ratios readable. Buy volume against sell volume, trades against volume, delta against total - the interesting numbers are often relationships between rows, and relationships are what a grid is built for.
How do you read a graded cell?
Two things carry meaning in each cell: the number and the background behind it.
The number is the measurement for that bar. The background is a shade whose intensity reflects how large that value is relative to a maximum, so the heaviest bars stand out without being read.
What counts as the maximum is a choice, and it changes the reading completely. Grade against the whole chart and only the genuinely extreme bars light up, which is what you want for finding historic events. Grade against a shorter window, a day or the visible range, and the shading rescales to that window, so a busy bar in a quiet session is visible even though it would be unremarkable against the chart’s all-time high.
A threshold on top of that suppresses the background on small values entirely, leaving only the numbers. It is a noise control: the routine bars stop competing for attention and the table shows color only where something happened.
What are the limits of bar statistics?
It costs vertical space. Every row you enable is space the chart does not get. A table with everything switched on is a spreadsheet with a chart above it.
It is bar-by-bar, not cumulative. Each column describes its own period. Anything that needs accumulation across bars, such as CVD, is better read as a plot.
Numbers are slower than shapes. Reading a grid is deliberate work. In fast conditions the plotted version of the same data will reach you sooner.
It rewards restraint. The table is most useful with a handful of rows chosen for the question you are asking. Enabling everything available is the quickest way to make it useless.
Related: Volume · CVD (Cumulative Volume Delta) · Liquidations · Open interest
Using Bar Stats in MMT
MMT’s Bar Stats layer draws a grid aligned to the chart’s bars, one column per candle. Around forty measurements are available, each toggled on or off individually with its own colors, and every cell is shaded against a grading window you choose. Row labels sit on the right-hand side of the grid.
How do you add Bar Stats to a chart?
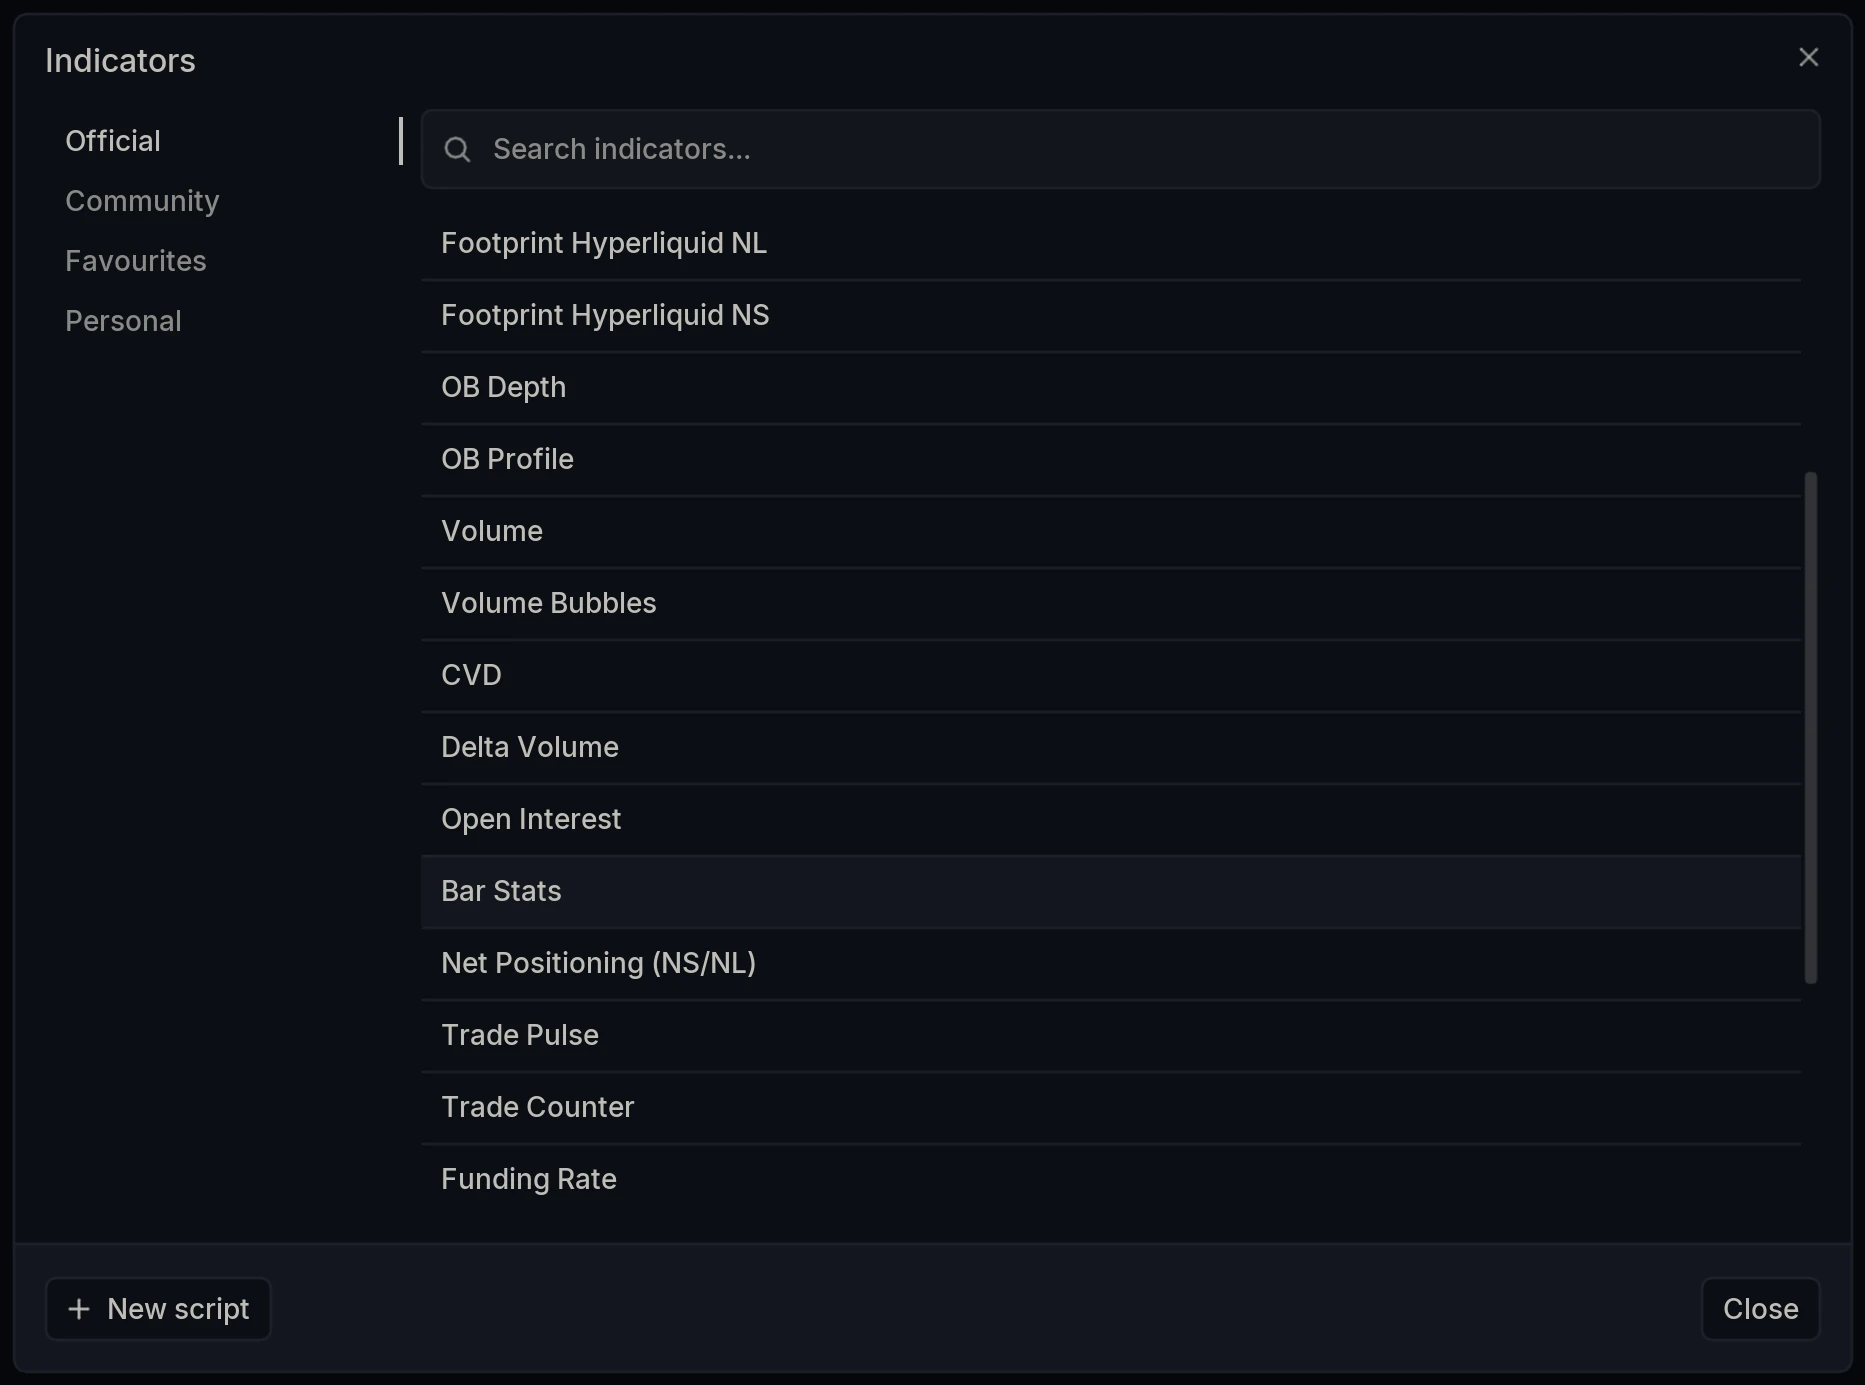
Open the Indicators dialog and select Bar Stats under Official.
What can Bar Stats show?
The available rows cover most of what the other layers plot, which is what makes the table useful as a single reference:
Volume - Buy, Sell, Total, Delta and % Delta.
Trades - Buy, Sell and Total trade counts, the same measurement as the Trade Counter.
Liquidations - Buy, Sell, Total and Delta, plus separate buy and sell liquidation trade counts.
Positioning - Open Interest, Net Long and Net Short.
Extremes - Min Delta and Max Delta for the bar.
Rates and prices - Funding Rate and Mark Price.
Order book depth - one row per band, matching the OB Depth layer: 0.1%, 0.25%, 0.5%, 1%, 2.5%, 5% and 10%.
CVD by trade size - one row per bucket, matching the CVD trade size filter: All, then $1-$1K through to $5M+.
Row labels in the grid are abbreviated, so Buy vol, Delta vol, % Delta, Buy T, Total liq and OI Δ are what you see against each row.
How does grading work?
Grading decides what each cell’s shading is measured against. Four of the five options are time windows. The fifth is not, and it is the interesting one.
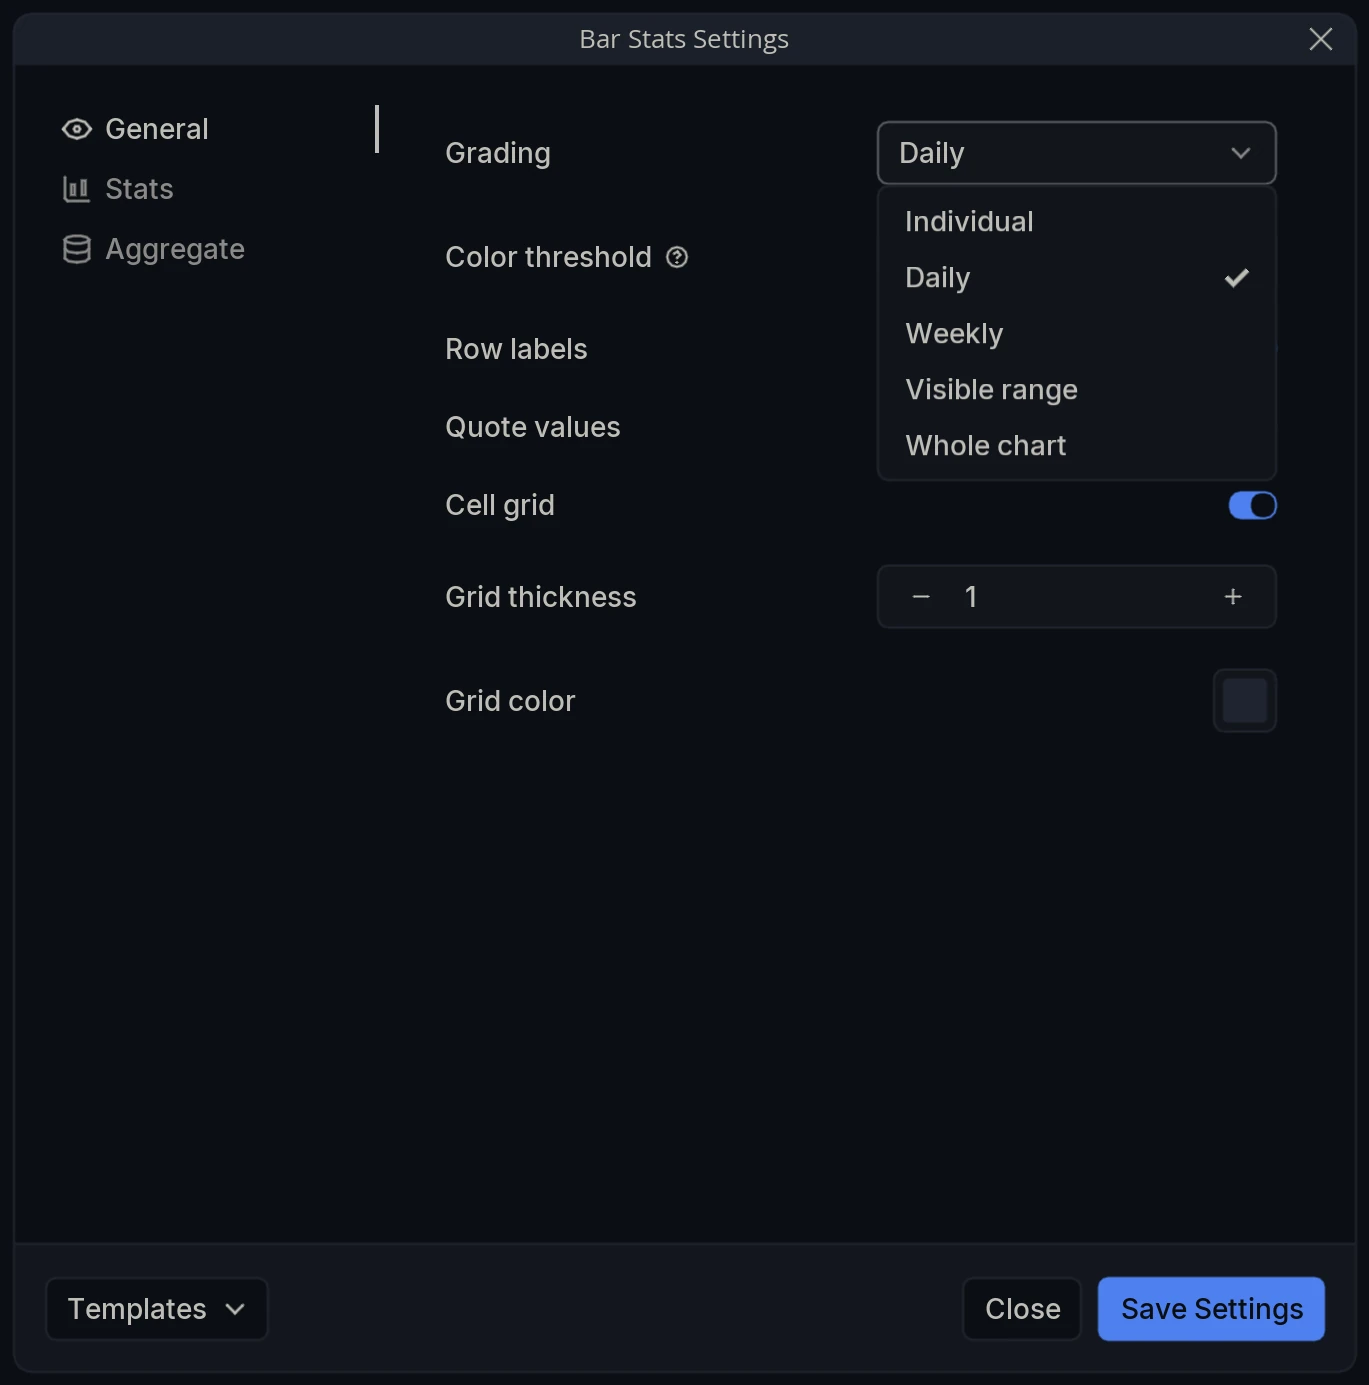
Daily, Weekly, Visible range and Whole chart each set the scope used to find the maximum a cell is scaled to. A wide window such as Whole chart holds the scale fixed as you navigate, so a cell’s color means the same thing wherever you scroll and only true extremes shade strongly. A narrow window such as Daily rescales to each period, so the busiest bar of a quiet day shades as strongly as the busiest bar of a violent one. The first answers “was this big?”, the second answers “was this big for now?”.
Individual compares a bar with itself rather than with other bars. On the split rows, buy against sell volume, buy against sell trades, buy against sell liquidations, each cell shades by its share of that bar’s own total. A bar that was 90% buy volume shades strongly; a bar that was an even split barely shades at all. Rows with no counterpart are simply colored where there is a value and left blank where there is none.
That makes Individual the setting for reading imbalance rather than size, and it inverts what the windows do. A quiet bar that was overwhelmingly one-sided stands out, and a huge bar that was evenly matched does not.
Color threshold works on top of it. As the tooltip in the panel puts it: values below this share of the grading maximum keep their text but lose their background color. At 0% every cell is shaded; raising it strips the background from the routine bars and leaves color only on the ones worth looking at.
Layer Settings
Open Bar Stats Settings via the cog wheel on the layer name. The panel has three tabs: General, Stats and Aggregate.
General
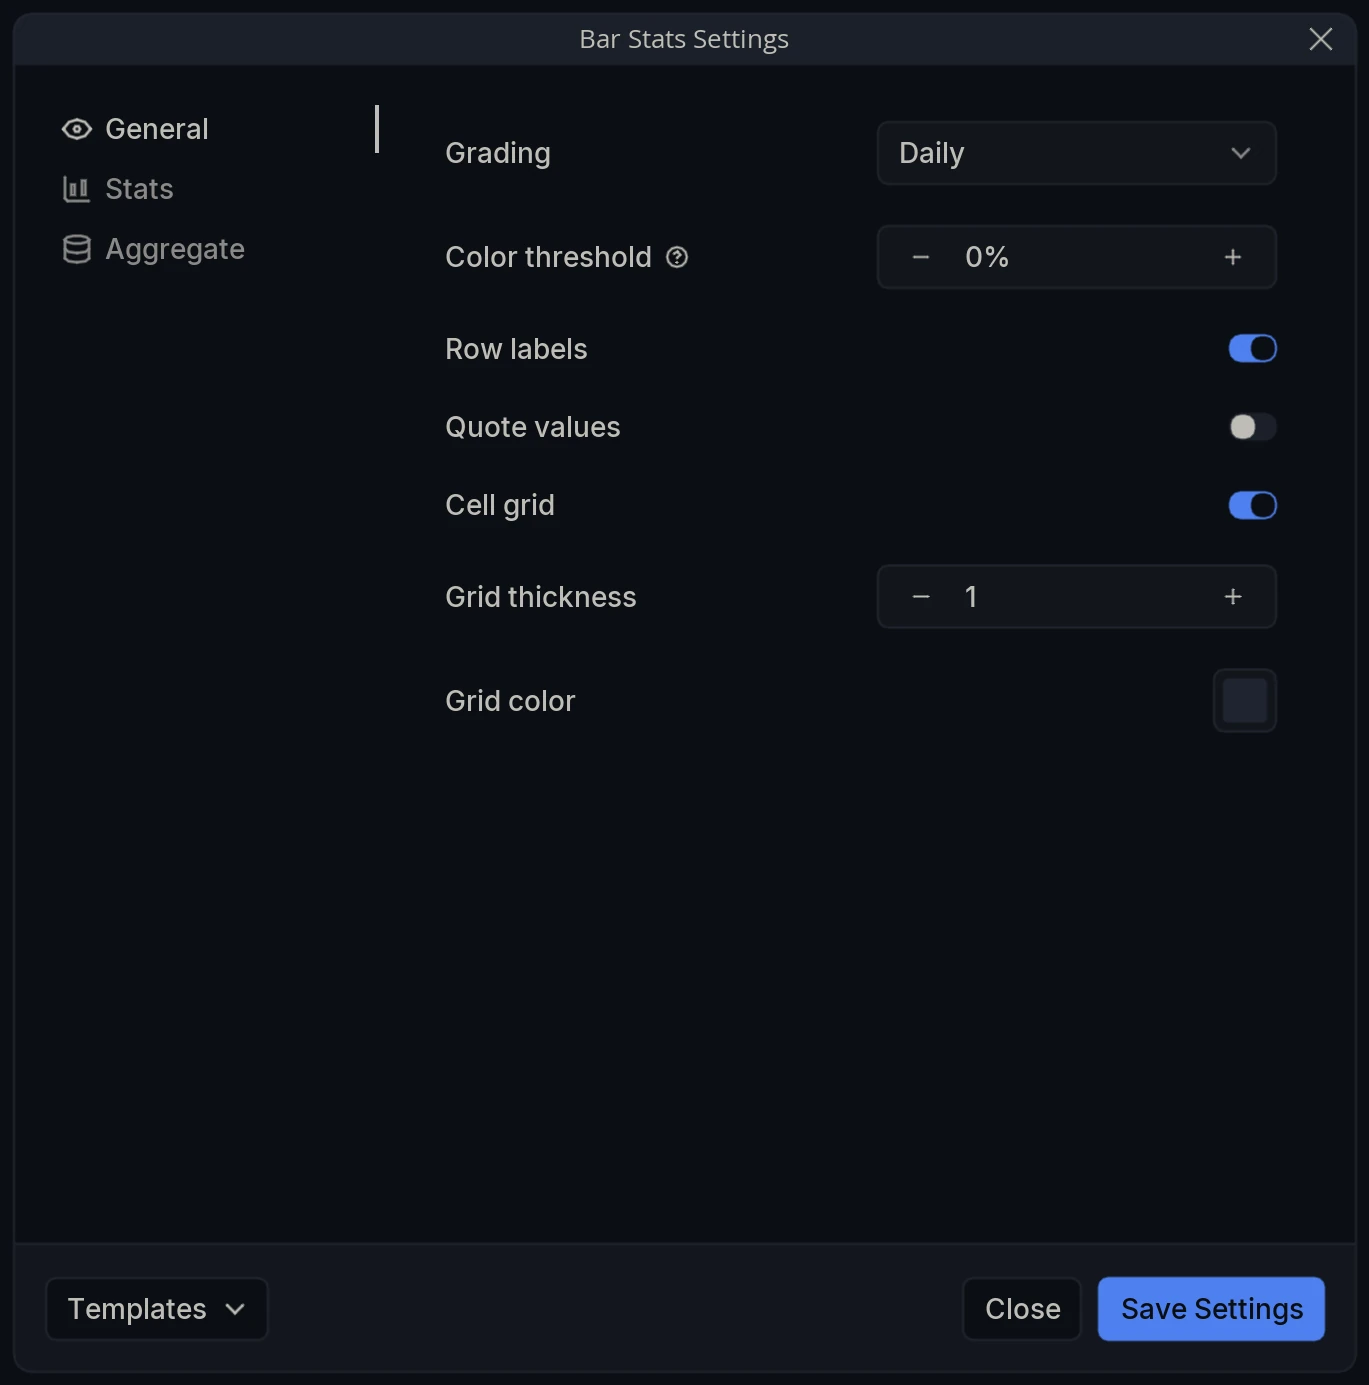
Grading - What each cell’s shading is measured against. Daily, Weekly, Visible range and Whole chart scale every cell to the largest value in that window. Individual instead scales each split row by that bar’s own share of its total, so a heavily one-sided bar shades strongly whatever its size, and rows with no counterpart are colored where a value exists and blank where it does not.
Color threshold - Values below this share of the grading maximum keep their text but lose their background color. 0% by default, so every cell is shaded.
Row labels - Show the abbreviated stat name against each row, on the right-hand side of the grid. Turned off, the grid shows the figures alone.
Quote values - Report values in the quote currency rather than in units of the base asset. The same setting other layers label USD values.
Cell grid - Draw lines between the cells.
Grid thickness - Weight of those lines.
Grid color - Color of those lines.
Stats
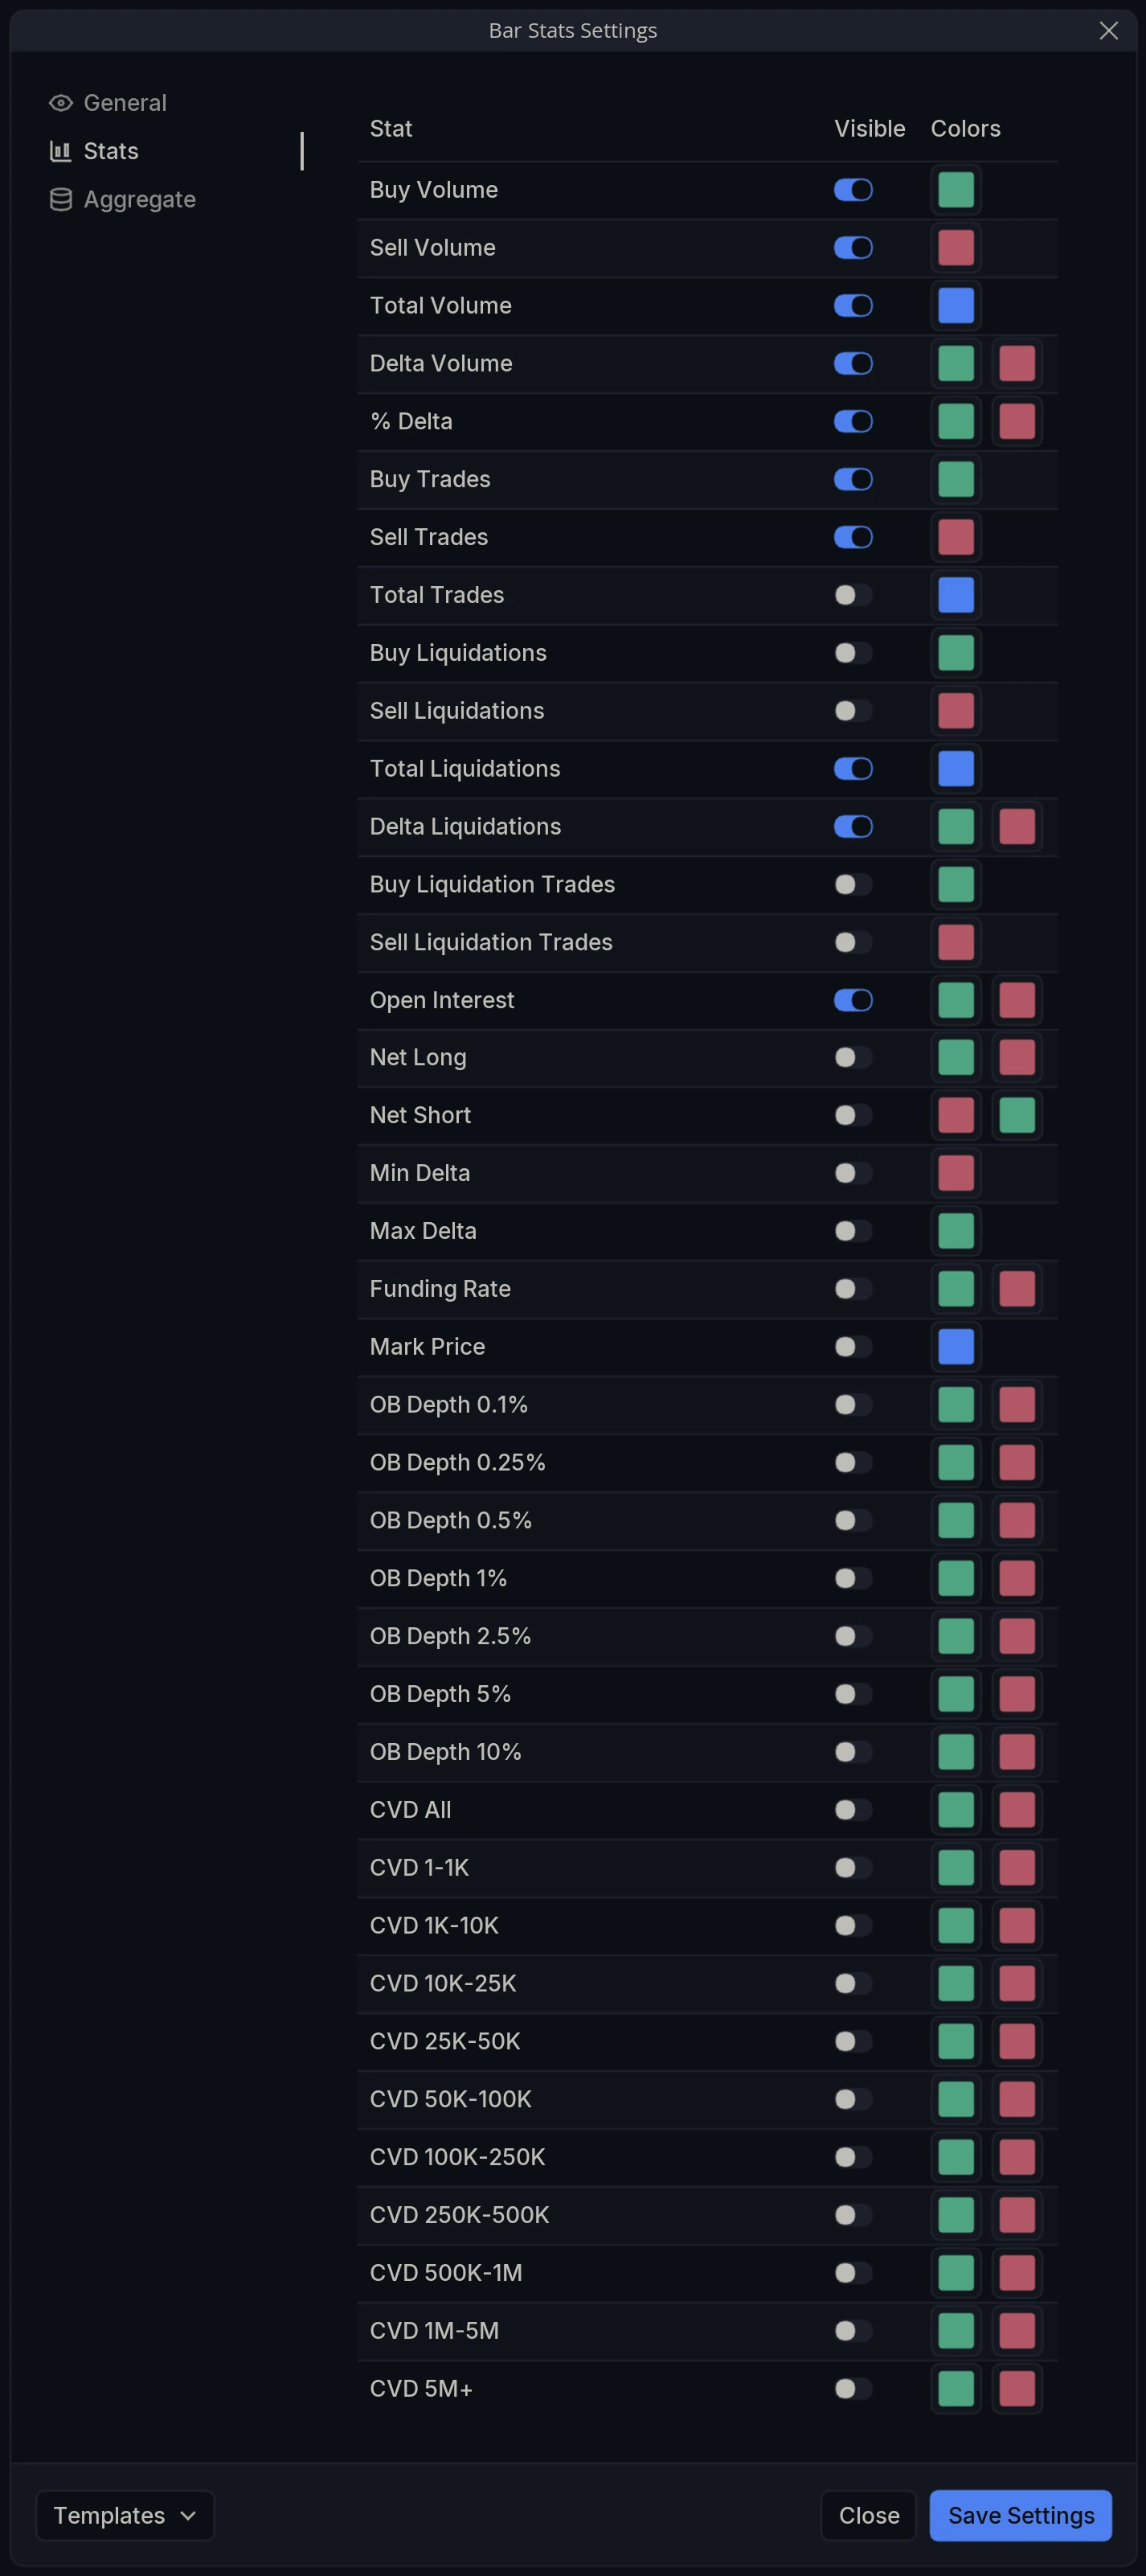
Every available measurement is listed here with a Visible toggle and its Colors. Rows that can only be positive, such as Buy Volume, carry a single color. Rows that can be either sign, such as Delta Volume, % Delta or Open Interest, carry two, one for each direction.
Aggregate
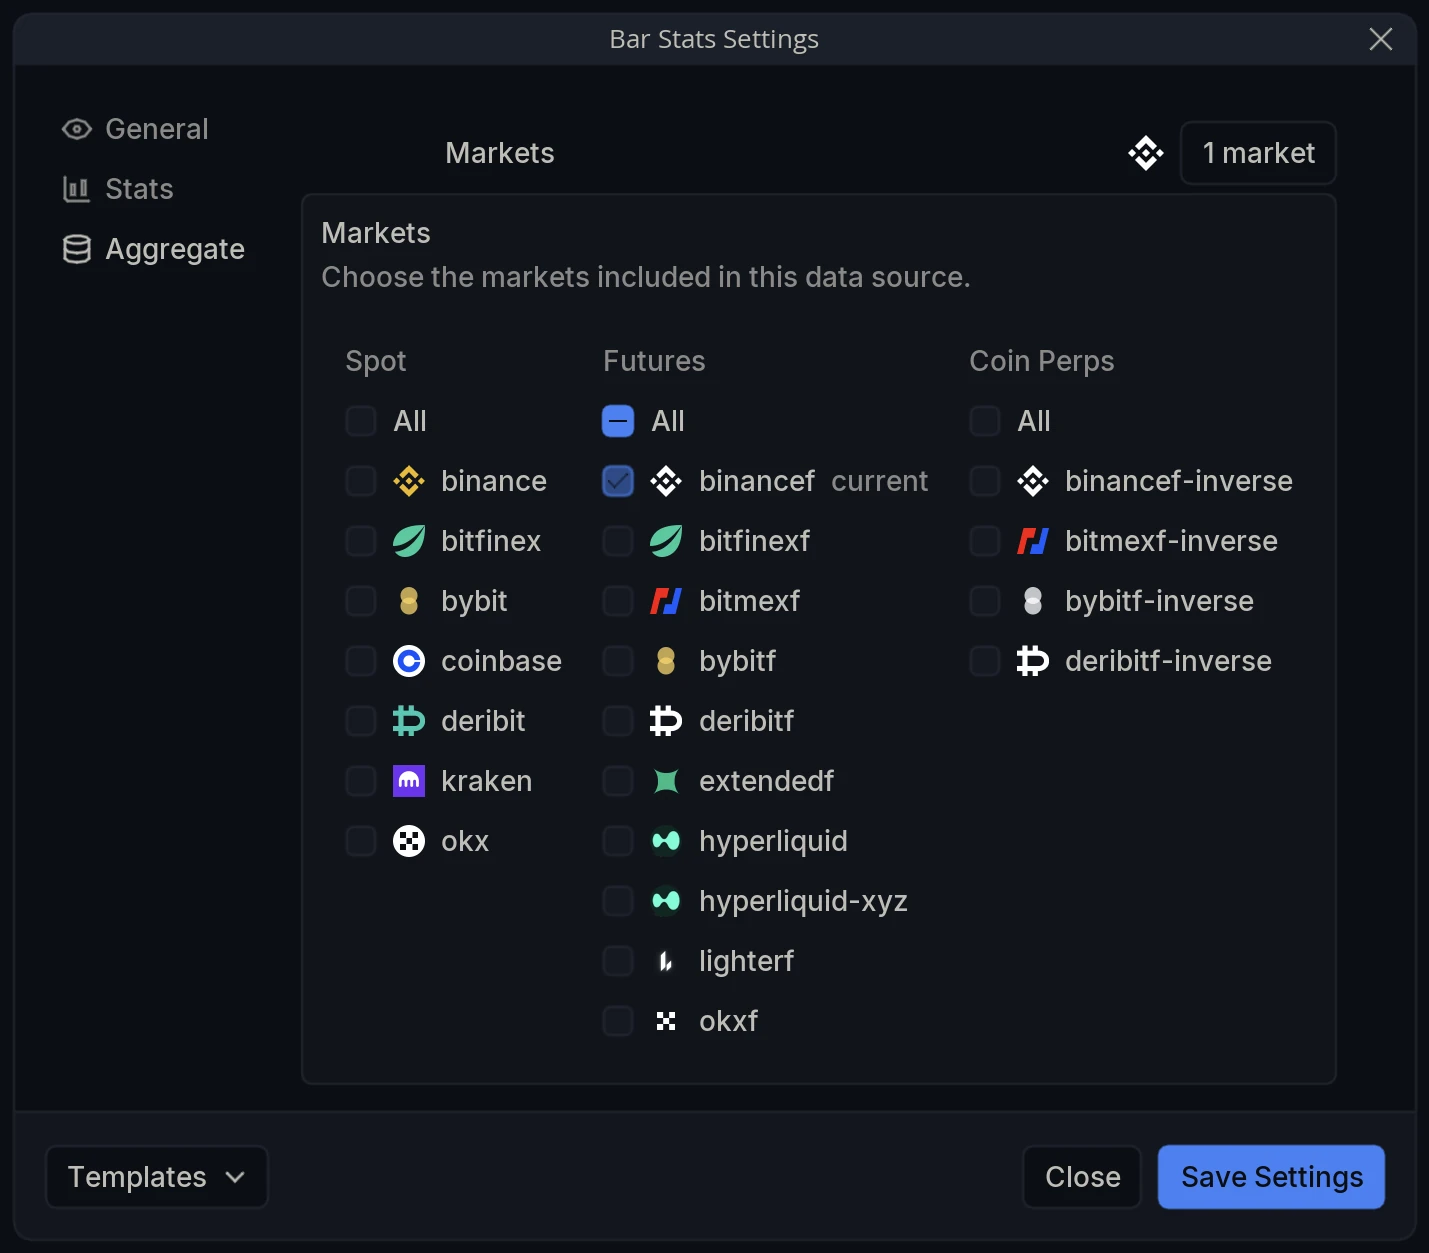
Markets - Choose the markets the figures are calculated from. The selector is grouped into Spot, Futures and Coin Perps, with an All toggle per group; your chart’s own market is tagged current.