What is volume in trading?
By MichaelUpdated August 24, 2026
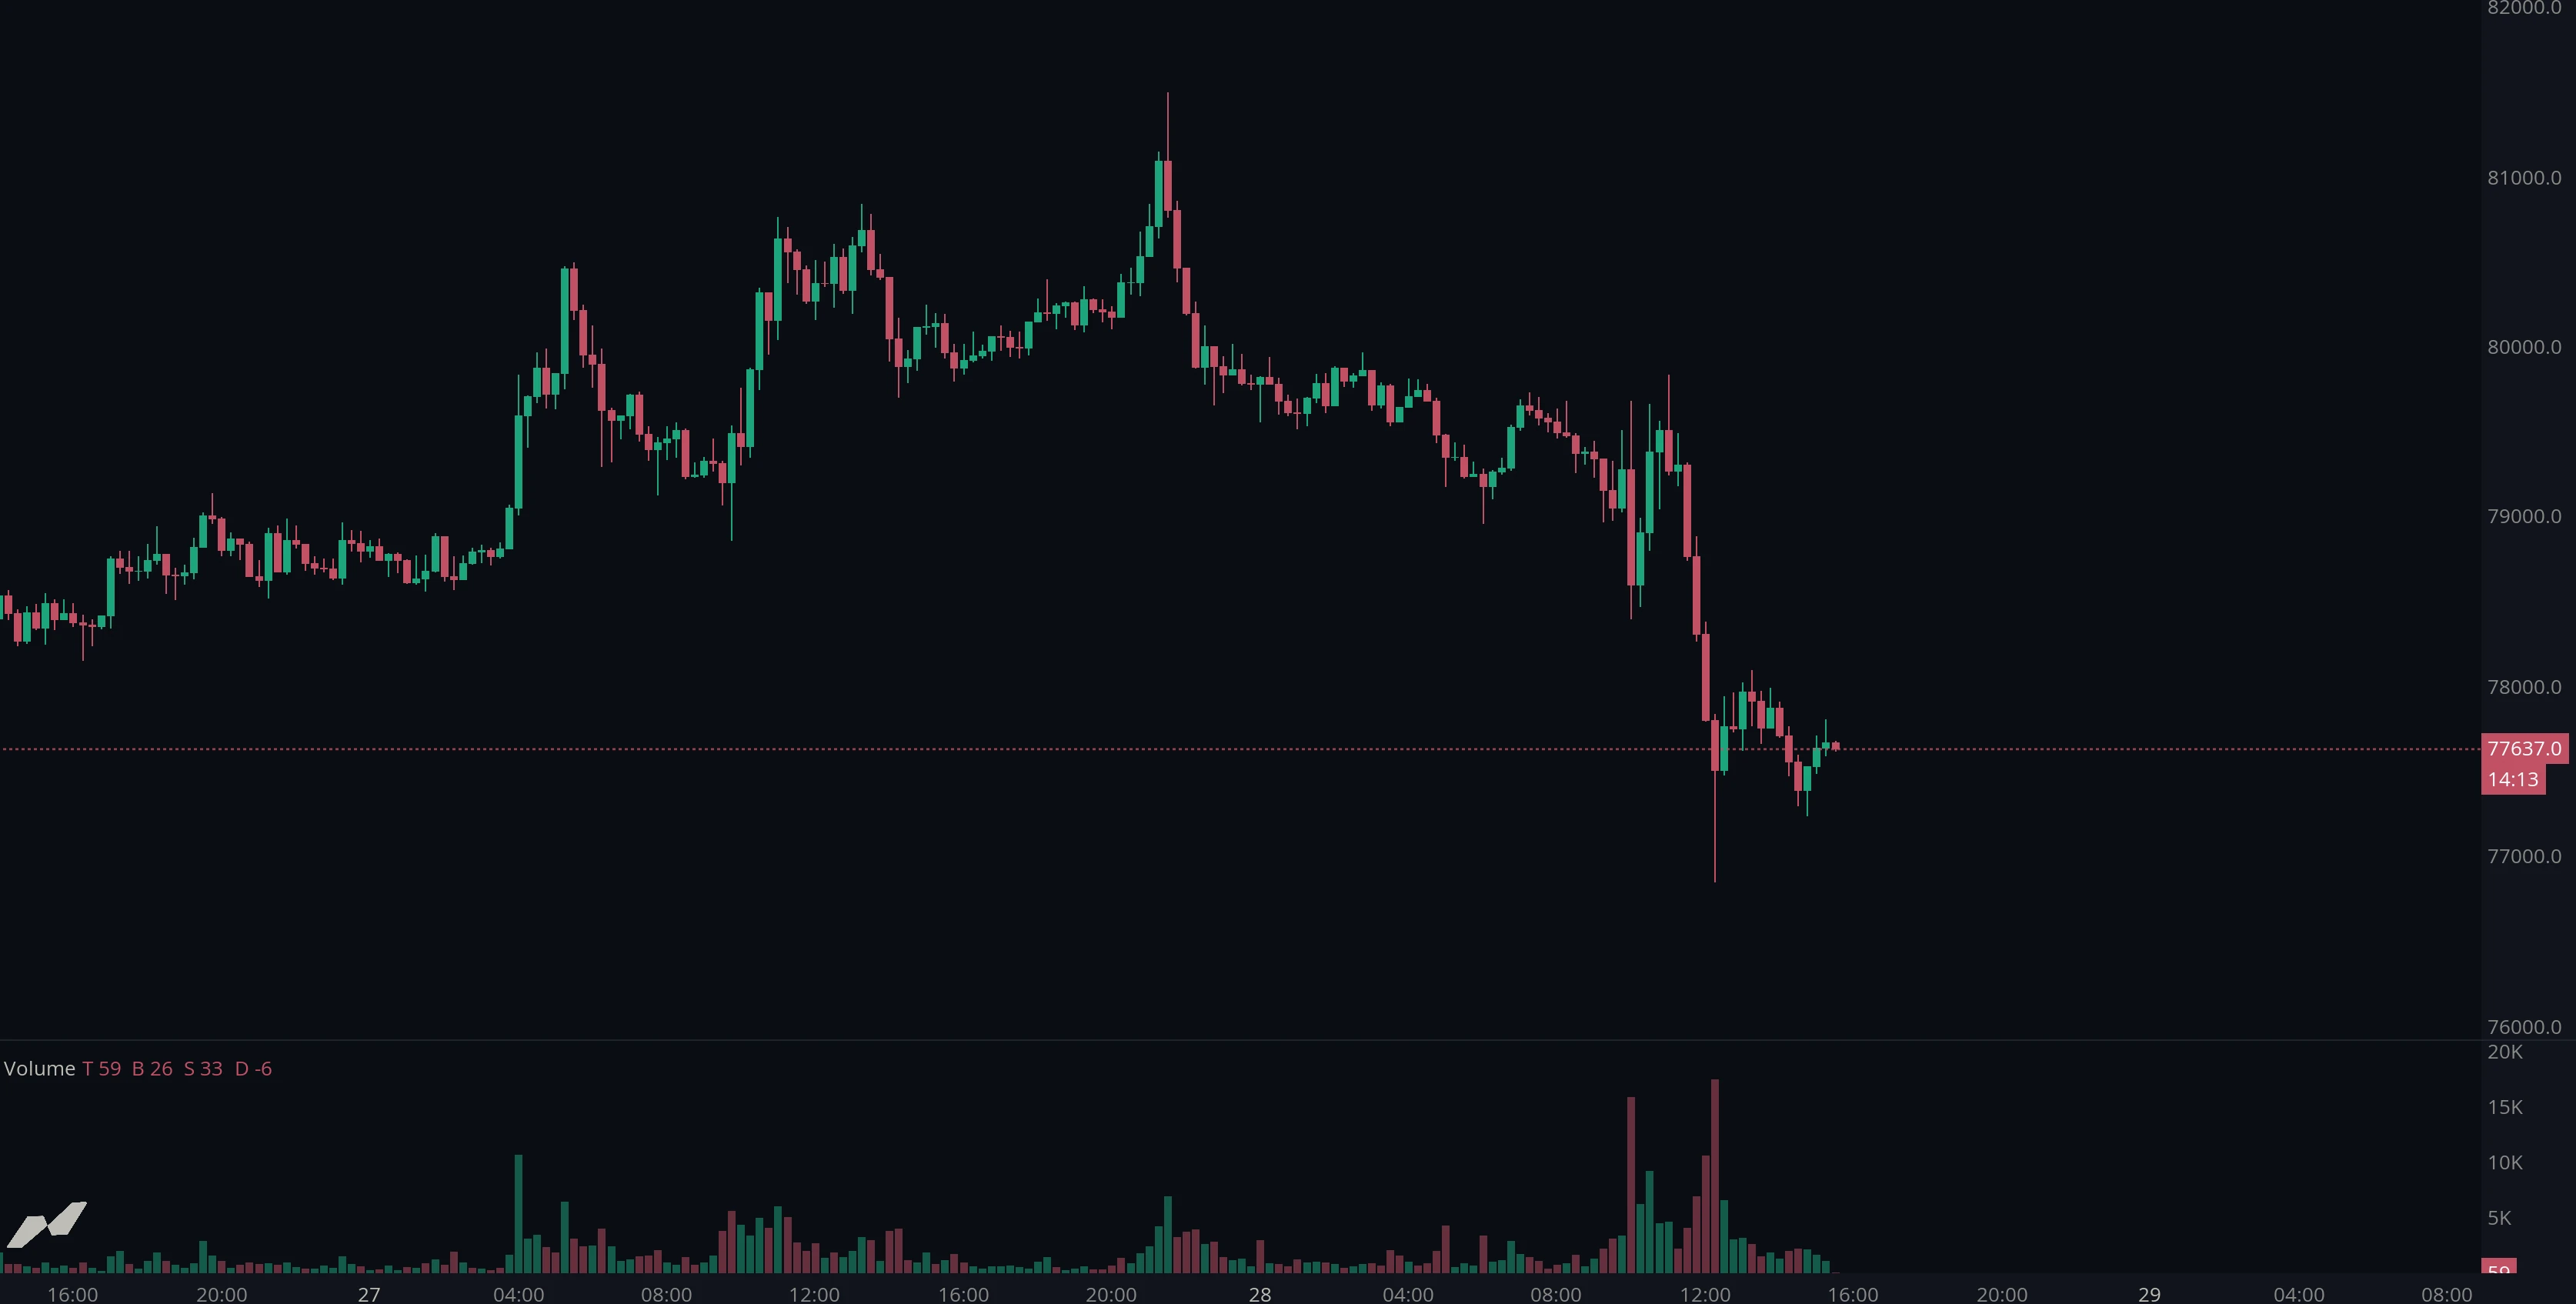
Trading volume is the total amount of an asset that changed hands during a given period. On a chart it is drawn as a histogram beneath price, with one bar per candle: the taller the bar, the more was traded while that candle formed.
How does volume work?
Every trade requires a buyer and a seller. Volume counts the size that passed between them, so it measures participation rather than direction: how much business the market did, not where it went.
That makes volume the natural companion to price. A move on heavy volume means many participants took part, and the price change reflects broad agreement about a new level. The same move on light volume means few did, and the change rests on much thinner conviction. Neither is good or bad on its own, but they carry very different weight.
Volume is also the cleanest measure of engagement over time. Markets have quiet hours and busy ones, quiet weeks and violent ones, and the histogram shows that rhythm directly. Traders watch for volume that departs from its recent norm, because unusual participation tends to accompany the moments that matter: breakouts, reversals, capitulation, and the tests of support and resistance where one side finally gives way.
How do you read a volume histogram?
Read each bar relative to its neighbours rather than in absolute terms. A bar means little on its own; what carries information is whether it is larger or smaller than the bars around it.
Rising volume into a move suggests the move is being driven by real participation and has a reasonable chance of continuing. Falling volume during a move suggests the opposite: the trend is running on fewer and fewer participants, which often precedes a stall. A single outsized bar marks a moment when something happened - news, a liquidation, a level breaking - and is worth locating on the price chart to see what.
The most watched relationship is between volume and levels. Price approaching support or resistance on heavy volume shows both sides are engaged and the level is being genuinely contested. Price drifting into the same level on light volume shows nobody is defending it strongly.
What is buy and sell volume?
Total volume answers how much traded, but not who was in a hurry.

Every trade has a buyer and a seller, so counting both sides simply doubles the total. What can be separated is aggression: whether each trade happened because a buyer crossed the spread to hit the offer, or a seller crossed it to hit the bid. Splitting volume that way produces buy volume and sell volume, and the balance between them shows which side was willing to pay up.
What is volume delta?
Volume delta is the net difference between buy volume and sell volume: aggressive buying minus aggressive selling.
Where total volume tells you how much business was done, delta tells you which side did more of it. A candle can close higher on balanced delta, meaning the move happened without one side dominating, or close flat on strongly negative delta, meaning heavy selling was absorbed without price giving way. Those two readings say very different things about the same bar.
Delta is most useful where it disagrees with price. Price making a new high while delta shrinks suggests the move is being carried by fewer aggressive buyers than the last one; a heavy negative delta at a level that holds suggests sellers hit it hard and failed.
When should you use volume?
Volume works best as confirmation rather than as a signal in its own right. It answers “how much conviction was behind this?” about a move you have already identified, and it is at its most valuable at moments of decision: breakouts, retests, and reversals.
Its limits are worth knowing. Crypto volume is exchange-specific, so a figure only describes the venue reporting it. Volume also says nothing about where inside the candle the trading occurred, which is what a volume profile is for, and nothing about the resting orders that were never filled, which is what an order book heatmap shows.
Related: Volume Profile Visible Range (VPVR) · CVD (Cumulative Volume Delta) · Order book heatmap
Using the volume layer in MMT
MMT’s volume layer separates market buy and market sell volume for every candle rather than reporting a single total, which is what makes the delta view possible. It sits in its own pane beneath the price chart and offers two modes.
What is Delta Highlight mode?
Delta Highlight draws two bars per candle, one inside the other.
The darker background bar is total volume: all buying and selling combined, so its height matches what a conventional volume histogram would show. The brighter foreground bar is the delta, so its height shows how much of that total was one-sided. The color reports which side won, green where aggressive buying exceeded selling and red where selling exceeded buying.
The result reads on two levels at once. Bar height tells you how much traded; the proportion of bright to dark tells you how lopsided it was. A tall bar that is almost entirely dark is heavy two-way business with no clear winner. A shorter bar that is almost entirely bright is a smaller amount of trade that went overwhelmingly one way.

What is Standard mode?
Standard mode draws the conventional histogram: one bar per candle at the height of total volume, colored to match the candle’s direction - green where the candle closed up, red where it closed down.
It carries less information than Delta Highlight, which is the point. When volume is context for something else on the chart rather than the subject of study, the familiar shape is easier to read at a glance.
How do you add volume to a chart?
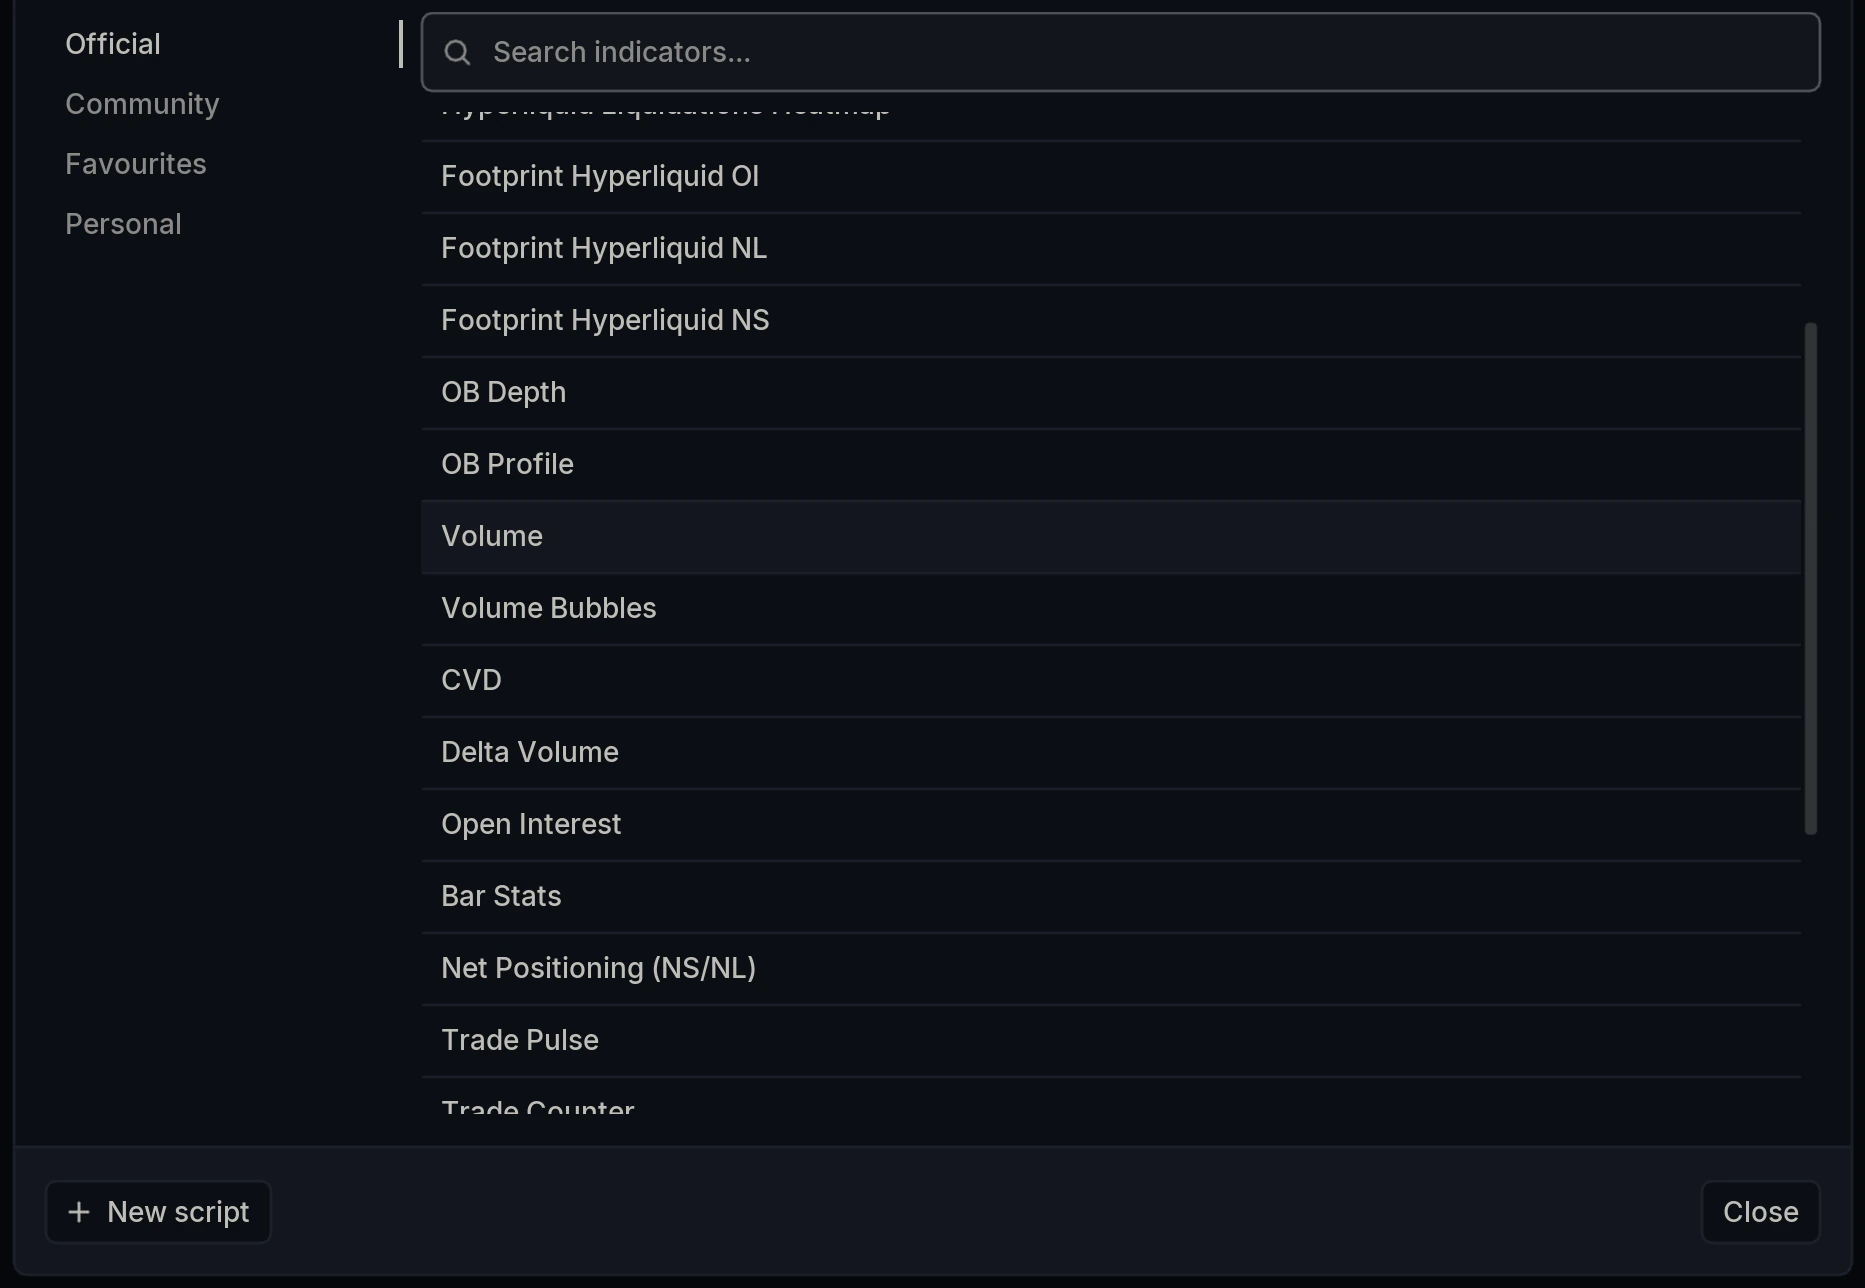
To add it manually, open the Indicators dialog and select Volume under Official. It anchors in its own pane beneath the price chart.
Layer Settings
Open Volume Settings via the cog wheel on the layer name. The panel has three tabs: Price Marker, Display and Aggregate.
Price Marker
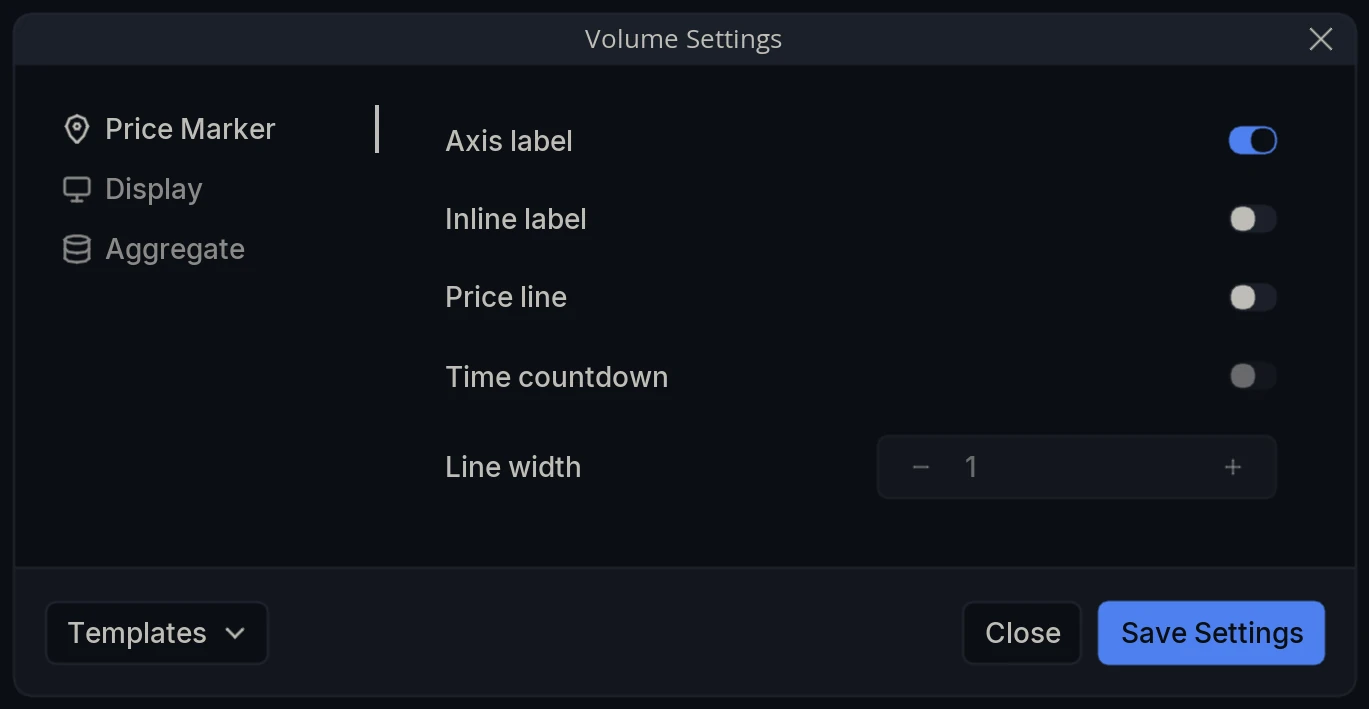
Axis label - Show the current volume value as a label on the pane’s axis.
Inline label - Show that value on the pane itself rather than on the axis.
Price line - Draw a horizontal line across the pane at the current value.
Time countdown - Show the time remaining until the current candle closes.
Line width - Thickness of that line.
Display
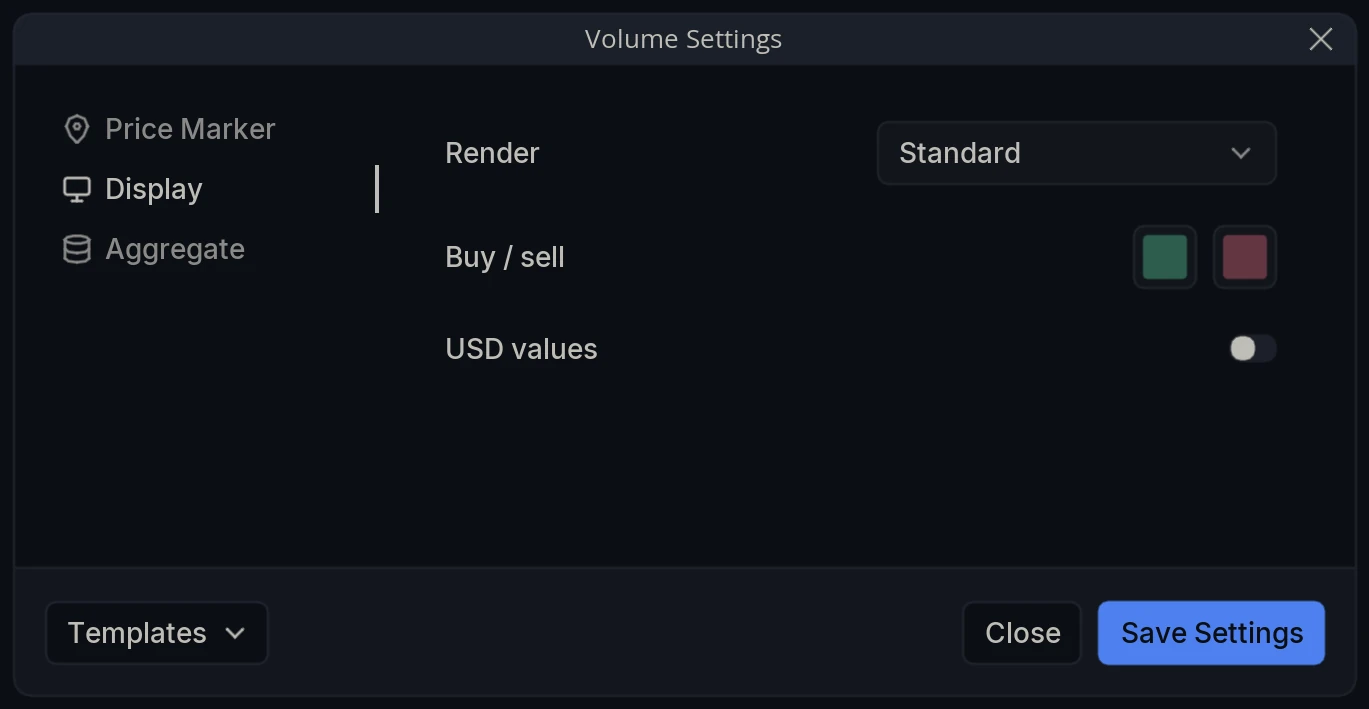
Render - How each bar is drawn: Standard or Delta Highlight.
Buy / sell - The two colors used for buy and sell volume.
USD values - Report volume in USD rather than in units of the base asset. Useful when comparing markets whose base assets have very different unit prices.
Aggregate
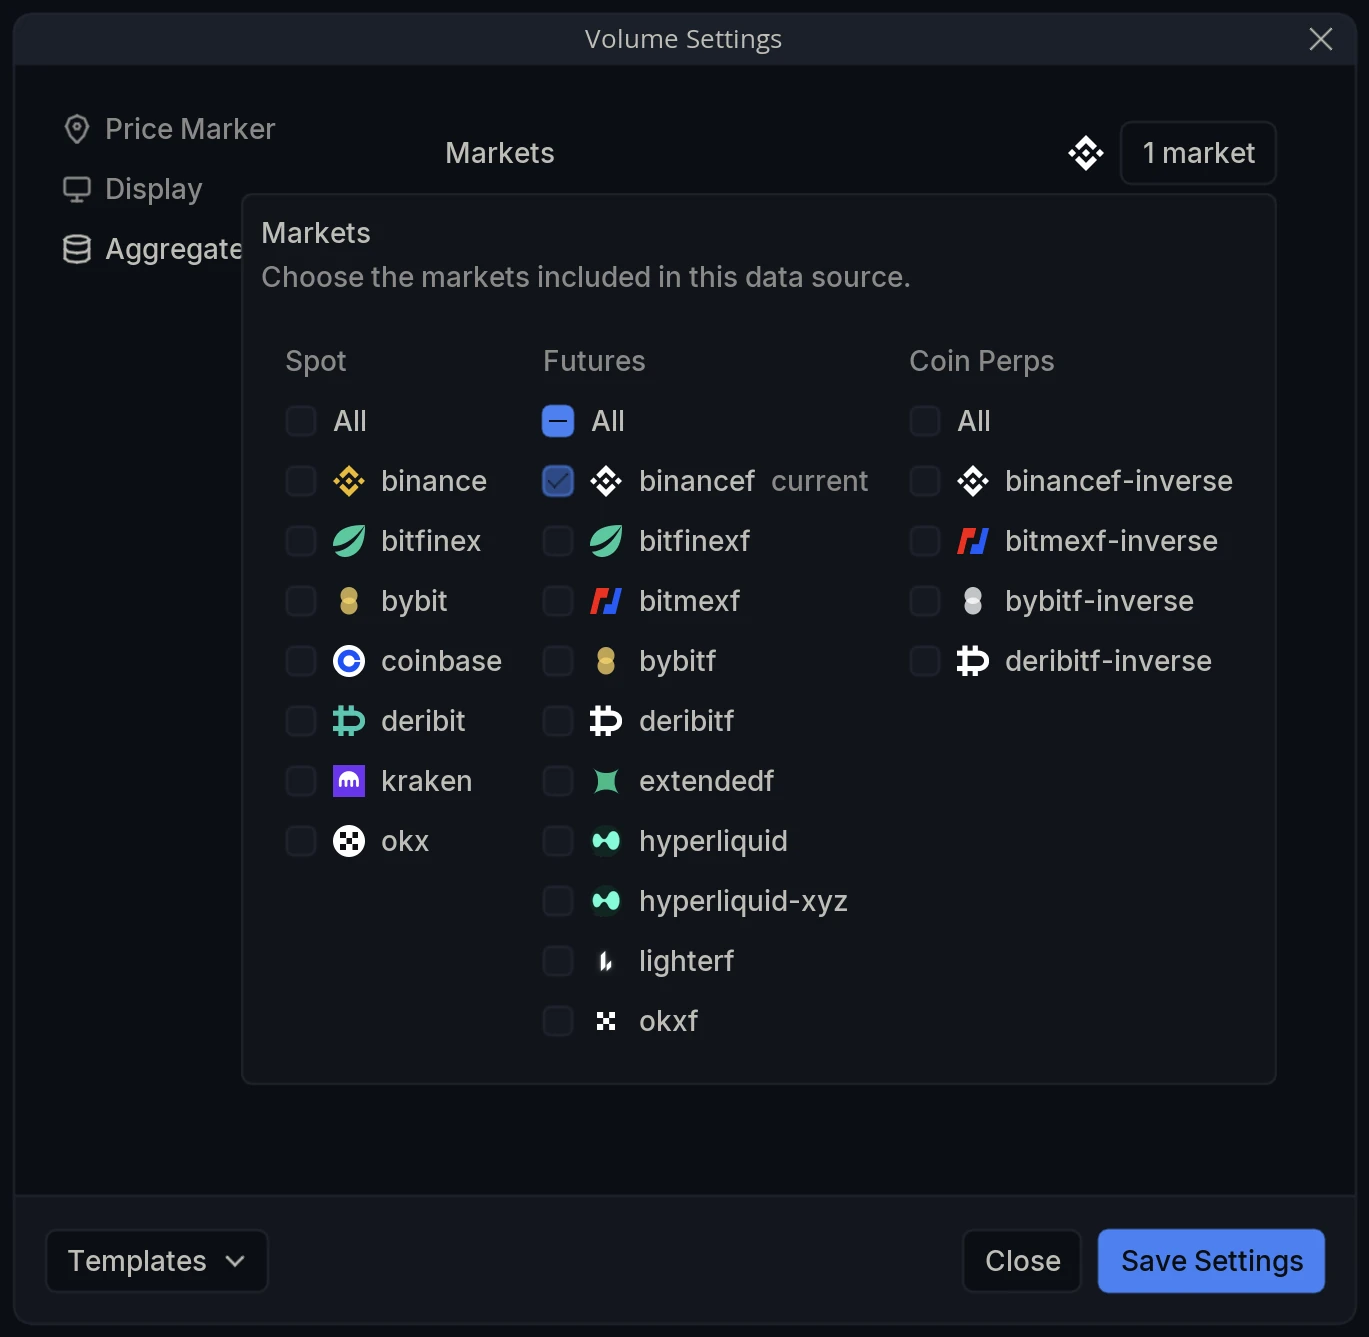
Markets - Choose the markets whose volume is counted. Clicking the market count opens a selector grouped into Spot, Futures and Coin Perps, with an All toggle per group; your chart’s own market is tagged current. Because crypto volume is exchange-specific, combining venues gives a fuller picture of how much actually traded than any single book reports.