What is a TPO market profile?
By MichaelUpdated August 24, 2026
A TPO (Time Price Opportunity) market profile is a chart that shows how long a market traded at each price during a session. Time is divided into equal periods, and every price touched in a period is recorded, building a horizontal distribution in which the longest rows mark the prices the market accepted most.
How does a TPO market profile work?
A trading session is split into fixed periods, thirty minutes by convention. In each period, every price level the market trades is recorded and given one mark — historically a letter, A for the first period, B for the second, and so on. Those marks are stacked sideways from the start of the session, so a price traded in many periods grows a long row, while a price traded once stays a single mark wide.
The resulting shape describes the session. A wide bulge shows where the market spent most of its time and found agreement; the narrow extremes show prices it visited briefly and left. Traders use the profile to separate acceptance from rejection: a market that lingers at a price has accepted it, and one that leaves immediately has rejected it. That distinction is invisible on a candlestick chart, which records where price went but not how long it stayed.
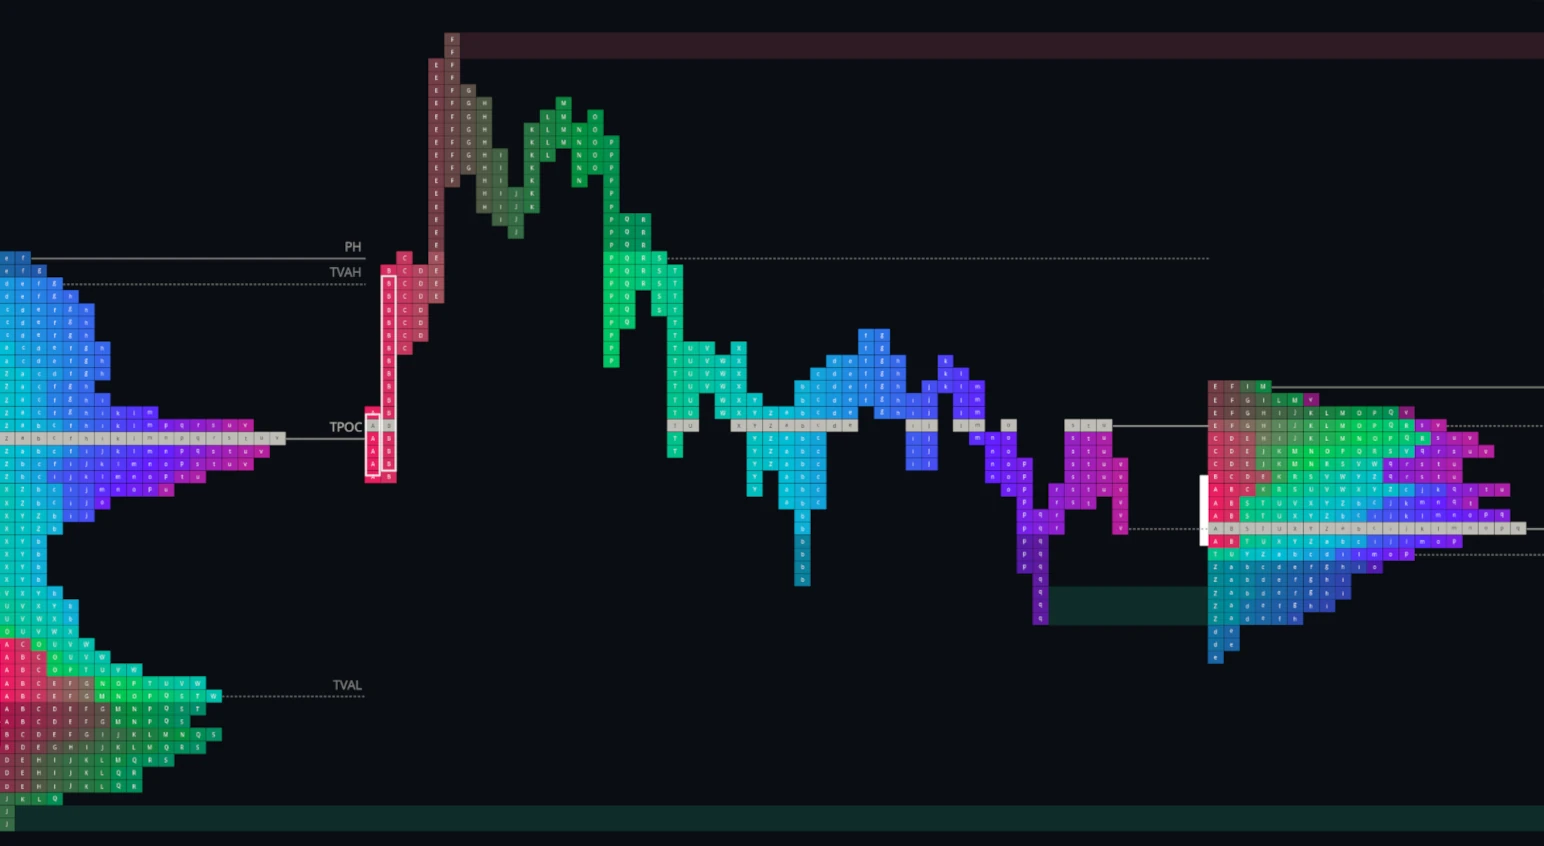
The method was developed by J. Peter Steidlmayer at the Chicago Board of Trade in the 1980s, and the structures it produces — the point of control, the value area, the initial balance — remain the standard vocabulary of auction market theory.
How is a TPO profile built?
The session is divided into equal blocks of time. During each block, every price level the market trades is recorded and assigned one block, so a single period produces a vertical run covering that period’s range - the more the market moved, the taller the run.
Each period is identified by a letter, which is why a market profile printed on paper looks like a page of stacked letters. The letters are not decoration: they tell you when during the session a price was traded, which is what lets you read a profile as a story rather than a static shape.
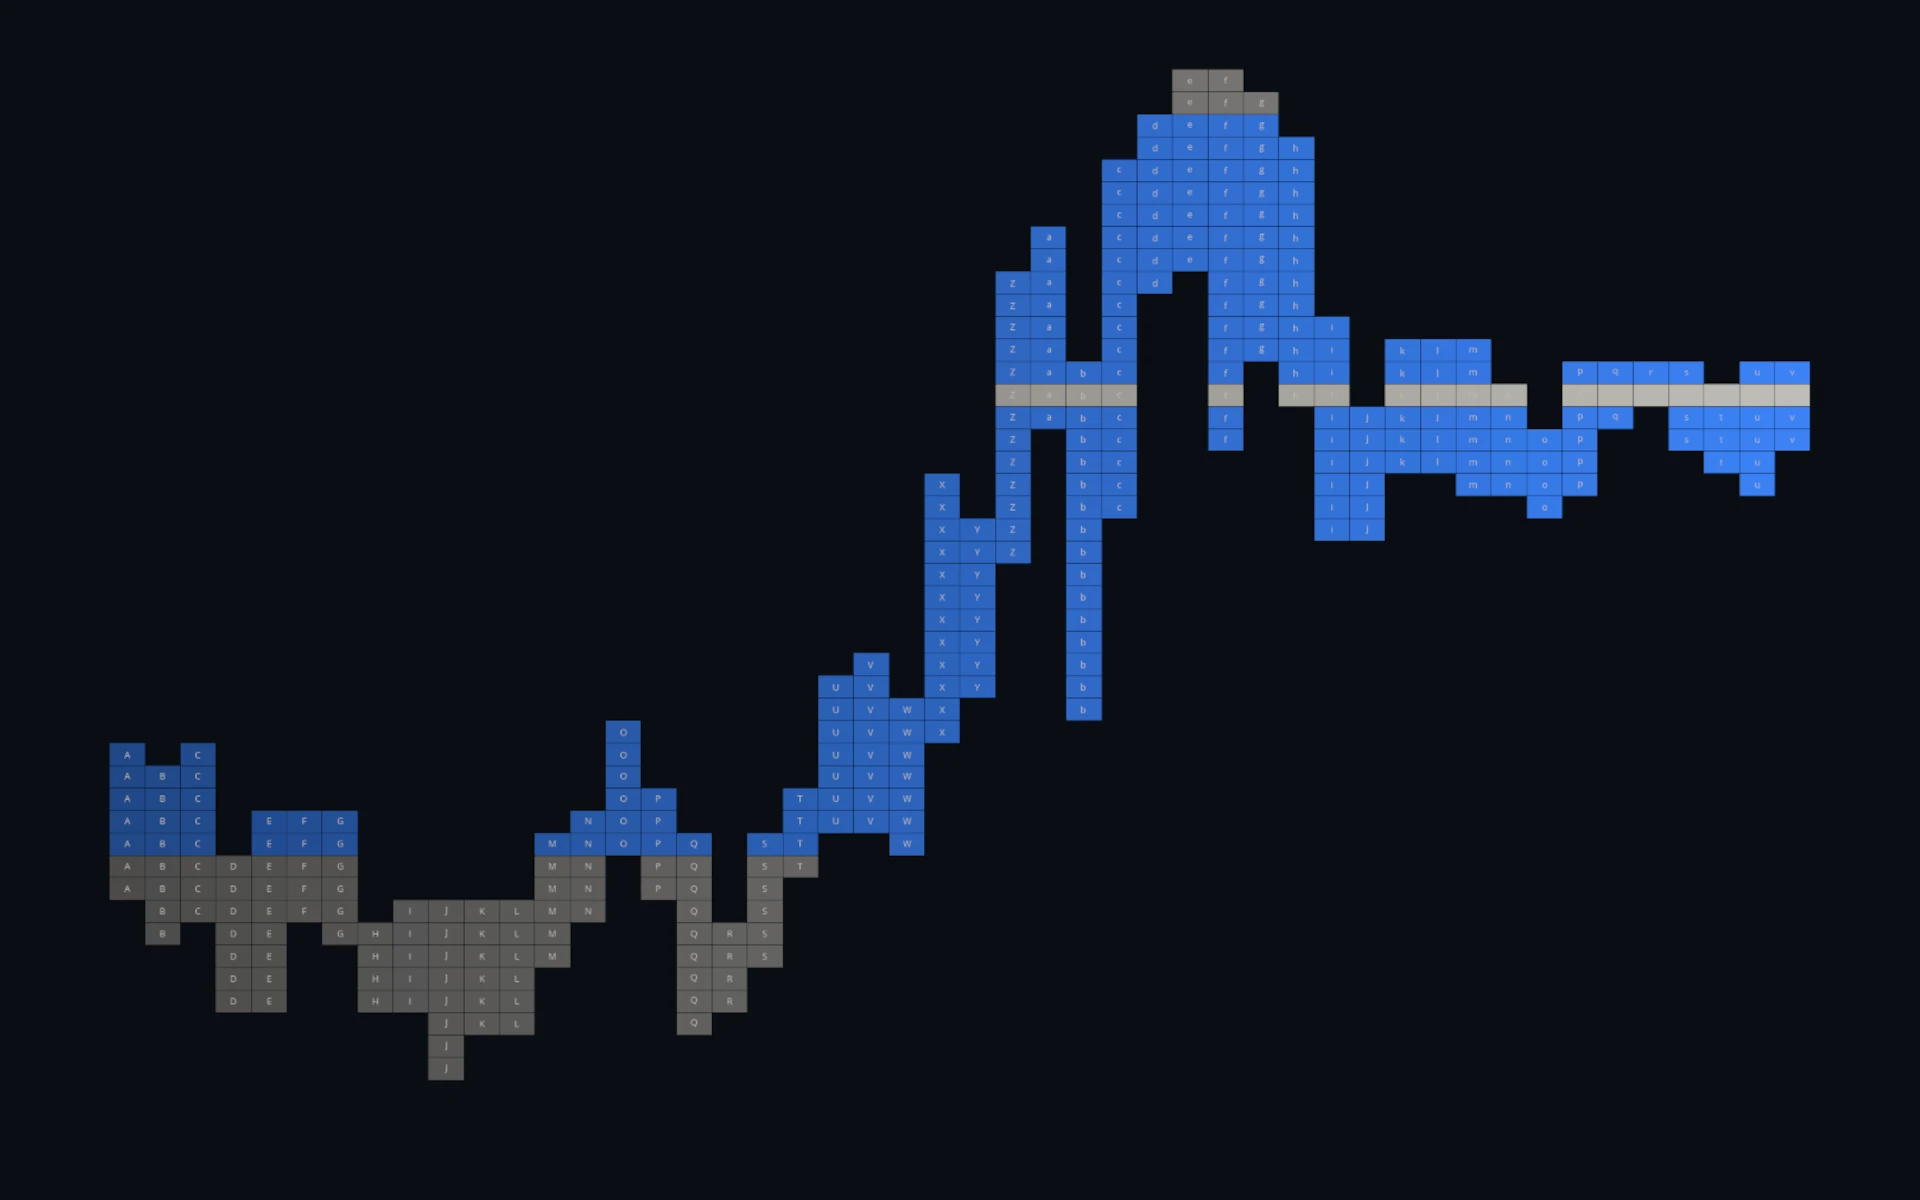
Each new period’s blocks are then pushed leftward against the ones already there, filling the first free column at every price level. Levels traded in many periods accumulate blocks and grow into long rows; levels traded in only one period stay one block wide.
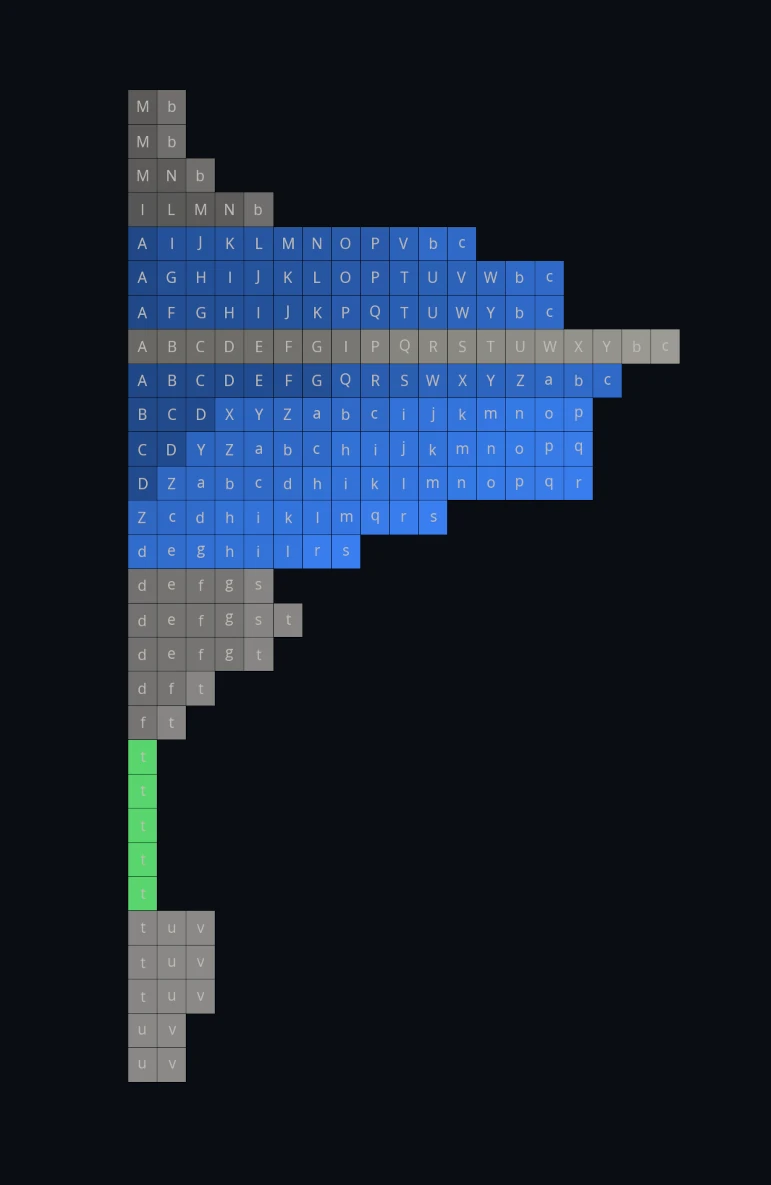
That shape is the point of the tool. A fat, symmetrical profile is a market that spent the session rotating around an agreed price - balance. A thin, stretched profile with the bulge at one end is a market that spent the session going somewhere - imbalance.
What is the point of control (POC)?
The point of control is the price with the most blocks - the longest row in the profile, and therefore the level at which the market spent more time than any other. Where several rows tie for longest, the POC is conventionally the one nearest the midpoint between the session’s high and low.
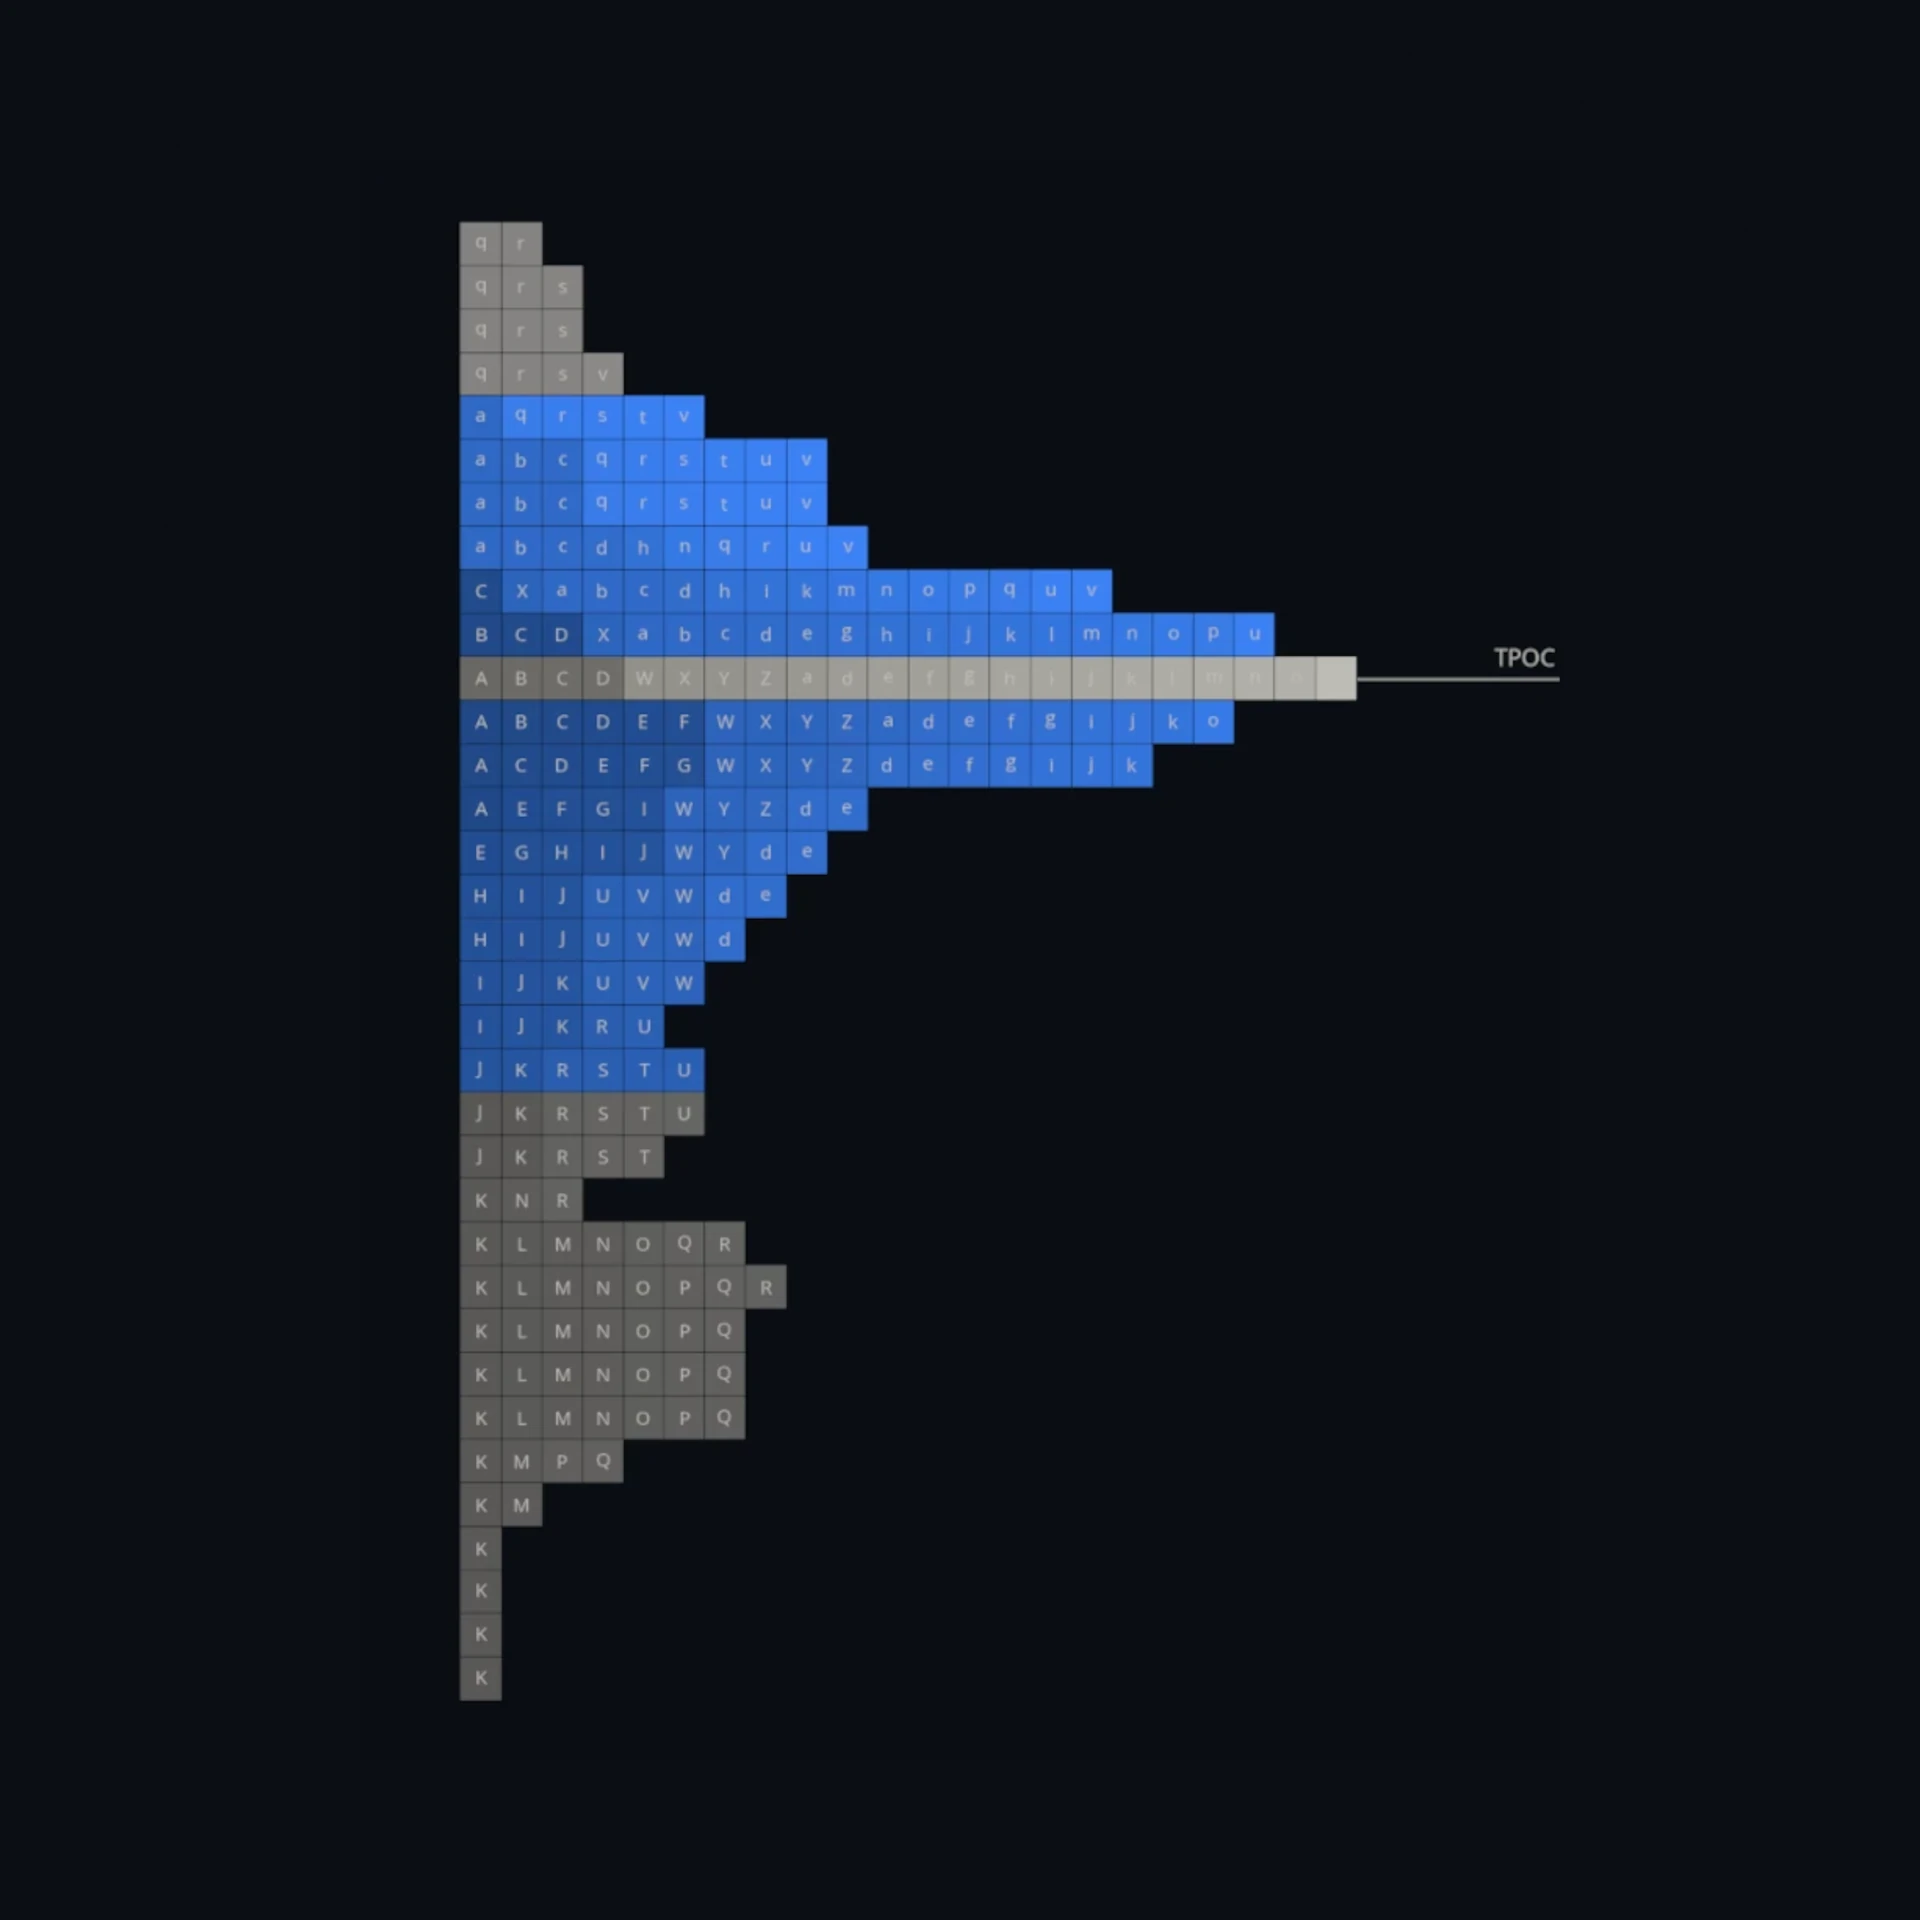
It marks the price the market most agreed on during that session. When price returns to a previous session’s POC it is returning to a heavily accepted level, and markets frequently pause or react there.
What is the value area (VAH and VAL)?
The value area is the range containing the bulk of a session’s activity, 70% of all blocks by convention. It is calculated outward from the POC: the rows immediately above and below are compared, the larger is added, and the process repeats until the target percentage is reached. The top of that range is the value area high (VAH); the bottom is the value area low (VAL).
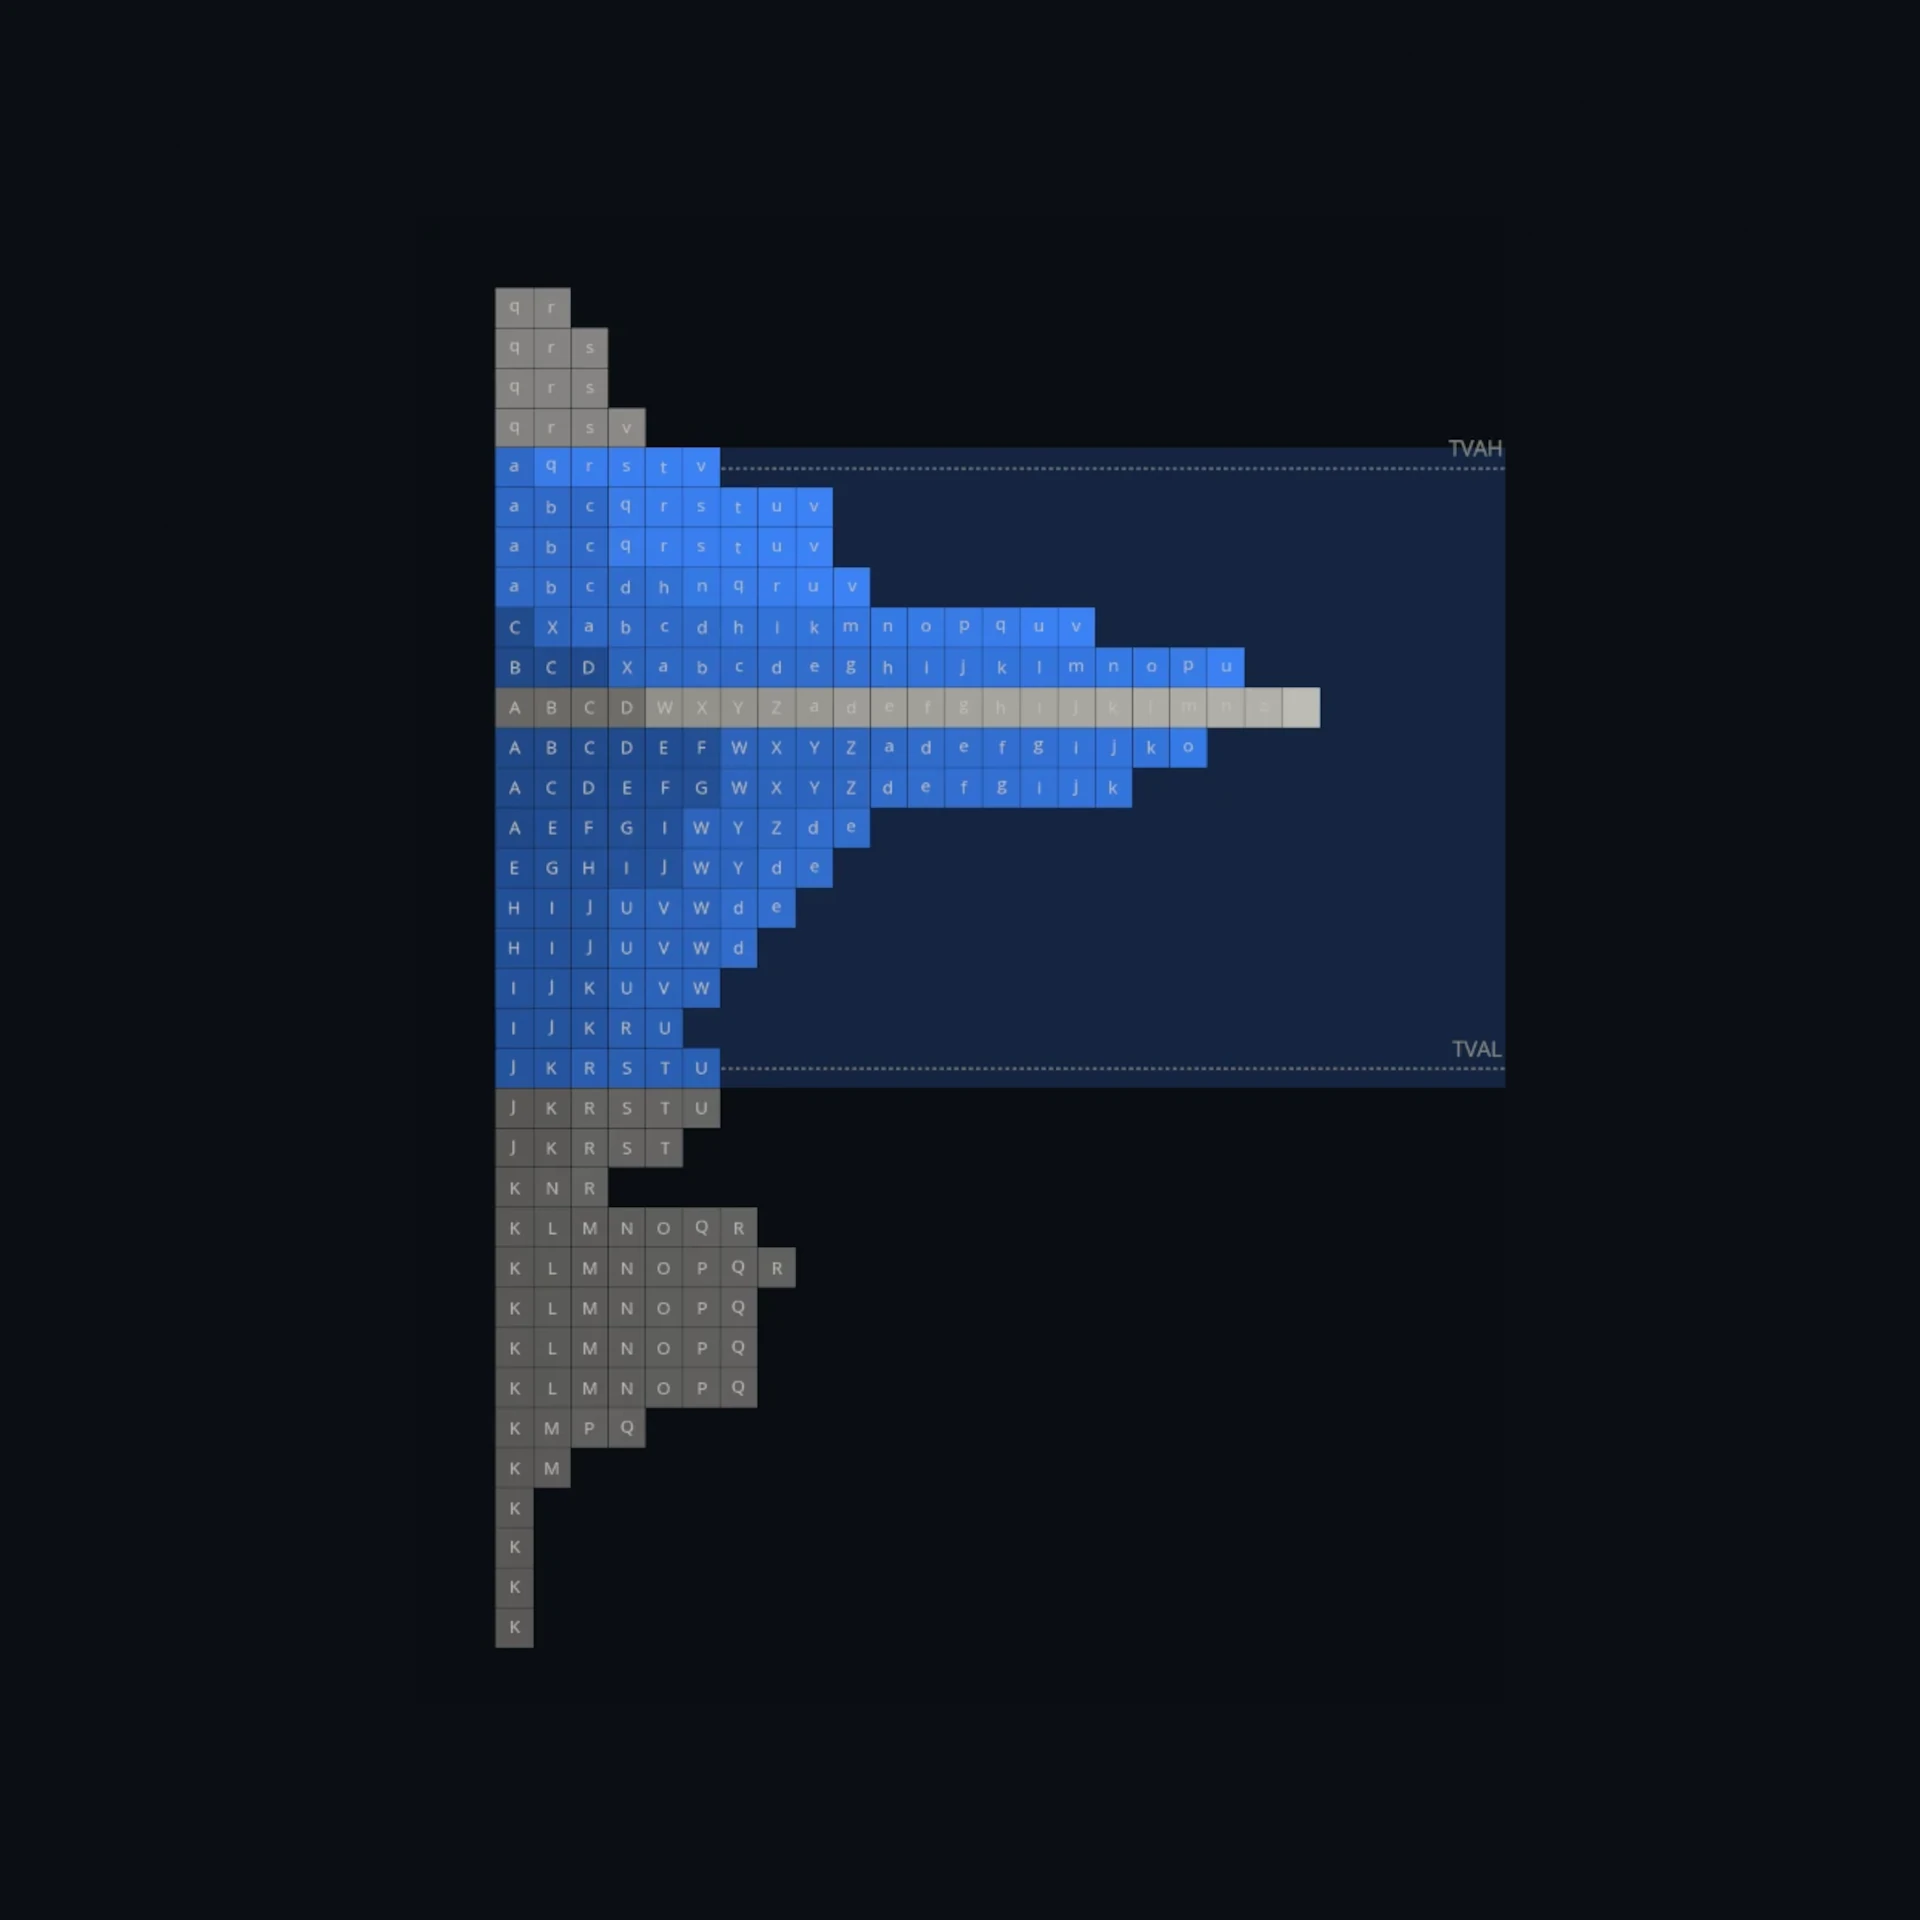
The value area is where the market did most of its business, and its edges matter more than its middle. Price accepted back inside a prior value area suggests the market agrees with that valuation again; price rejected at VAH or VAL suggests it does not.
What is the initial balance?
The initial balance is the range established in a session’s opening blocks - two by convention, which at a thirty-minute block size is the traditional first hour. It represents the market’s opening attempt to find a fair range before the wider session participates.
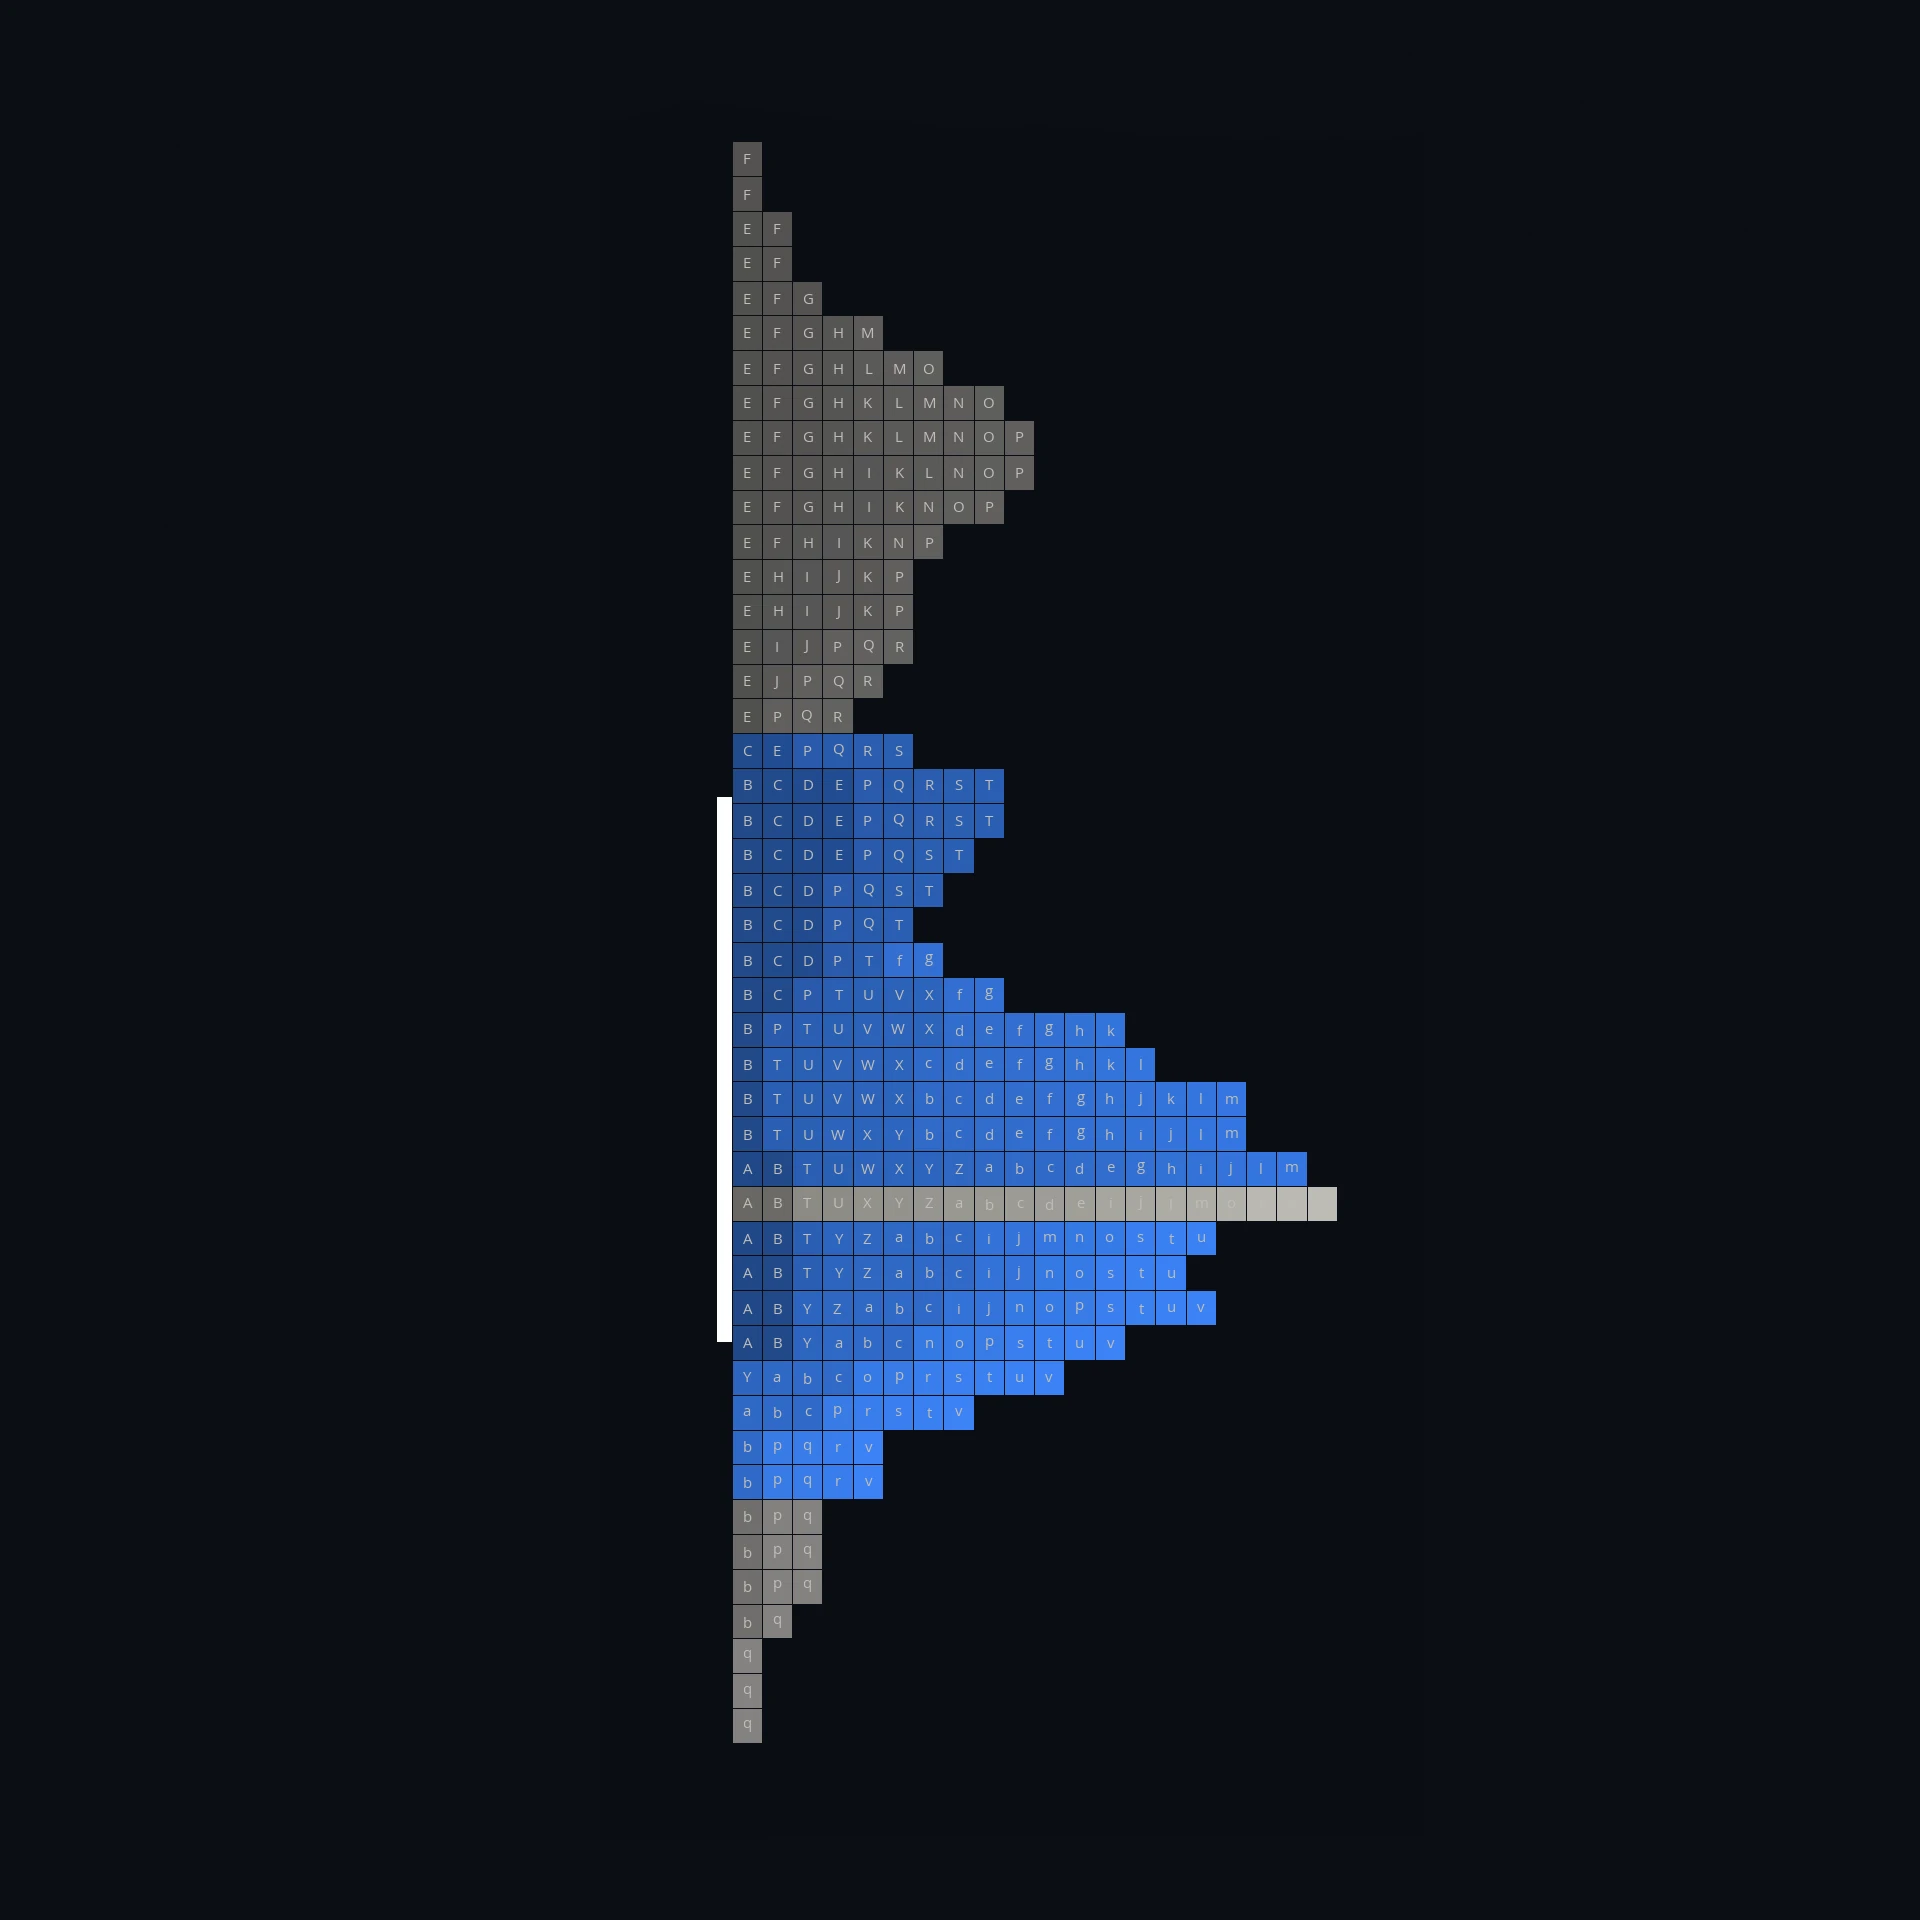
What matters is what happens to it. A session that spends the day inside its initial balance is balanced and rotational. A session that breaks out and extends - a range extension - is one where later participants disagreed with the opening valuation strongly enough to move the market.
What are single prints?
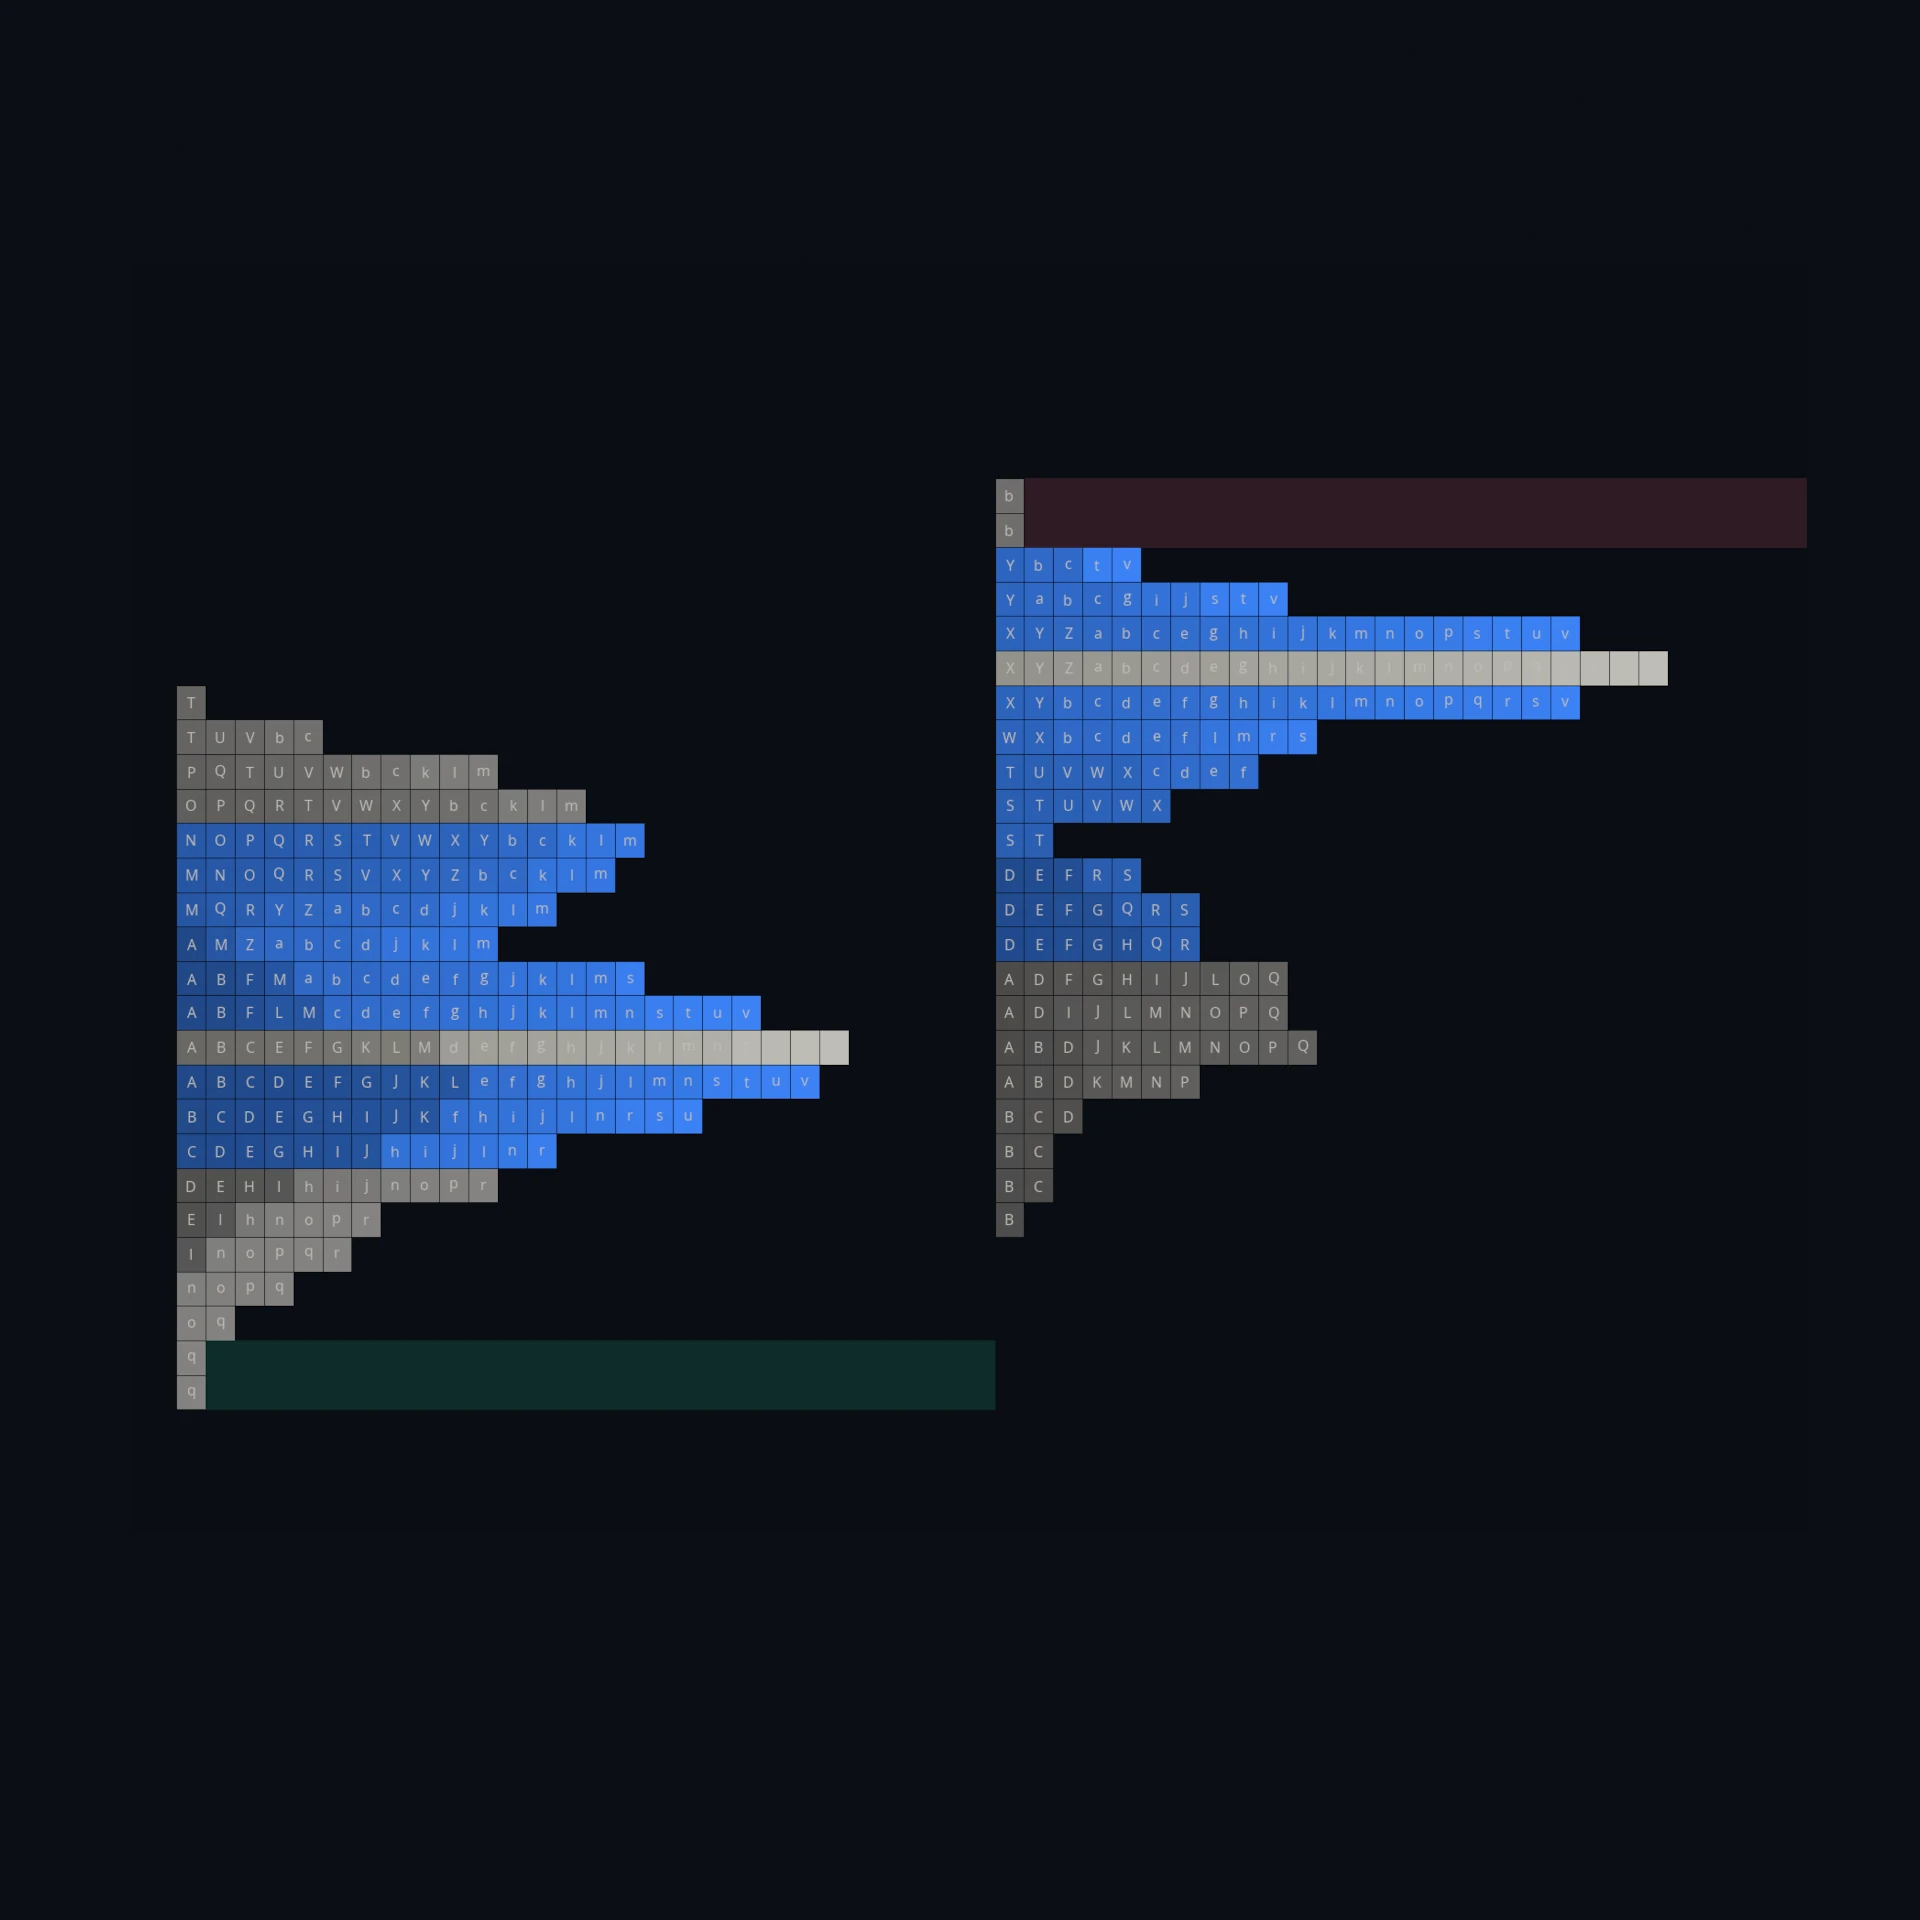
A single print is a price level with only one block - a level the market traded in exactly one period and never returned to. Single prints mark moves so fast that the auction had no time to do business on the way through, leaving a gap in the distribution rather than a fill.
They are read as unfinished business. Price that tears through a range without transacting leaves levels where buyers and sellers never met, and markets frequently return to complete that auction later.
One qualification matters: single blocks at the very top or bottom of a profile are not single prints in this sense - they are simply the extremes of the session’s range. A true single print has multiple blocks above and below it, leaving it isolated inside the distribution.
What are poor highs and poor lows?
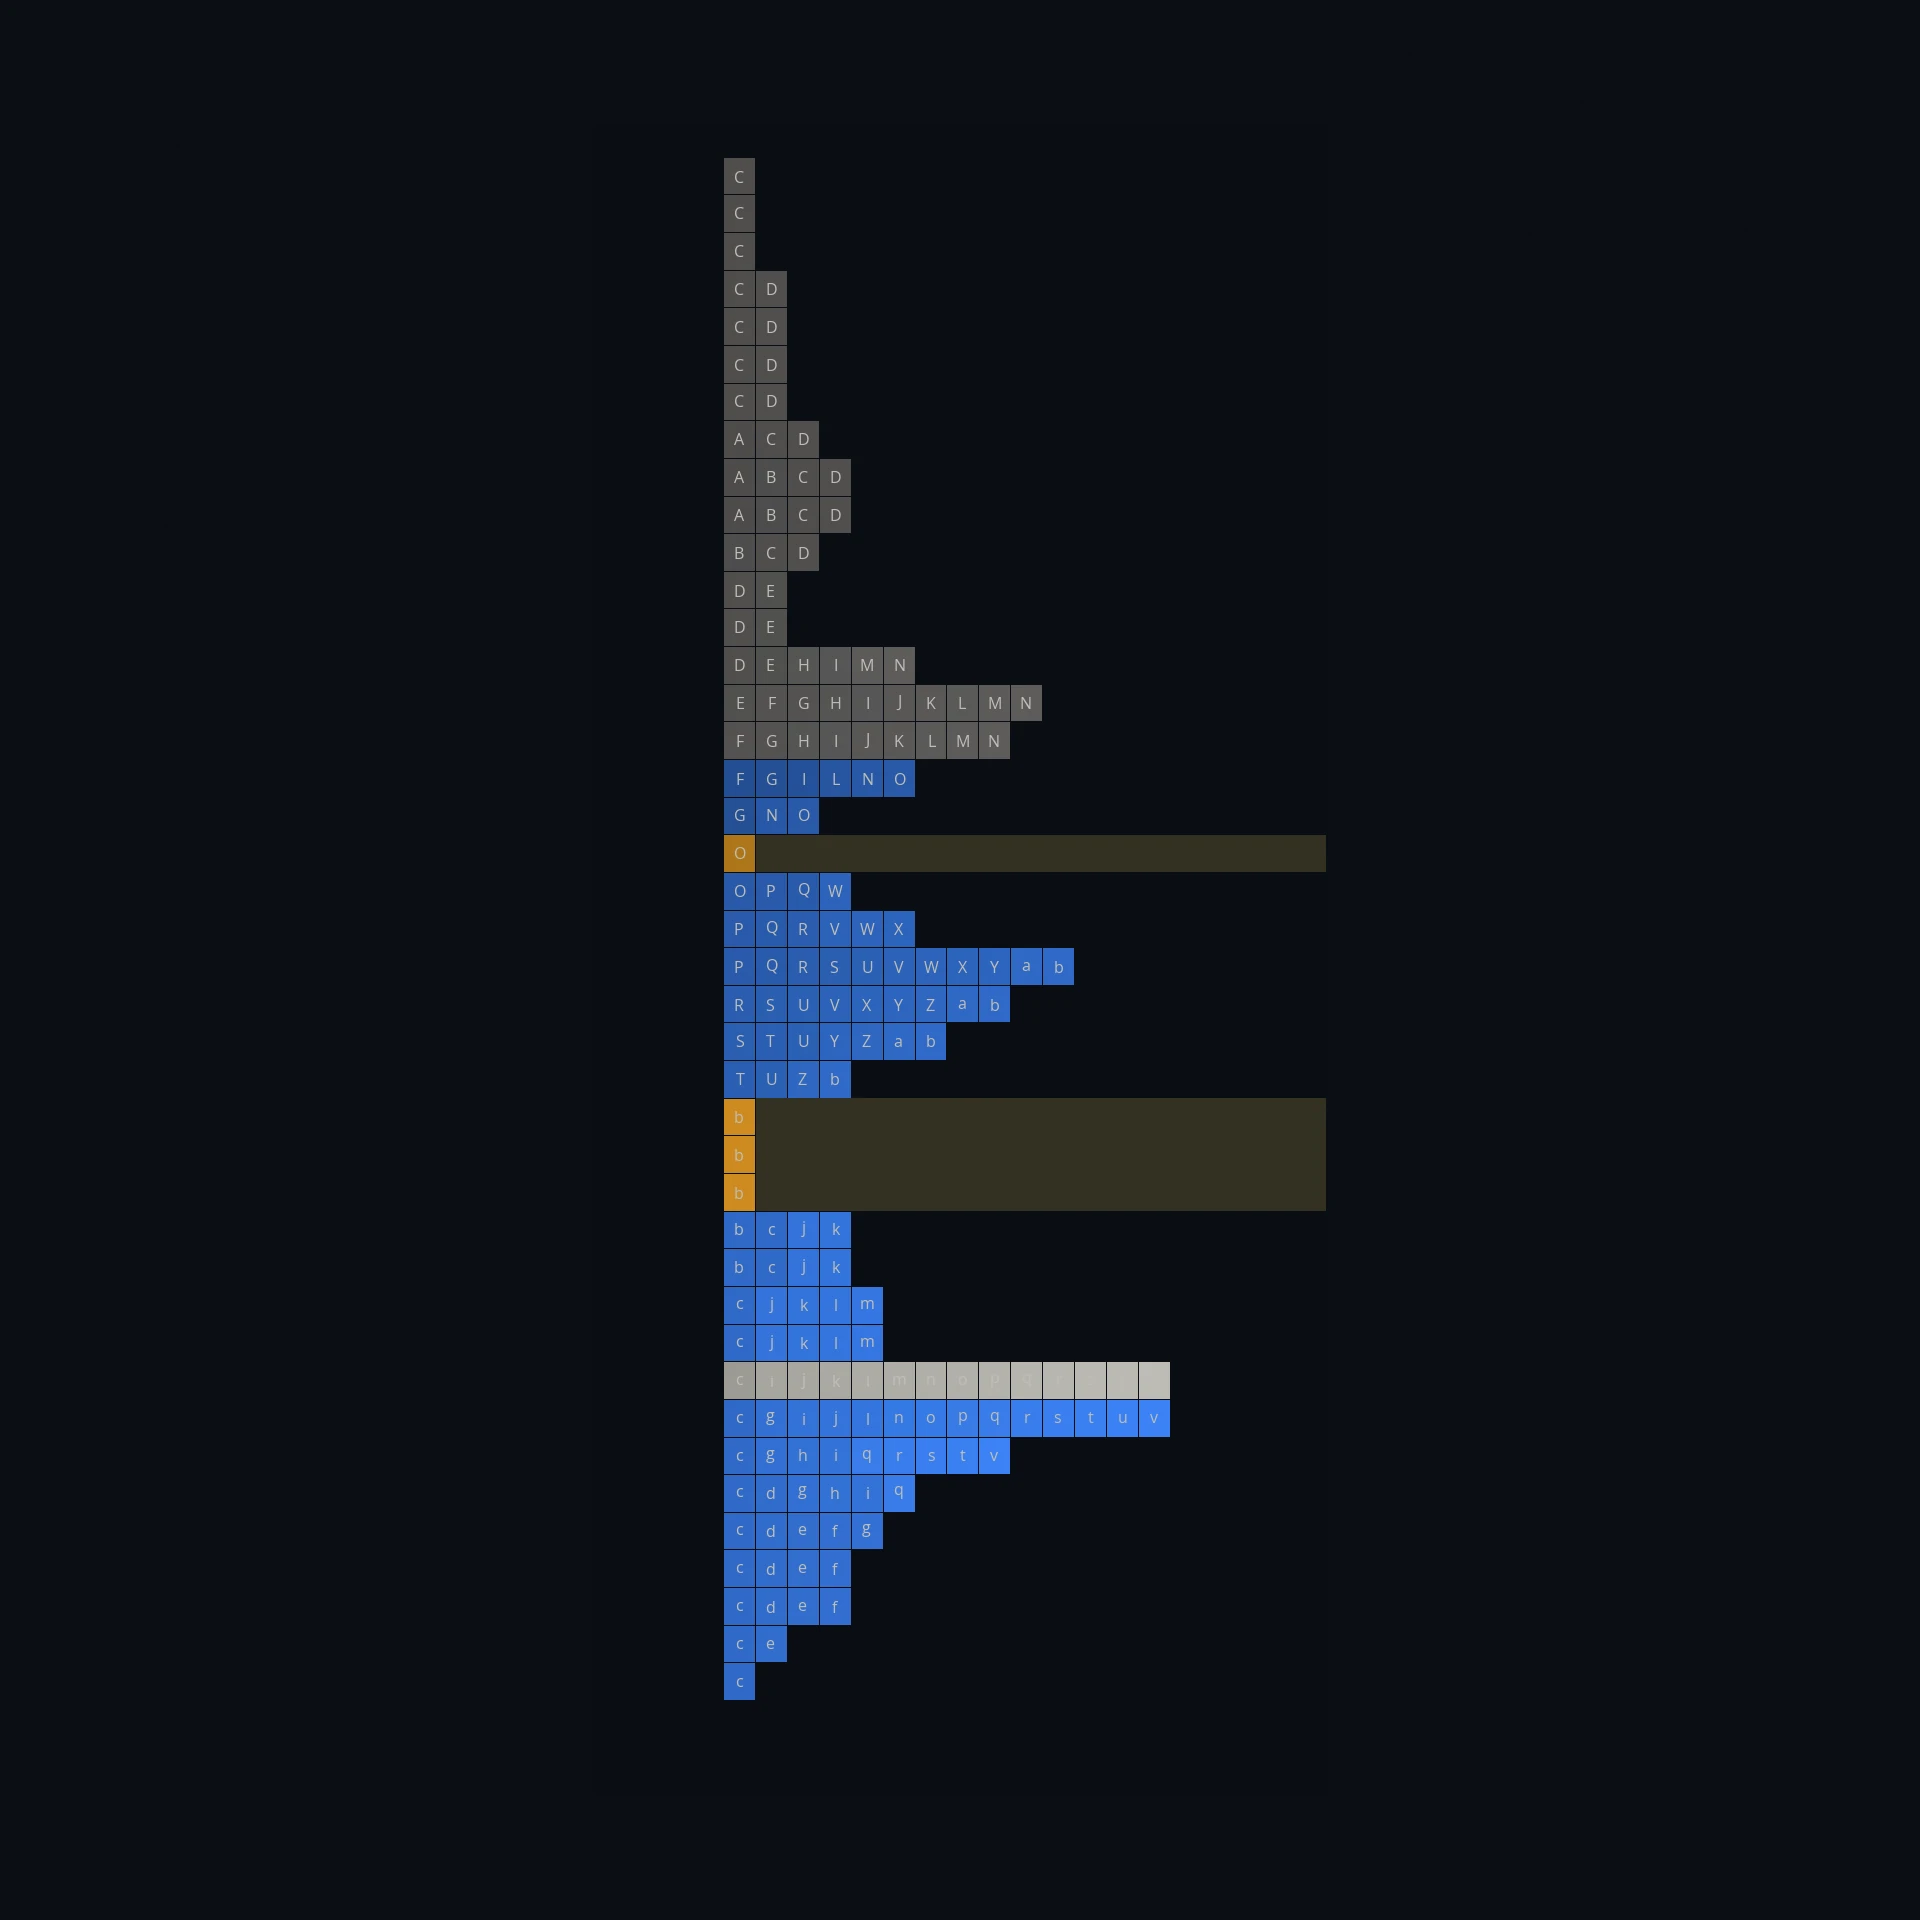
A poor high or poor low is an extreme where the market traded for more than one period - two or more blocks sitting flat at the very top or bottom of the profile.
The name reflects what it implies. A good high is made by a market that reaches up, finds no buyers and is rejected immediately, leaving a single tapering block. A poor high is one where price sat at the extreme transacting, without either being rejected or breaking through - an auction that stalled rather than finished. Because the move was never resolved, poor extremes are commonly revisited and repaired later.
What is a tail on a market profile?
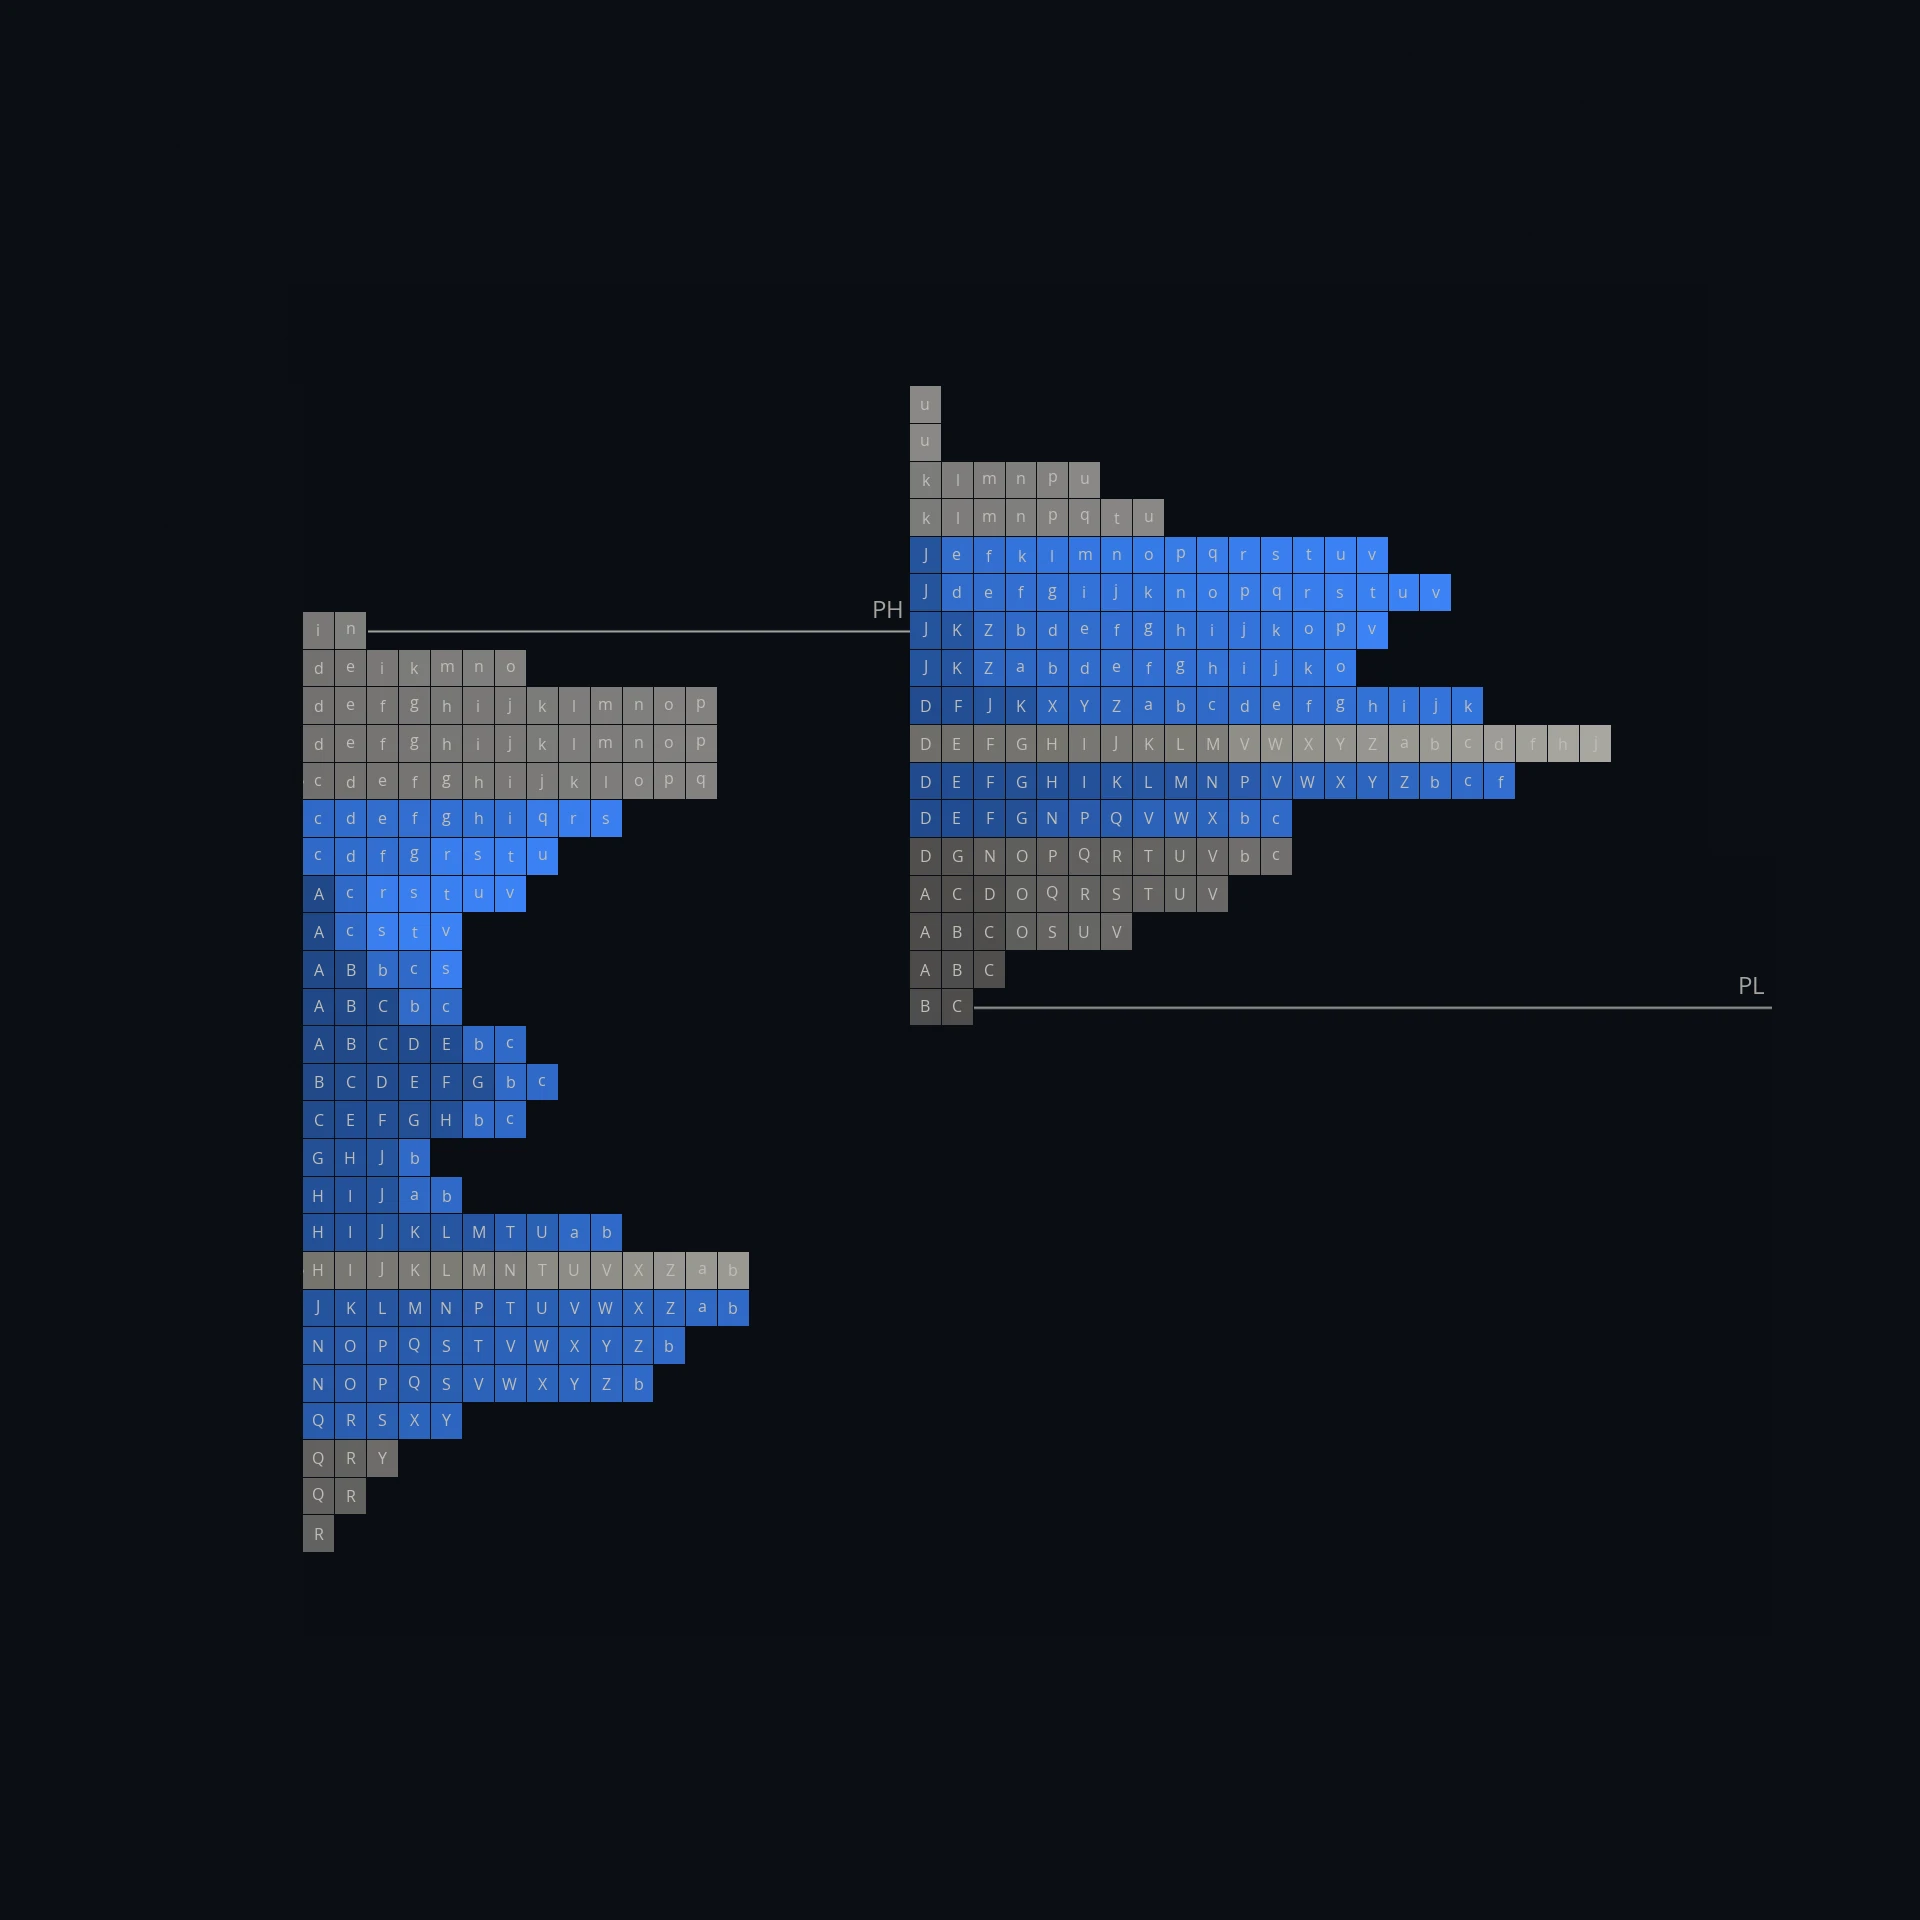
A tail is the opposite: a run of single prints at the top or bottom of the profile, where price reached a level and was rejected so quickly that only one period registered there at all. A tail at the low is a buy tail - aggressive buyers stepped in and refused to let price stay. A tail at the high is a sell tail.
Tails mark the most decisive rejections in a session and identify where a committed participant defended a price. The longer the tail, the more emphatic the rejection.
What are naked extensions?
A level is naked - sometimes called virgin - when price has not traded back to it since it was created. A naked extension draws that level forward from the session that produced it and keeps drawing it until price finally returns, at which point the extension stops.
Almost every structure a profile produces can be extended this way, not just the point of control. A naked POC is the best known of them, but the value area edges, poor highs and lows, single prints and tails all leave levels the market has yet to revisit, and each can be carried forward on its own.
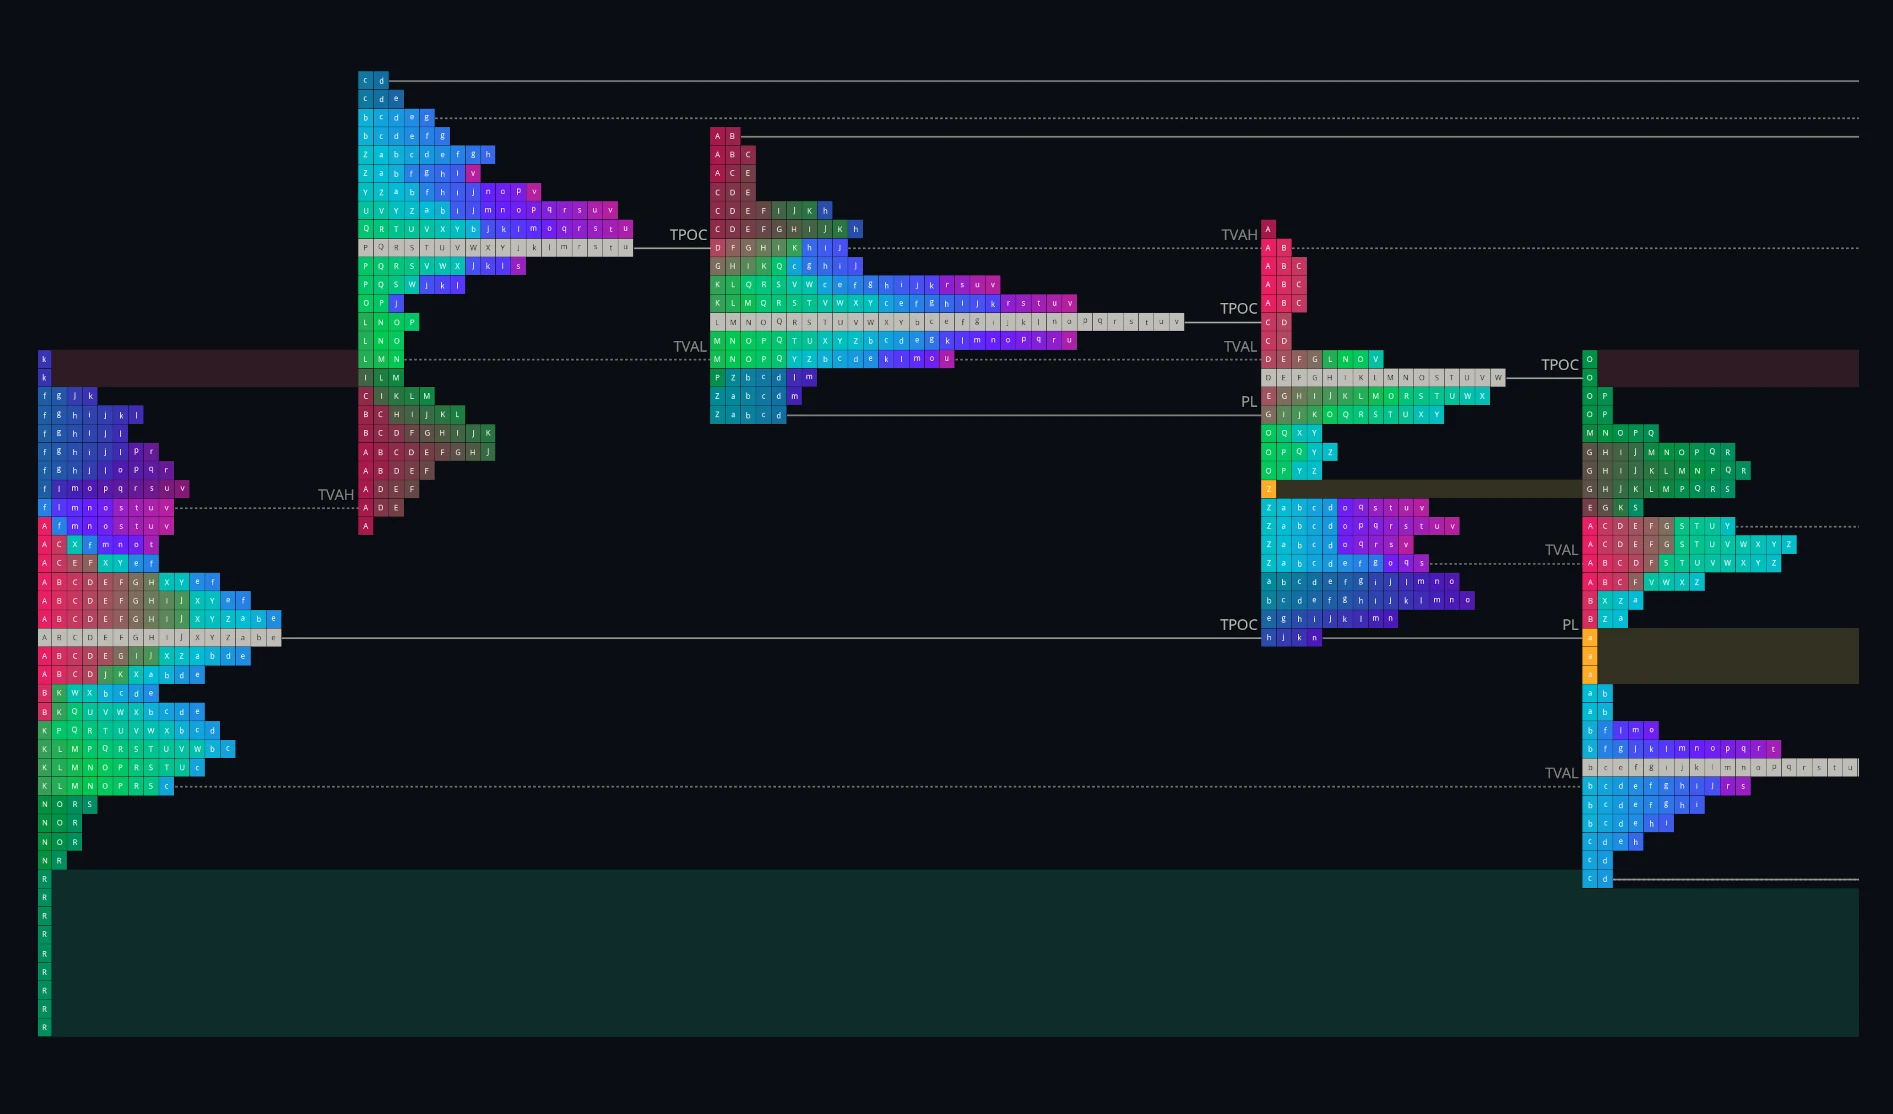
The reason to extend them is that untested levels tend to attract price. A level the market agreed on heavily and then walked away from is unfinished business, and the extension turns a static historical profile into a live reference that stays on the chart exactly as long as it remains untested. Read together, the surviving extensions form a map of the levels above and below the current market that the auction has not yet resolved.
Extensions are enabled per structure, so you can carry forward only what you want to watch. A chart with every extension turned on quickly becomes unreadable; most traders run naked POCs and value area edges, and enable the rest when a specific level matters.
How is a market profile different from a volume profile?
Both draw horizontal distributions beside price, which is why they are often confused, but they measure different things. A volume profile row is long because a lot of contracts traded at that price. A TPO row is long because the market spent a lot of time there.
The two often agree, and where they don’t that divergence tells us a story. A level with heavy volume but little time is a place where a large amount of business was done quickly - an aggressive fill, a liquidation. A level with lots of time but little volume is a place the market was content to sit without much changing hands. Reading both together is more useful than choosing between them.
When should you use a market profile?
Market profile answers questions about acceptance rather than direction. It is most useful for deciding whether a market is balanced or trending, identifying the levels a market has agreed on and is likely to revisit, and framing a session against the prior one - did today accept yesterday’s value, or reject it?
It is least useful as a timing tool. A profile describes what has already been auctioned; it does not signal entries. Traders generally use it to build the map - where value sits, where business is unfinished - and use faster tools such as an order book heatmap or a footprint chart to time decisions within it.
Related: Volume Profile Visible Range (VPVR) · Volume Profile Session Volume (VPSV) · Order book heatmap
Using TPO in MMT
The traditional method carried constraints that had nothing to do with the theory: one session fixed by exchange hours, thirty-minute periods because that suited a pit trader with a pencil, and structures calculated by hand at the close for a market that had already finished trading.
MMT’s TPO keeps the method and removes the constraints. The session is yours to define, the period length is configurable, and every structure - point of control, value area, initial balance, single prints, poor highs and lows, tails - is computed live as the session builds, marked on the chart, and carried forward until price returns to test it.
How do you add TPO to a chart?
TPO can be added in two forms, depending on whether you want it as the subject of its own pane or as context on your price chart.
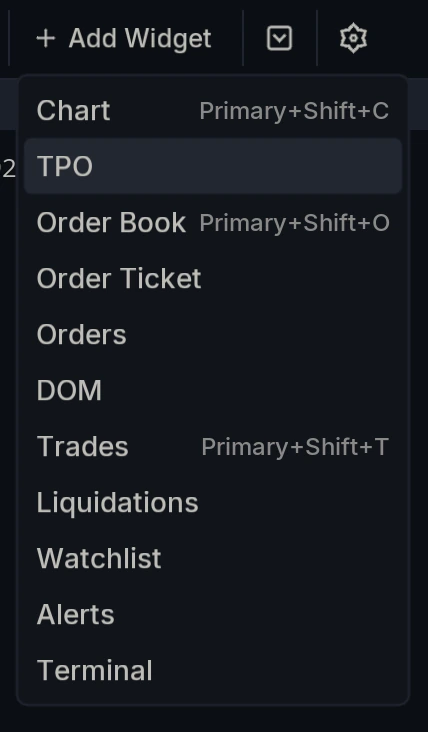
As a widget, it occupies its own panel in the layout: click + Add Widget and choose TPO. This suits dedicated profile analysis, where the distribution is what you are studying.
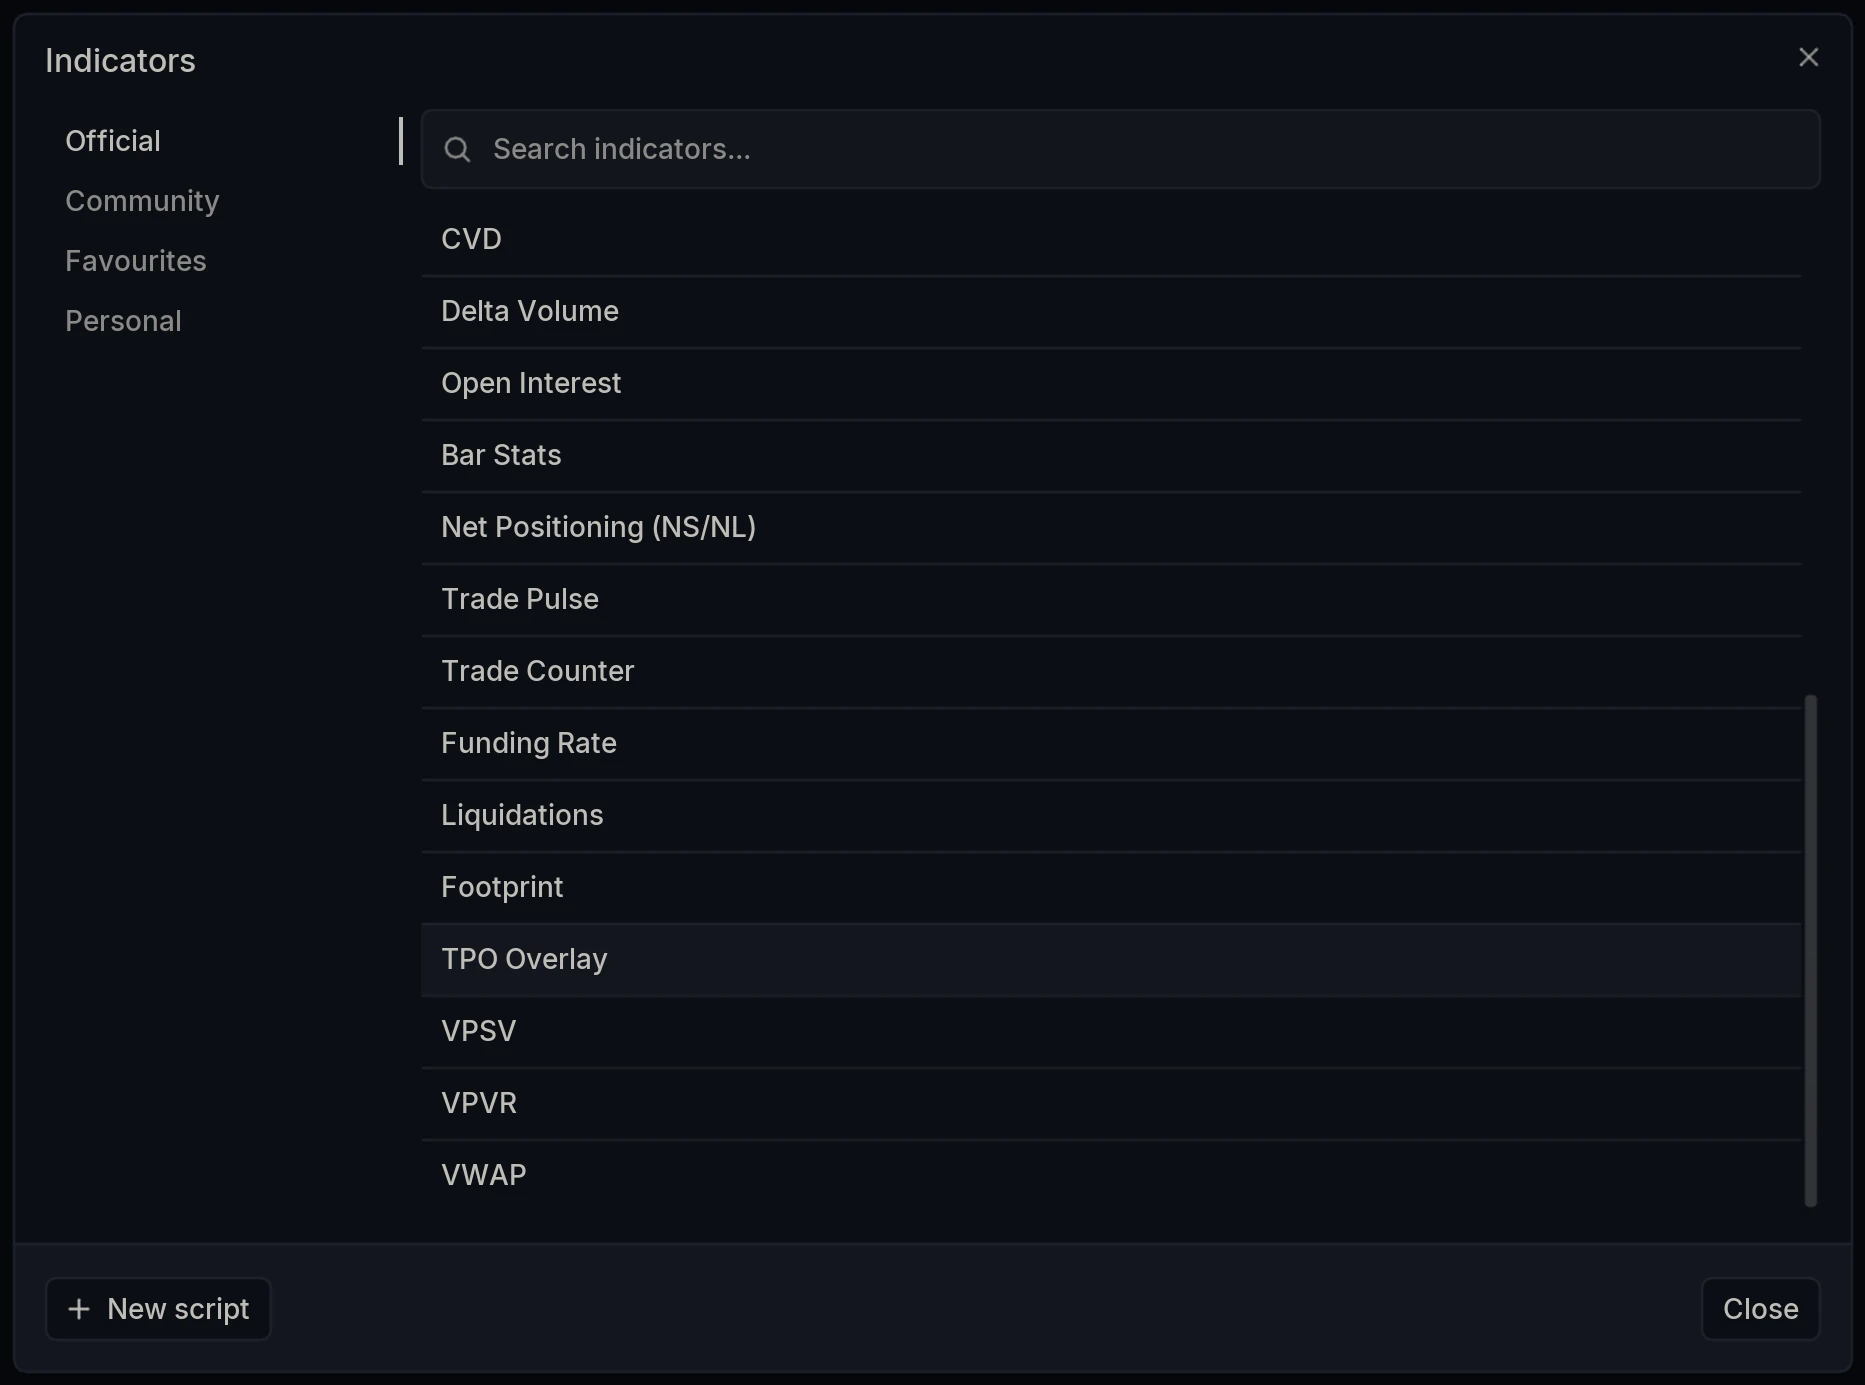
As an overlay, it draws directly onto an existing chart alongside the candles: open the Indicators dialog and select TPO Overlay under Official. This suits reading profile structure in the context of price action rather than beside it.
How do you set the trading session?
A profile is only meaningful relative to a defined period. Traditional markets take theirs from the exchange’s hours; crypto never closes, so the session has to be chosen - a rolling day, a week, a month, or one of the regional windows the market organises itself around.
MMT keeps session definitions in one place, in the terminal’s Settings under Sessions. Three built-in sessions ship with it - New York, London and Asia - each with an editable name, a start and end time in UTC, an overlay color, and a toggle to enable it. Add custom session creates your own; Reset built-ins restores the originals. Anything defined there is available to TPO and to every other layer that works in sessions, so a session you define once behaves the same everywhere.
How do you merge, split and expand profiles?
Sessions do not always fall neatly into one useful profile, so three operations reshape them. All three live in the same place: right-click a profile to open its menu, which offers Split profile at this letter, Merge with previous profile, Merge right, Expand, and - once you have made changes - Undo Split, Undo Merge and Reset all merges and splits.
Expand
Expand deconstructs the profile, separating it back into the individual periods that built it. Instead of one distribution you see each block group in sequence, which is how you check when during the session a level was traded rather than only how often. A level built early and never revisited reads very differently from one the market returned to all day, and only the expanded view distinguishes them.
Alt: “A TPO profile being expanded from its right-click menu, separating the stacked distribution into its individual periods.”
Merge
Merge combines consecutive sessions into a single composite profile. When a market spends several days rotating in the same range, the individual daily profiles each tell a partial story, while the merged profile reveals the structure of the whole range - one POC, one value area, describing the entire period of balance.
Alt: “Consecutive TPO sessions being merged into a single composite profile.”
Split
Split does the reverse, and Split profile at this letter is the precise form of it: the profile divides at the period you right-clicked. This matters when one session contains two clearly separate distributions - a market that traded one range, moved sharply, then built a second range. Combined, those average into a POC sitting in the gap between them, at a price the market barely traded. Split at the letter where the move happened and you get two profiles that each describe a real area of acceptance.
Alt: “A TPO profile being split at a chosen letter into two separate distributions.”
Layer Settings
Open TPO Settings via the cog wheel on the layer name. The panel is organized into thirteen sections listed down the left: General, Session, POC, Value Area, Poor High / Low, Single Prints, Tails, Markers, Price Marker, Price Source, Summary, Initial Balance and Volume Profile.
General
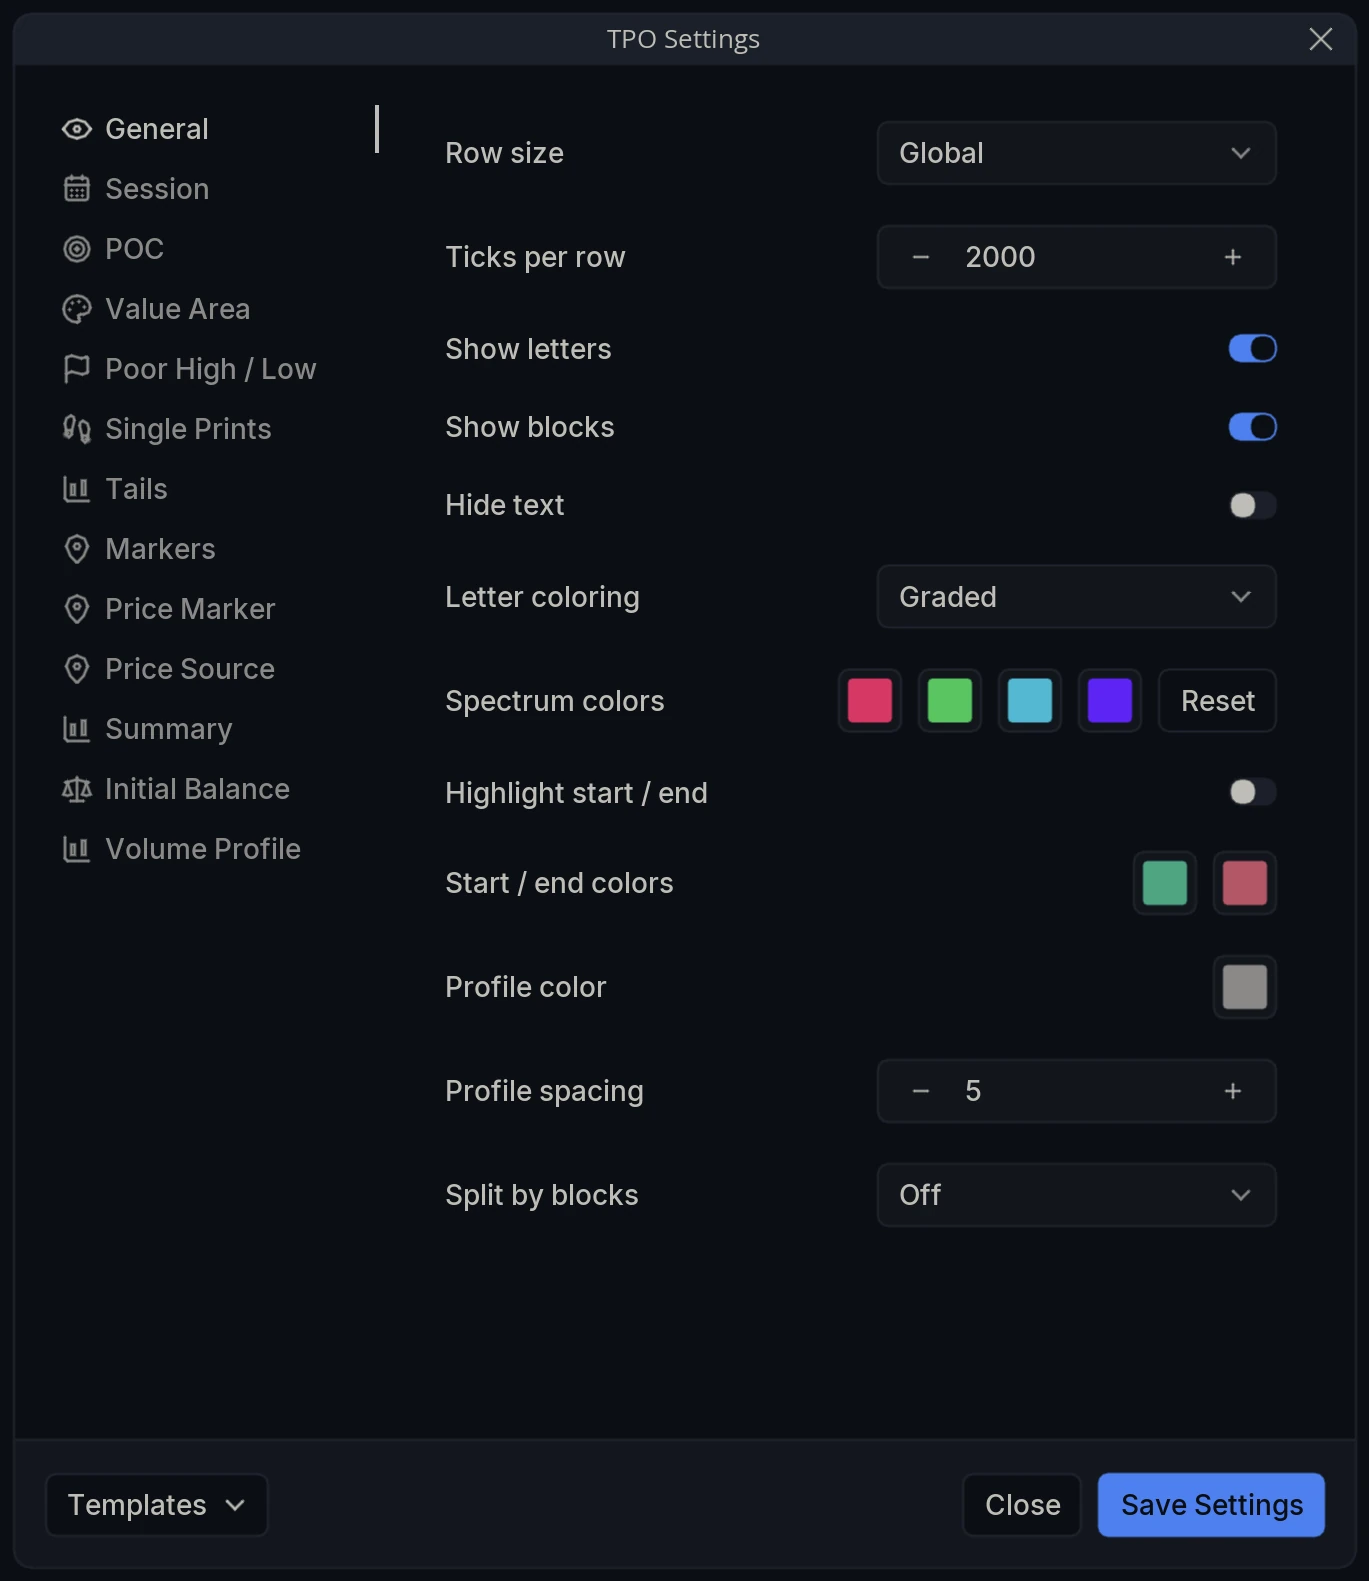
Row size - How the height of each profile row is determined: Auto sizes rows automatically, Global uses the shared per-pair value, and Custom uses the value set below.
Ticks per row - The number of ticks each row spans. In Custom mode this applies to this layer alone; in Global mode the value is shared with every other indicator in Global mode on the same pair.
Show letters - Draw the period letter inside each block.
Show blocks - Draw the block shapes themselves.
Hide text - Suppress the lettering while keeping the blocks.
Letter coloring - How blocks are colored: Graded (shaded by period through the session), Spectrum (cycling the spectrum colors below) or Flat (a single color).
Spectrum colors - The four colors used by Spectrum mode, with Reset to restore the defaults.
Highlight start / end - color the session’s first and last periods distinctly.
Start / end colors - The two colors used by that highlight.
Profile color - The base color of the profile.
Profile spacing - The gap between adjacent session profiles.
Split by blocks - Expand profiles into their individual block groups, the same result as Expand in the right-click menu: Off, All profiles, or the Last profile only.
Session
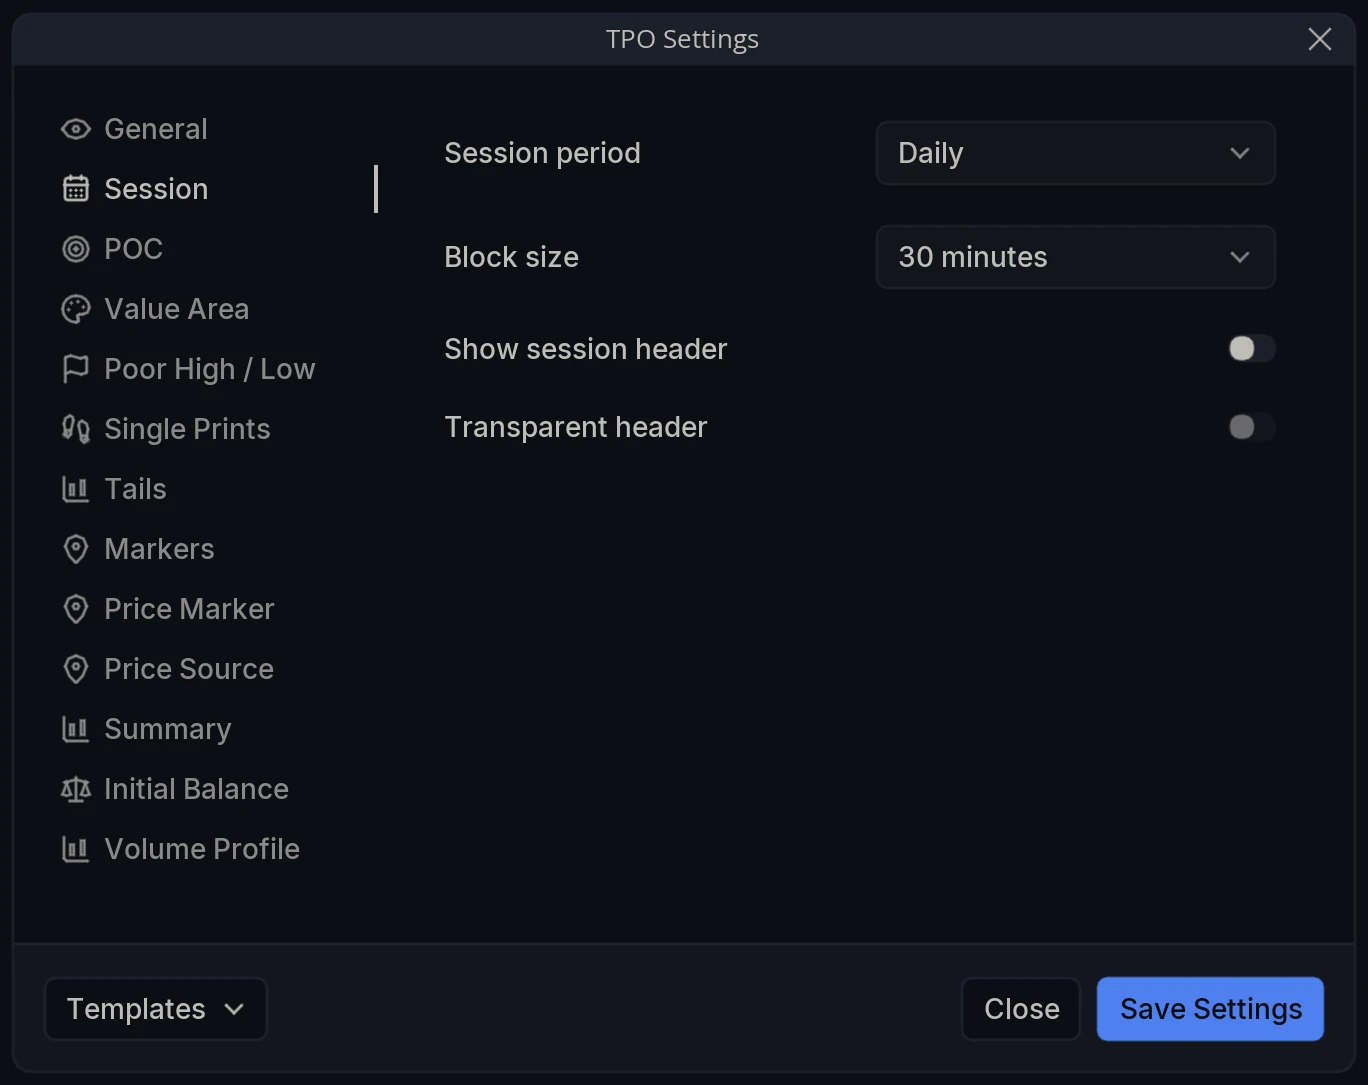
Session period - The window each profile covers: Daily, Weekly, Monthly, London, New York, Asia, Intraday or Custom. Times for the named sessions come from the terminal’s Sessions settings.
Block size - The length of each time block, 30 minutes by convention.
Show session header - Display a header band above each session’s profile.
Transparent header - Render that header without a solid background.
POC
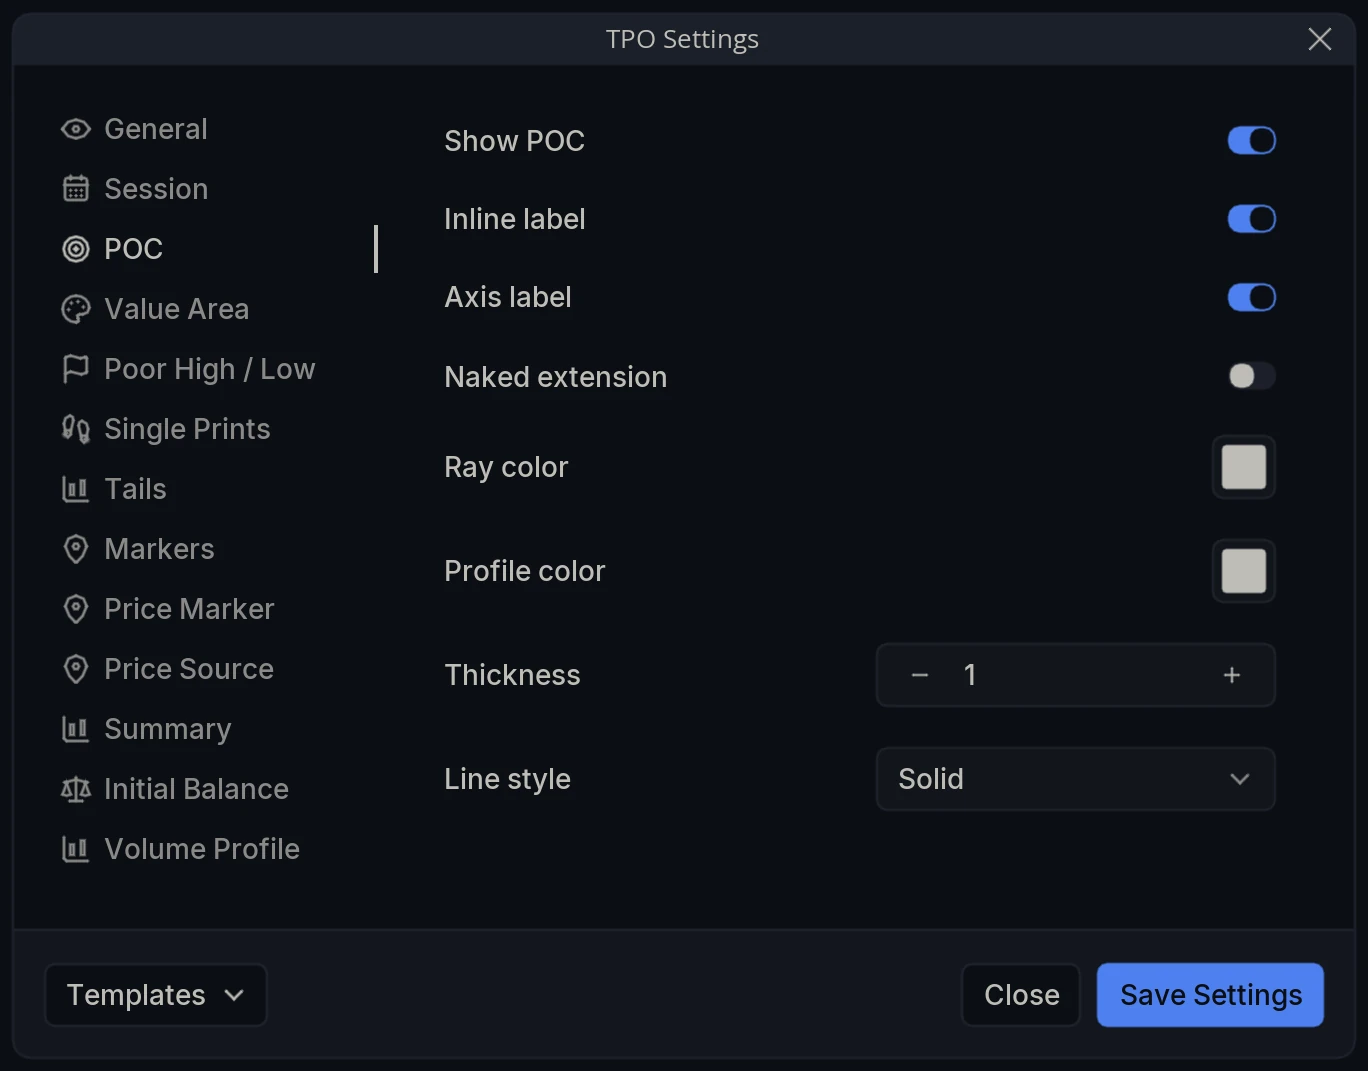
Show POC - Mark the Point of Control on the profile.
Inline label - Label the POC on the chart itself.
Axis label - Label the POC price on the price axis.
Naked extension - Extend the POC forward until price trades back to it.
Ray color - color of the POC ray.
Profile color - color of the POC row within the profile.
Thickness - Weight of the POC ray.
Line style - Solid, dashed or dotted.
Value Area
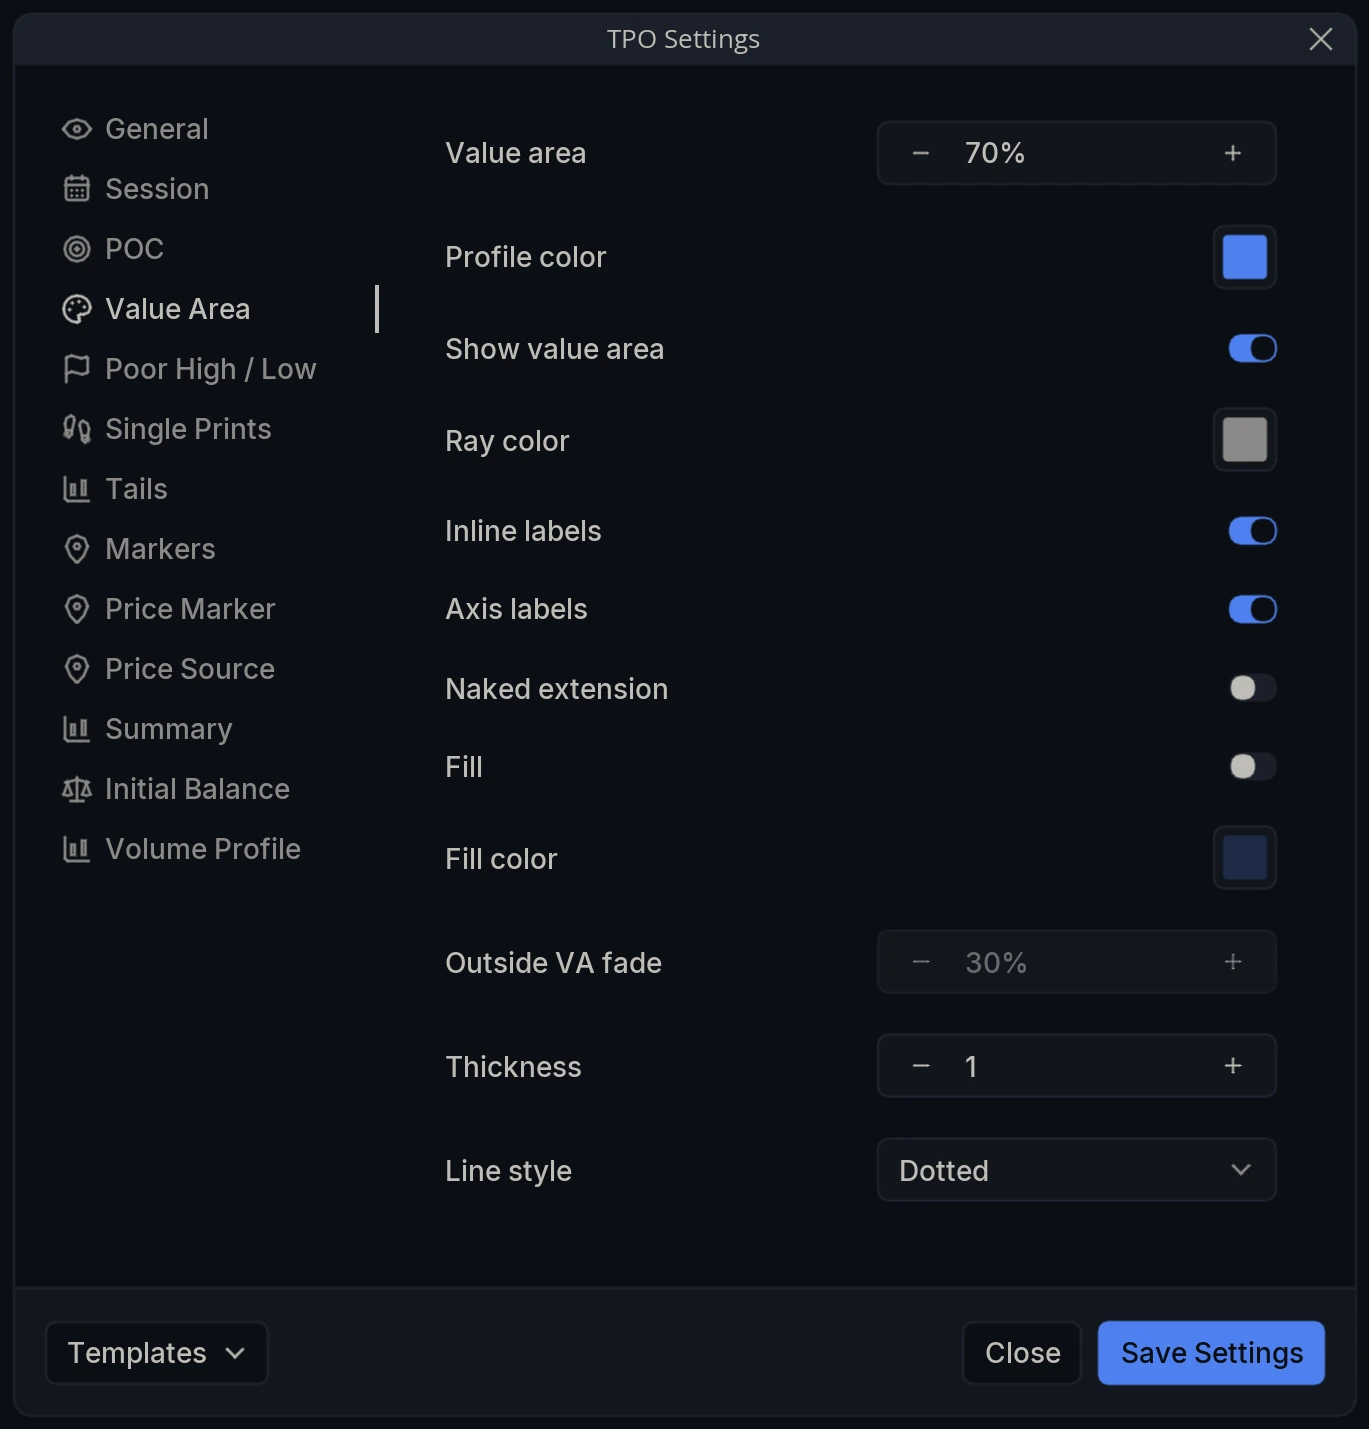
Value area - The percentage of blocks the value area contains; 70% by convention.
Profile color - color of the value area rows within the profile.
Show value area - Mark the value area on the profile.
Ray color - color of the VAH and VAL rays.
Inline labels - Label VAH and VAL on the chart.
Axis labels - Label the VAH and VAL prices on the price axis.
Naked extension - Extend VAH and VAL forward until price trades back to them.
Fill - Shade the area between VAH and VAL.
Fill color - color of that shading.
Outside VA fade - How much the profile outside the value area is dimmed.
Thickness - Weight of the value area rays.
Line style - Solid, dashed or dotted.
Poor High / Low
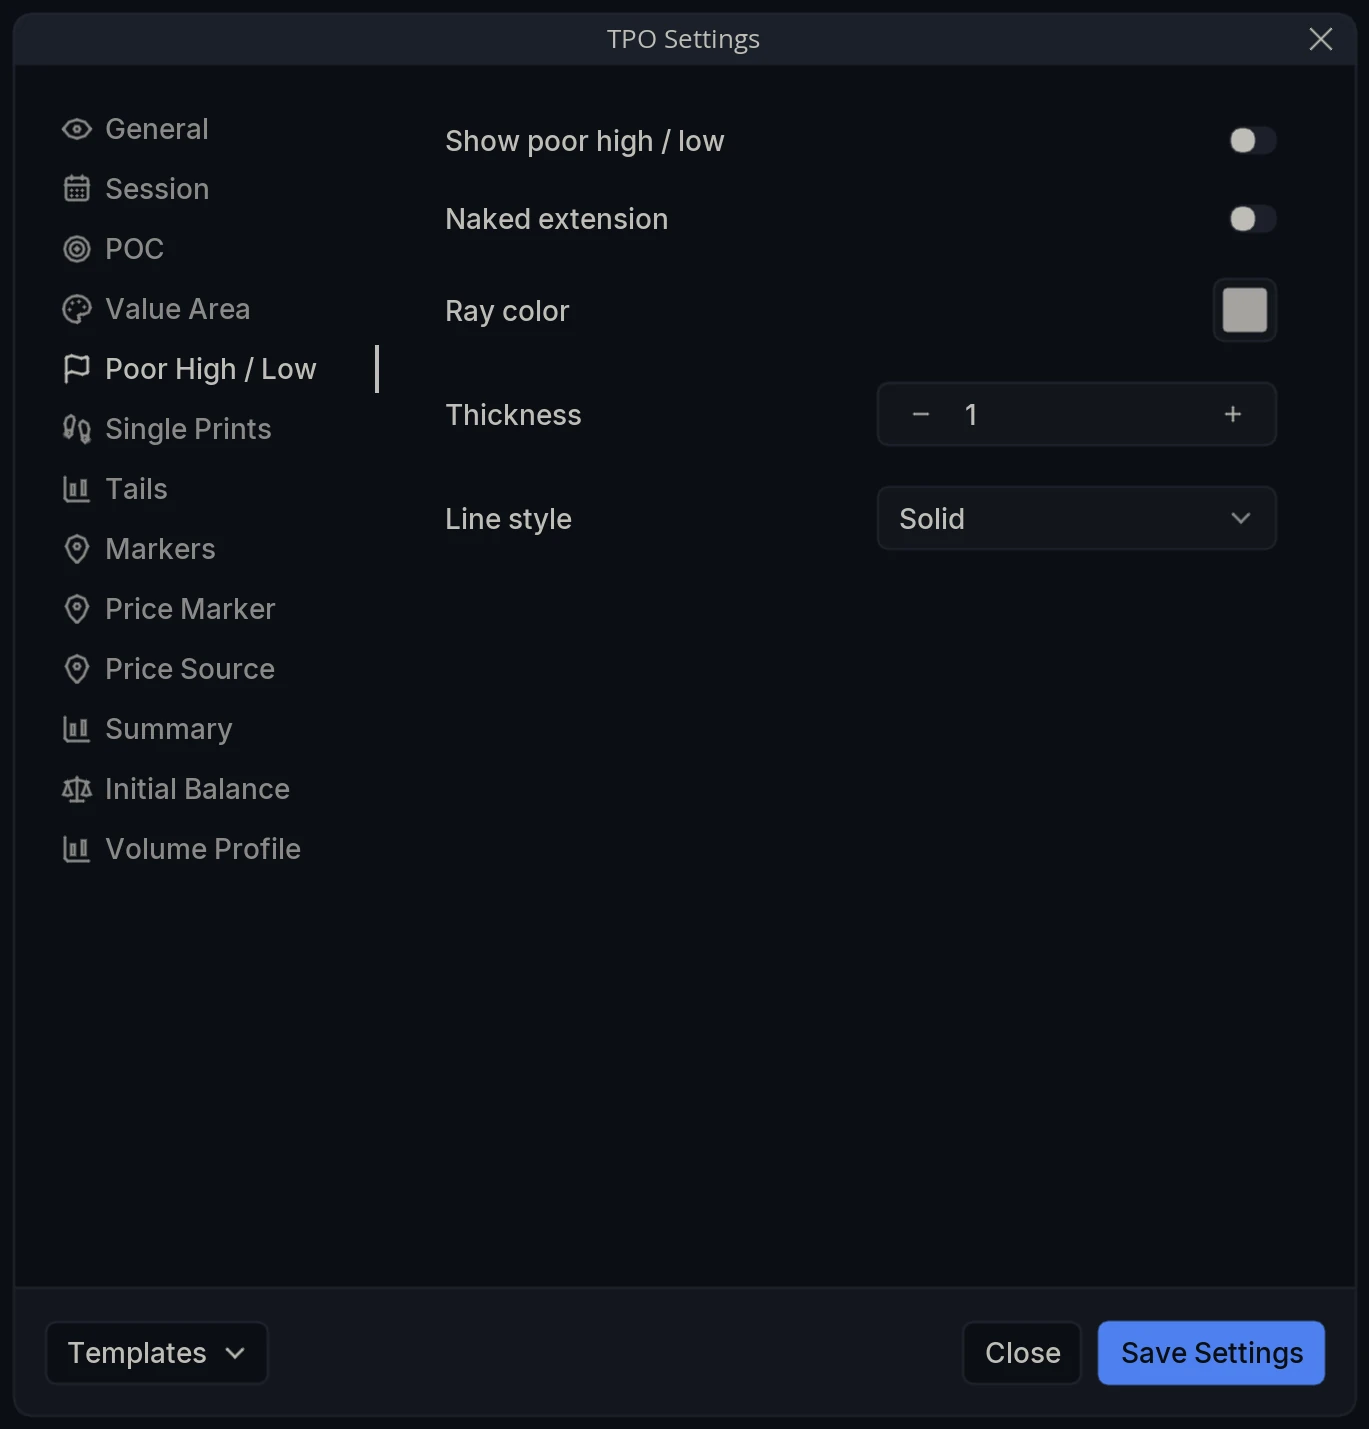
Show poor high / low - Mark poor extremes on the profile.
Naked extension - Extend them forward until price trades back to them.
Ray color - color of the poor high and low rays.
Thickness - Weight of those rays.
Line style - Solid, dashed or dotted.
Single Prints
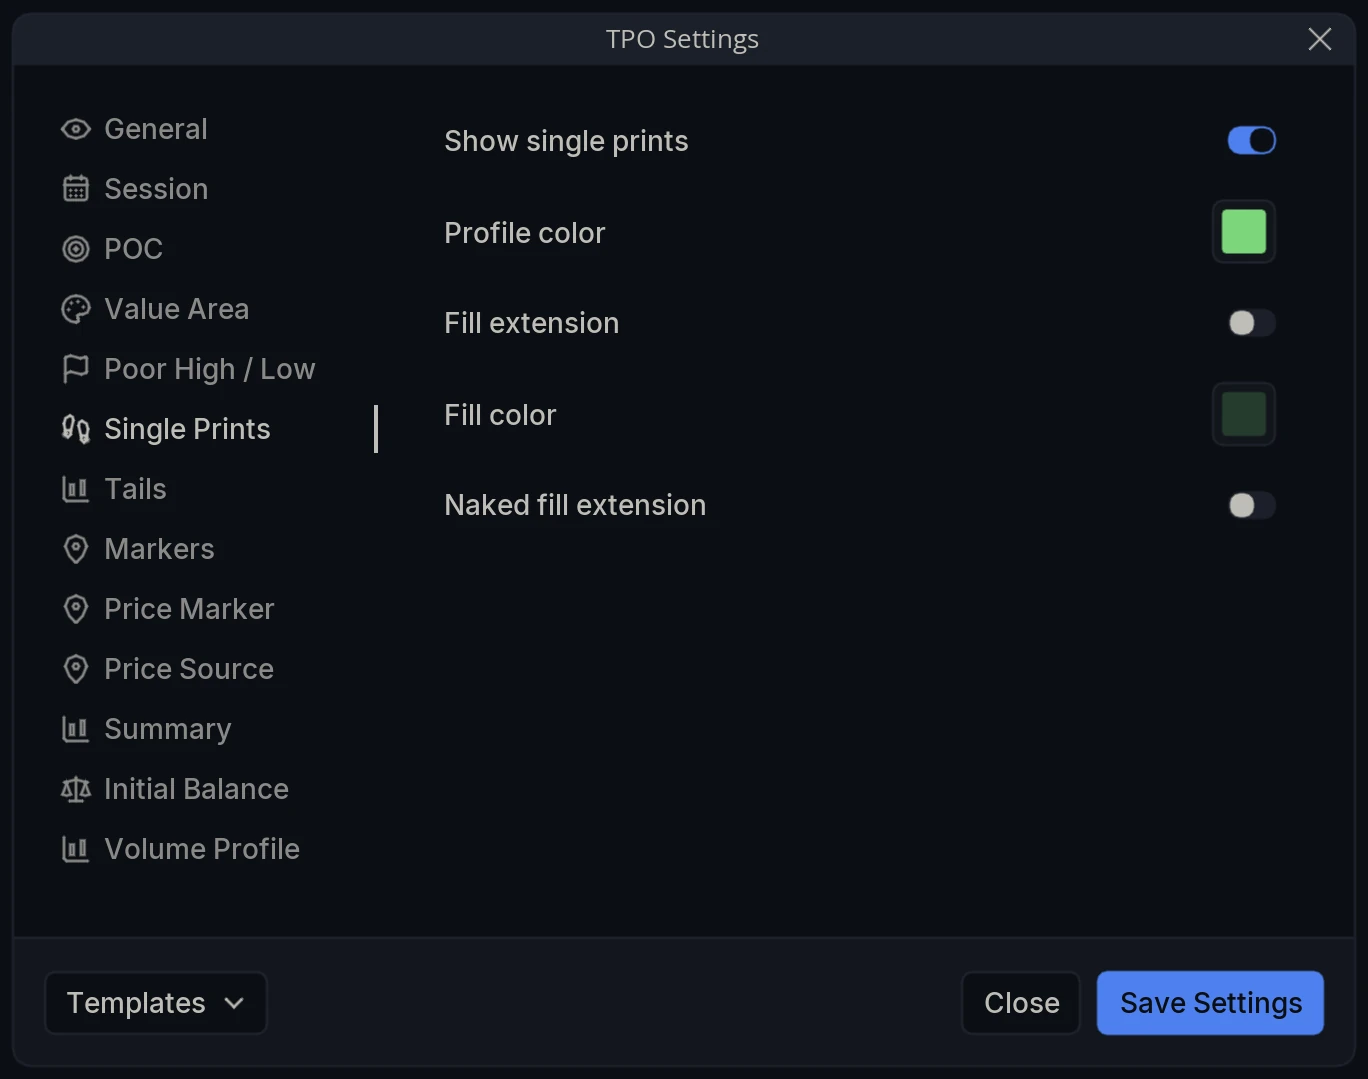
Show single prints - Highlight single prints within the profile.
Profile color - color used for the highlight.
Fill extension - Extend the highlight rightward from the profile.
Fill color - color of that extension.
Naked fill extension - Extend it only until price trades back through the level.
Tails
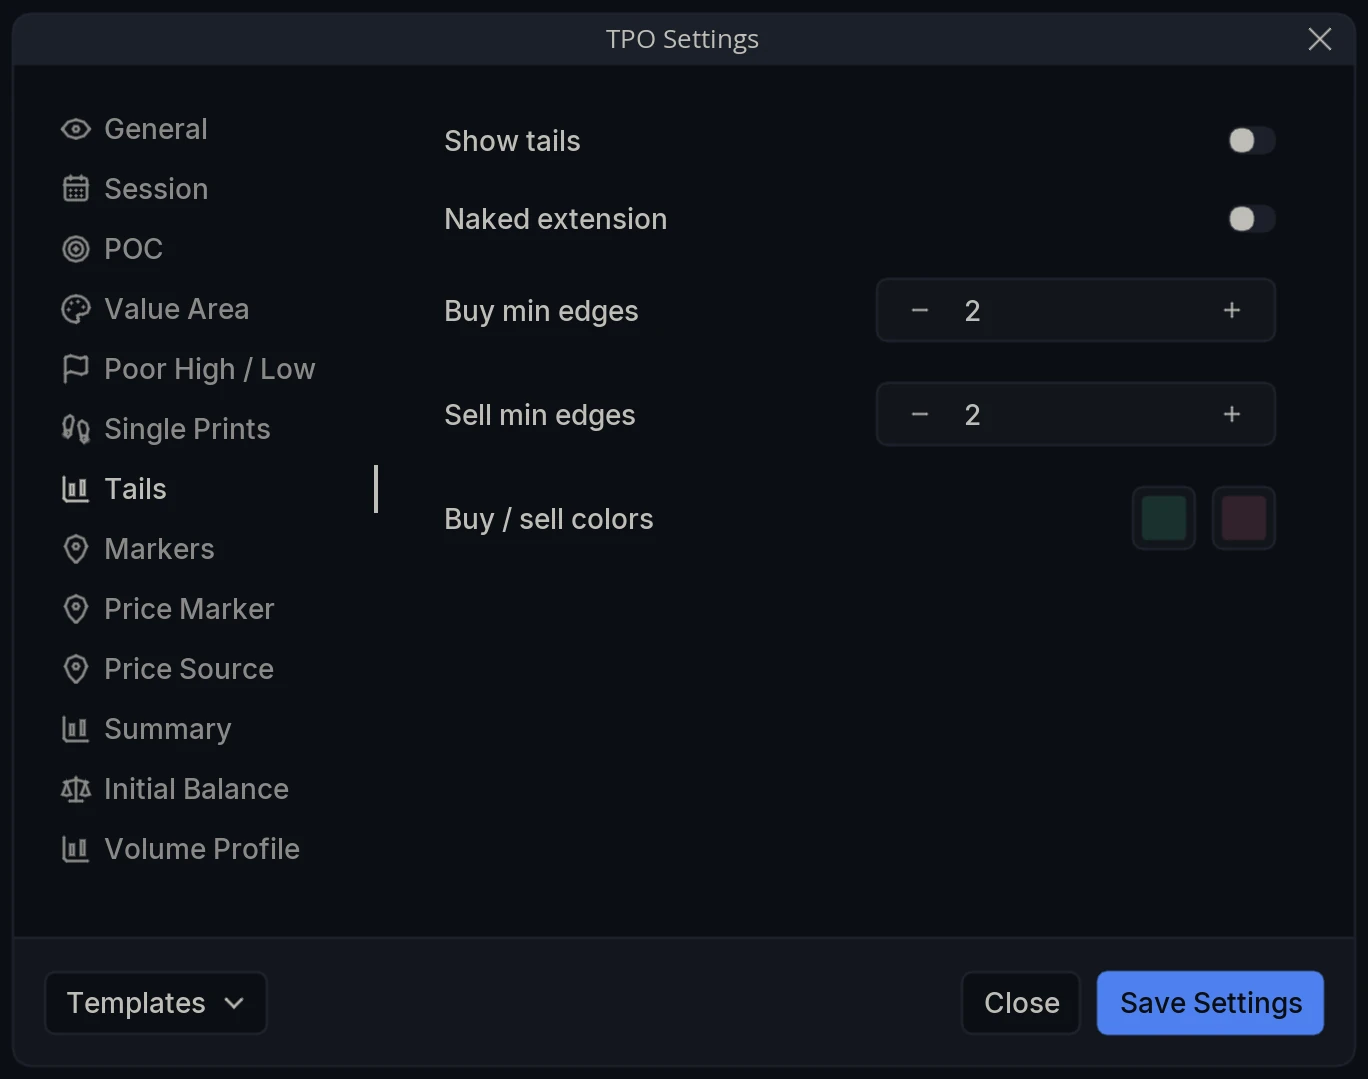
Show tails - Mark buy and sell tails at the profile extremes.
Naked extension - Extend tails forward until price trades back to them.
Buy min edges - The minimum number of single-print levels required to qualify as a buy tail.
Sell min edges - The same threshold for a sell tail.
Buy / sell colors - The two colors used for buy and sell tails.
Markers
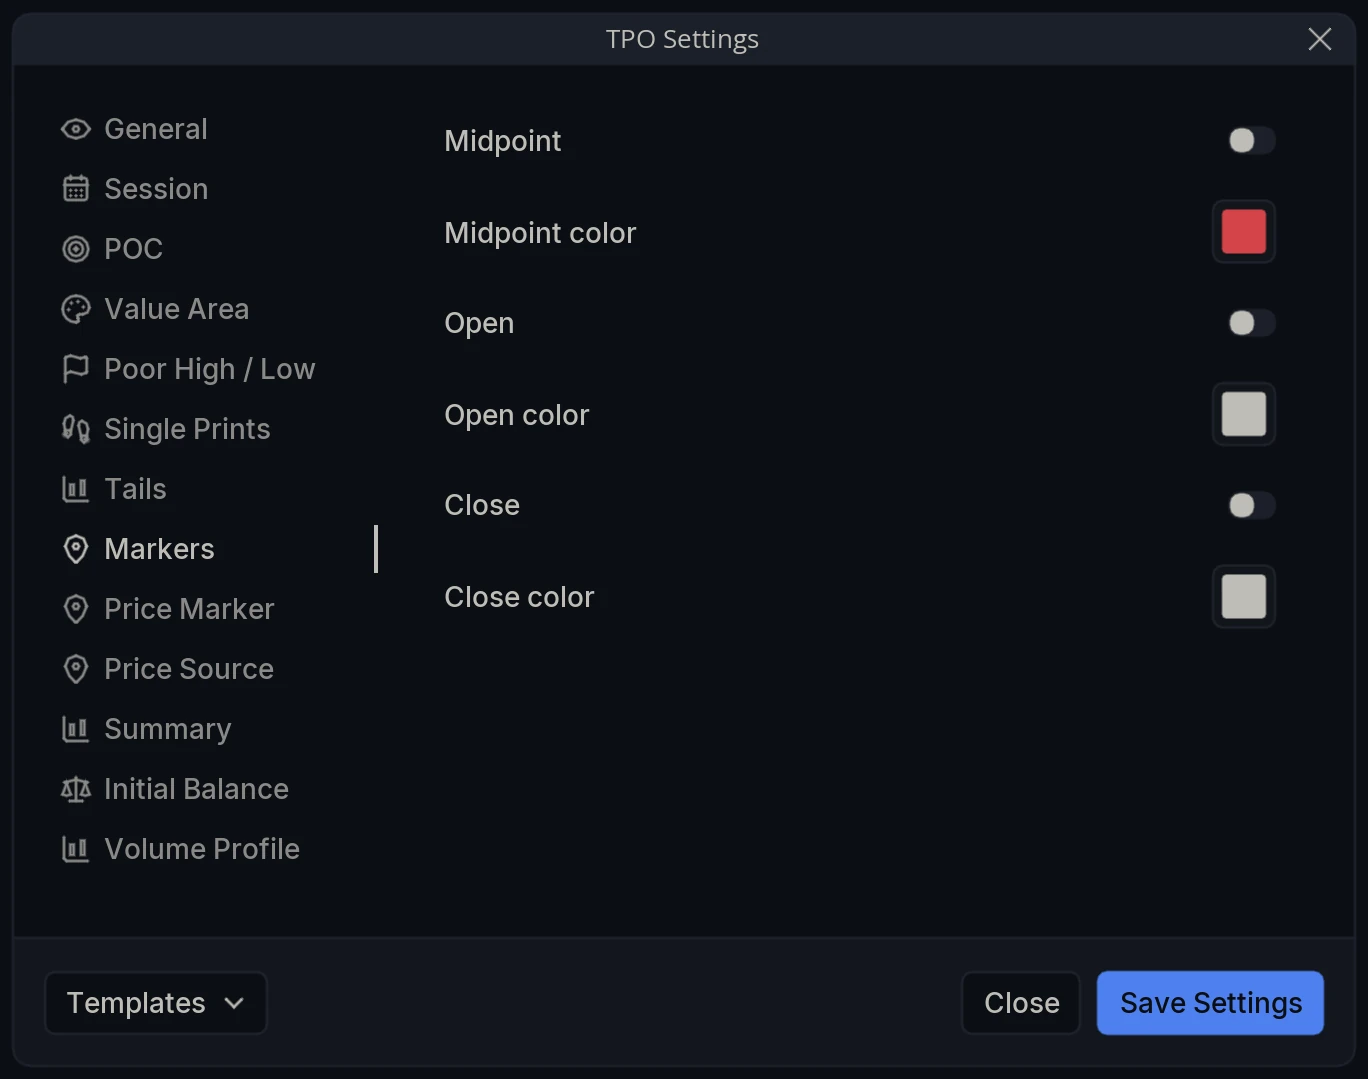
Midpoint - Mark the midpoint between the session’s high and low.
Midpoint color - color of that marker.
Open - Mark the session’s opening price.
Open color - color of the open marker.
Close - Mark the session’s closing price.
Close color - color of the close marker.
Price Marker
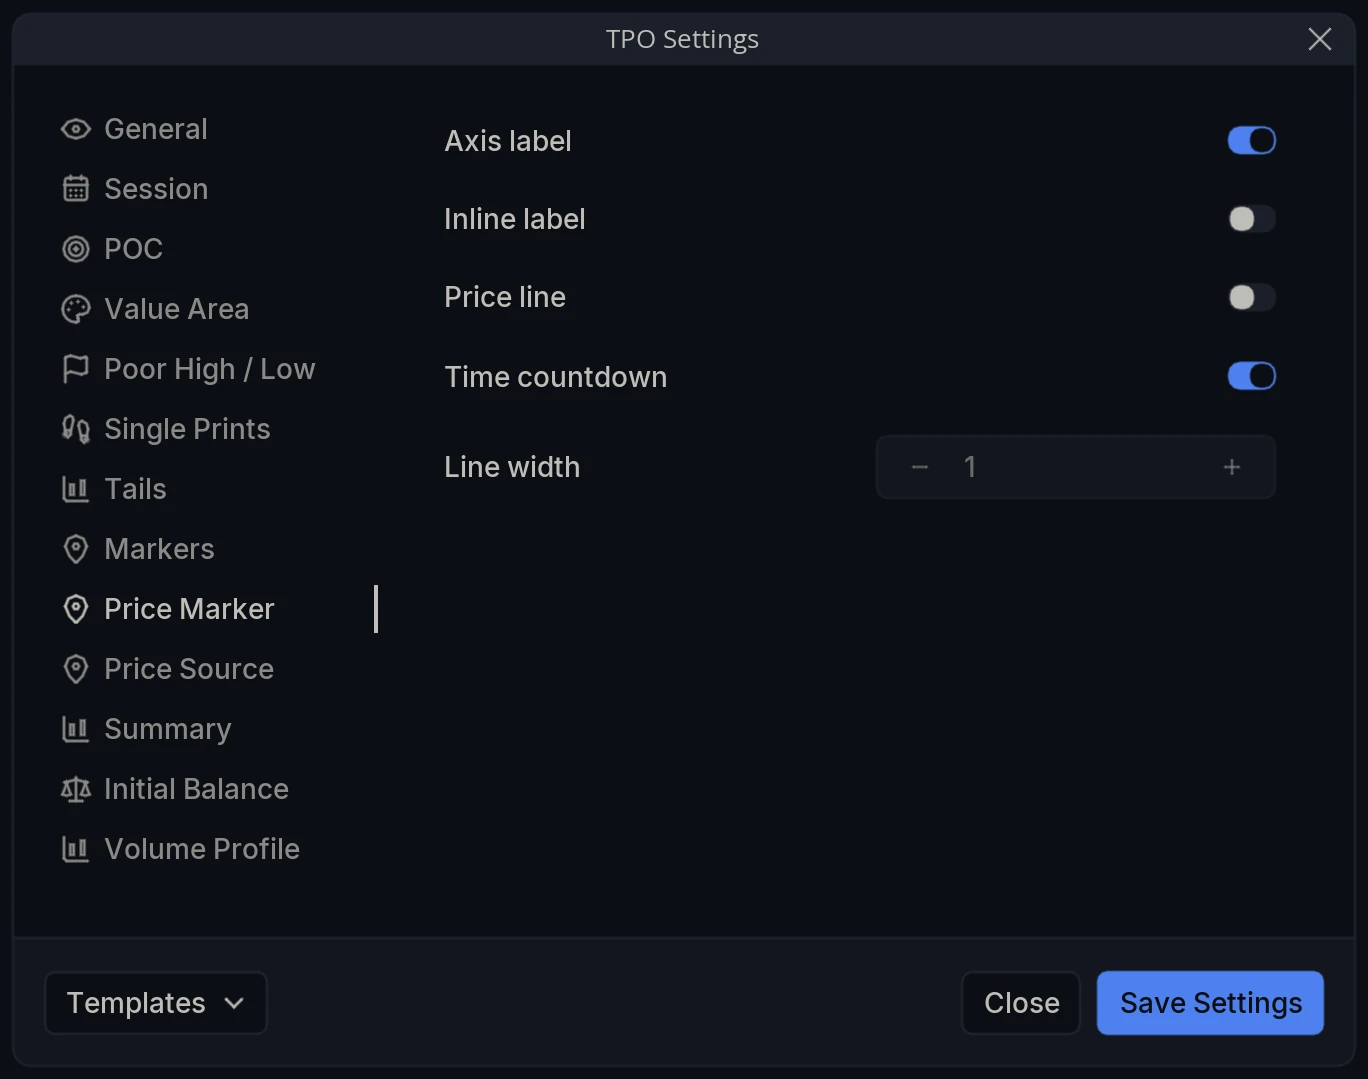
Axis label - Show the current price on the price axis.
Inline label - Show the current price on the chart itself.
Price line - Draw a horizontal line at the current price.
Time countdown - Show the time remaining in the current block.
Line width - Thickness of the price line.
Price Source
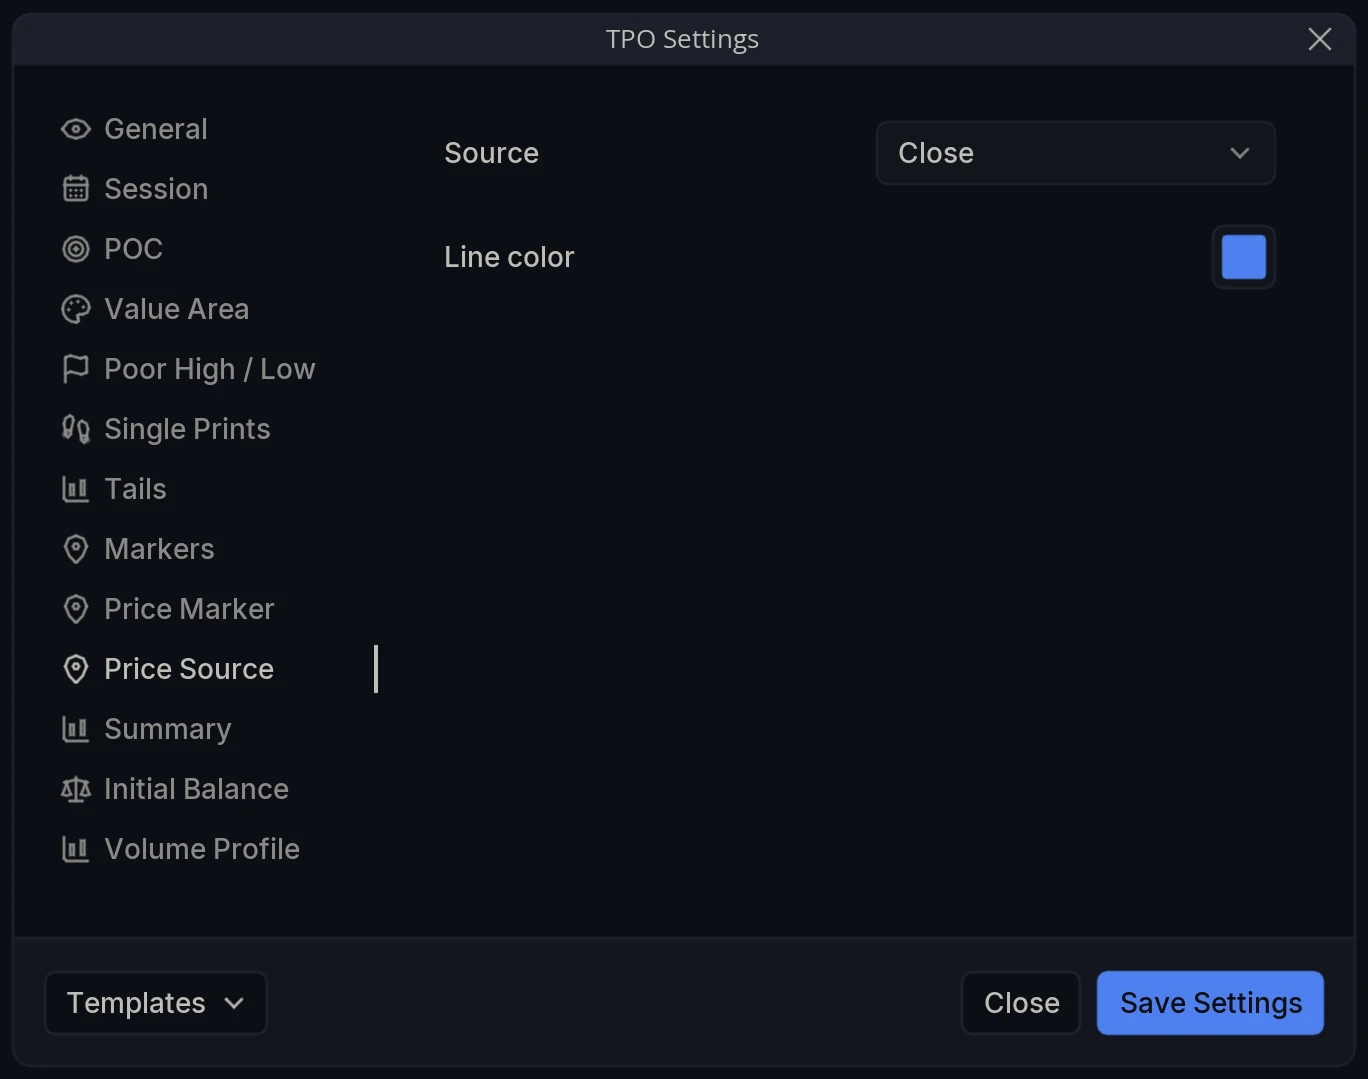
Source - Which price of each bar drives the value shown on the price axis at the right of the chart: Open, High, Low or Close.
Line color - color of that plot.
Summary
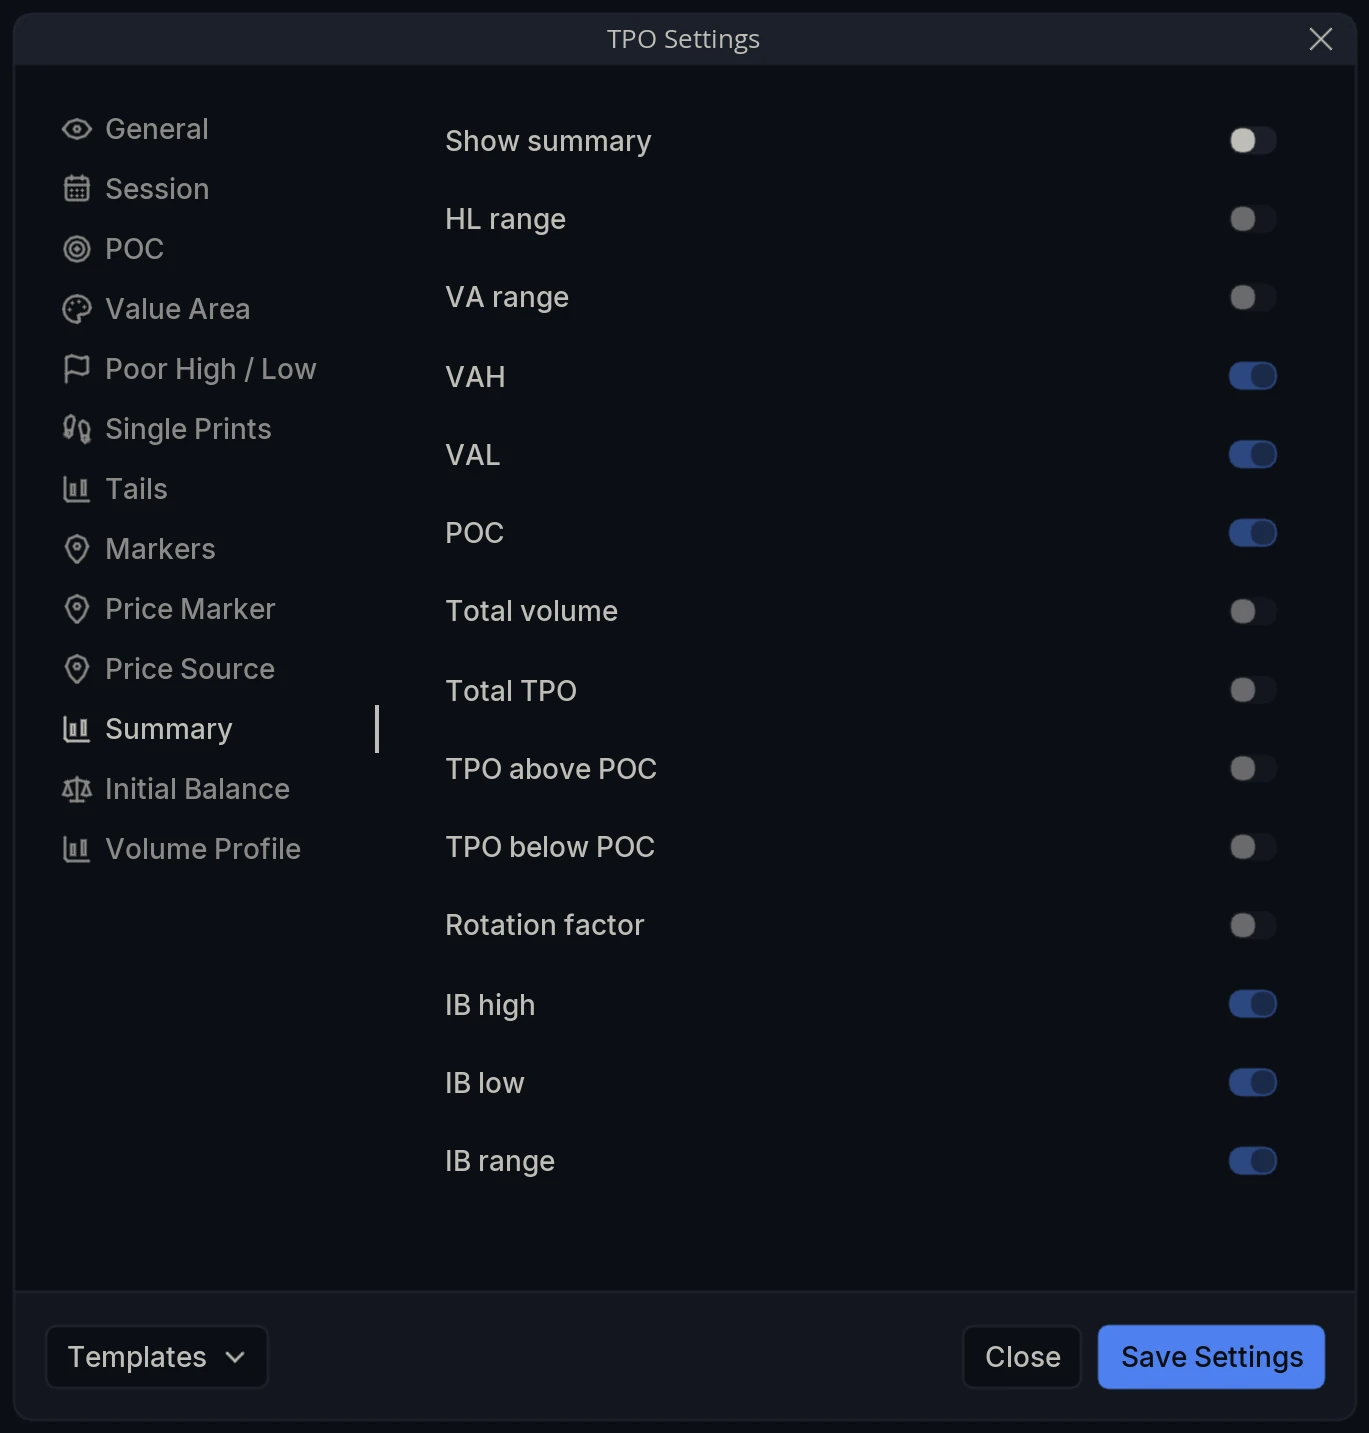
Show summary - Display a statistics panel for each session profile. The toggles below choose which figures it lists.
HL range - The session’s high-to-low range.
VA range - The height of the value area.
VAH / VAL / POC - The three headline prices.
Total volume - Volume traded during the session.
Total TPO - The total number of blocks in the profile.
TPO above POC / TPO below POC - How the distribution splits either side of the Point of Control - a quick read on whether the session leaned up or down.
Rotation factor - A single number summarising who controlled the session. Strongly negative means one-sided selling dominated; strongly positive means the reverse; balanced days sit near zero. It gives you at a glance what you would otherwise read out of the profile’s shape.
IB high / IB low / IB range - The initial balance’s boundaries and size.
Initial Balance
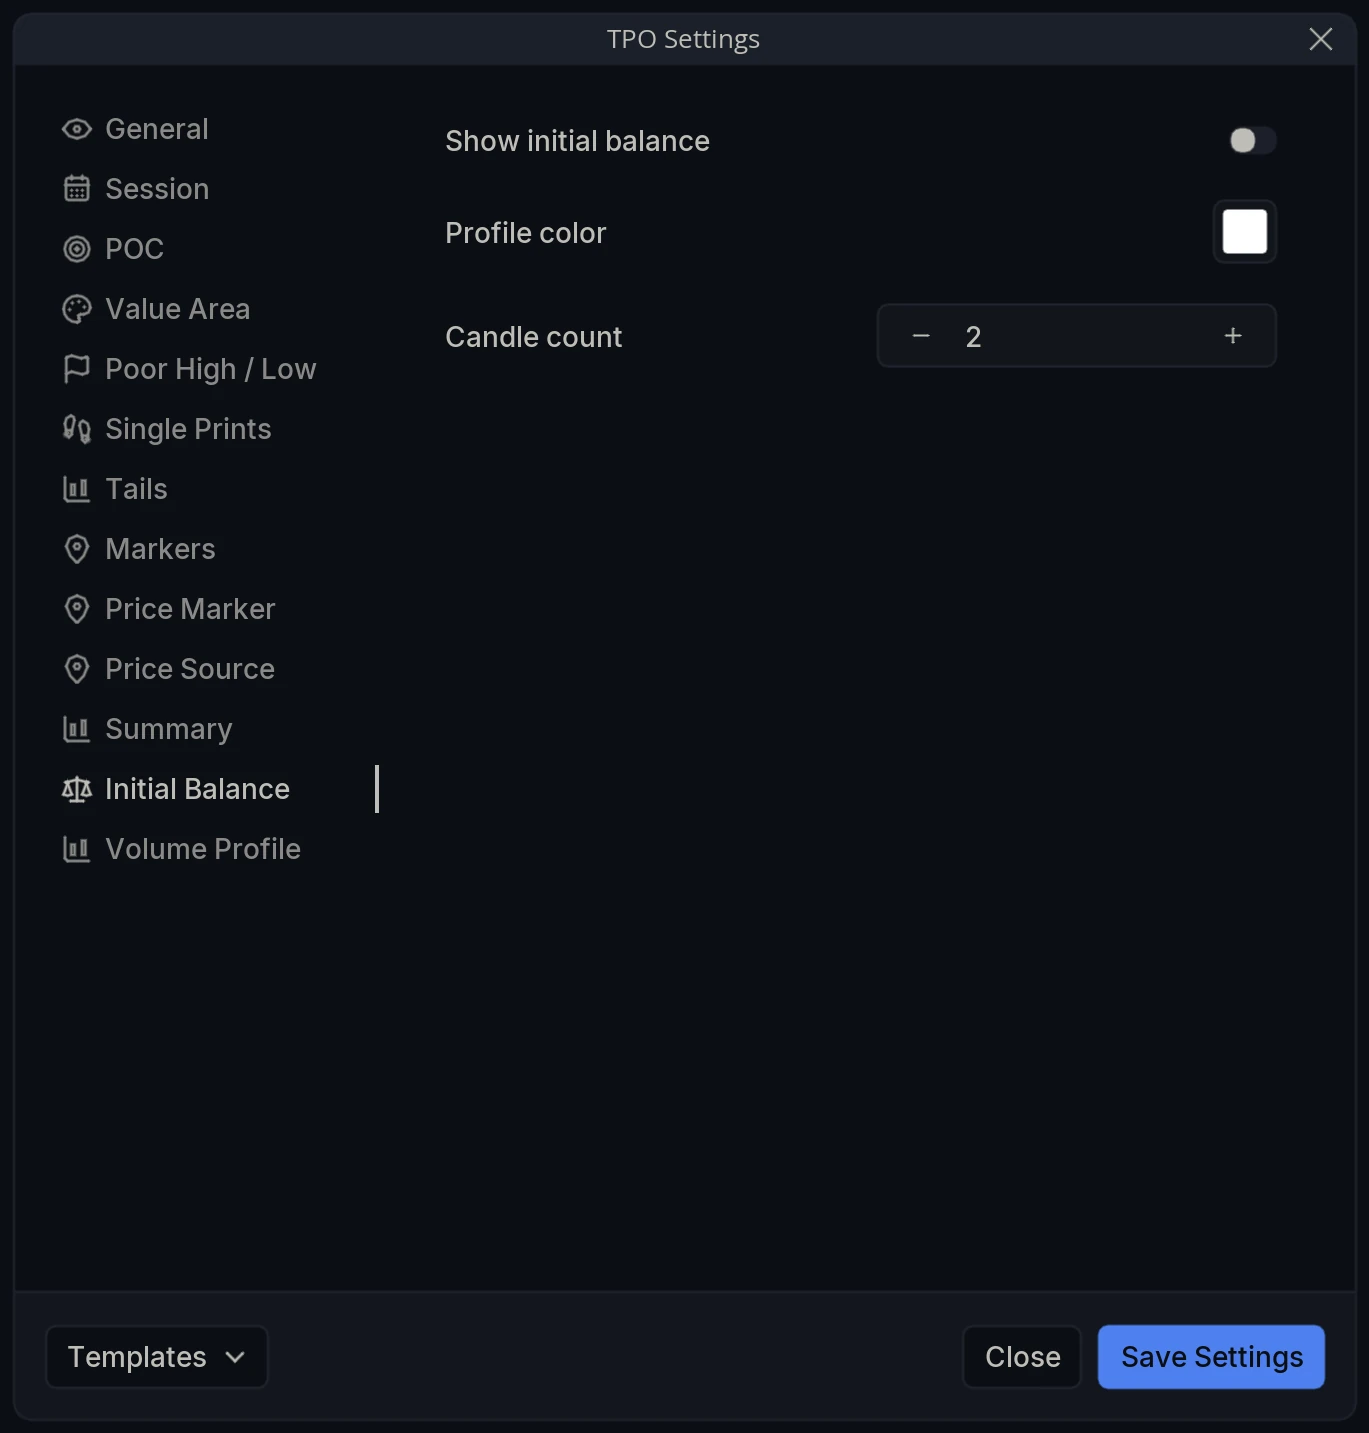
Show initial balance - Mark the initial balance range on the profile.
Profile color - color used for it.
Candle count - How many of the session’s opening blocks form the initial balance. The default of 2 gives the traditional first hour at the conventional 30-minute block size; 3 extends it to 90 minutes, and so on.
Volume Profile
TPO can draw a volume distribution alongside the time distribution, so the same session can be read both ways at once. The settings here mirror those of the dedicated volume profile layers - see VPSV (Volume Profile Session Volume) for session-anchored profiles and VPVR (Volume Profile Visible Range) for the visible-range version.
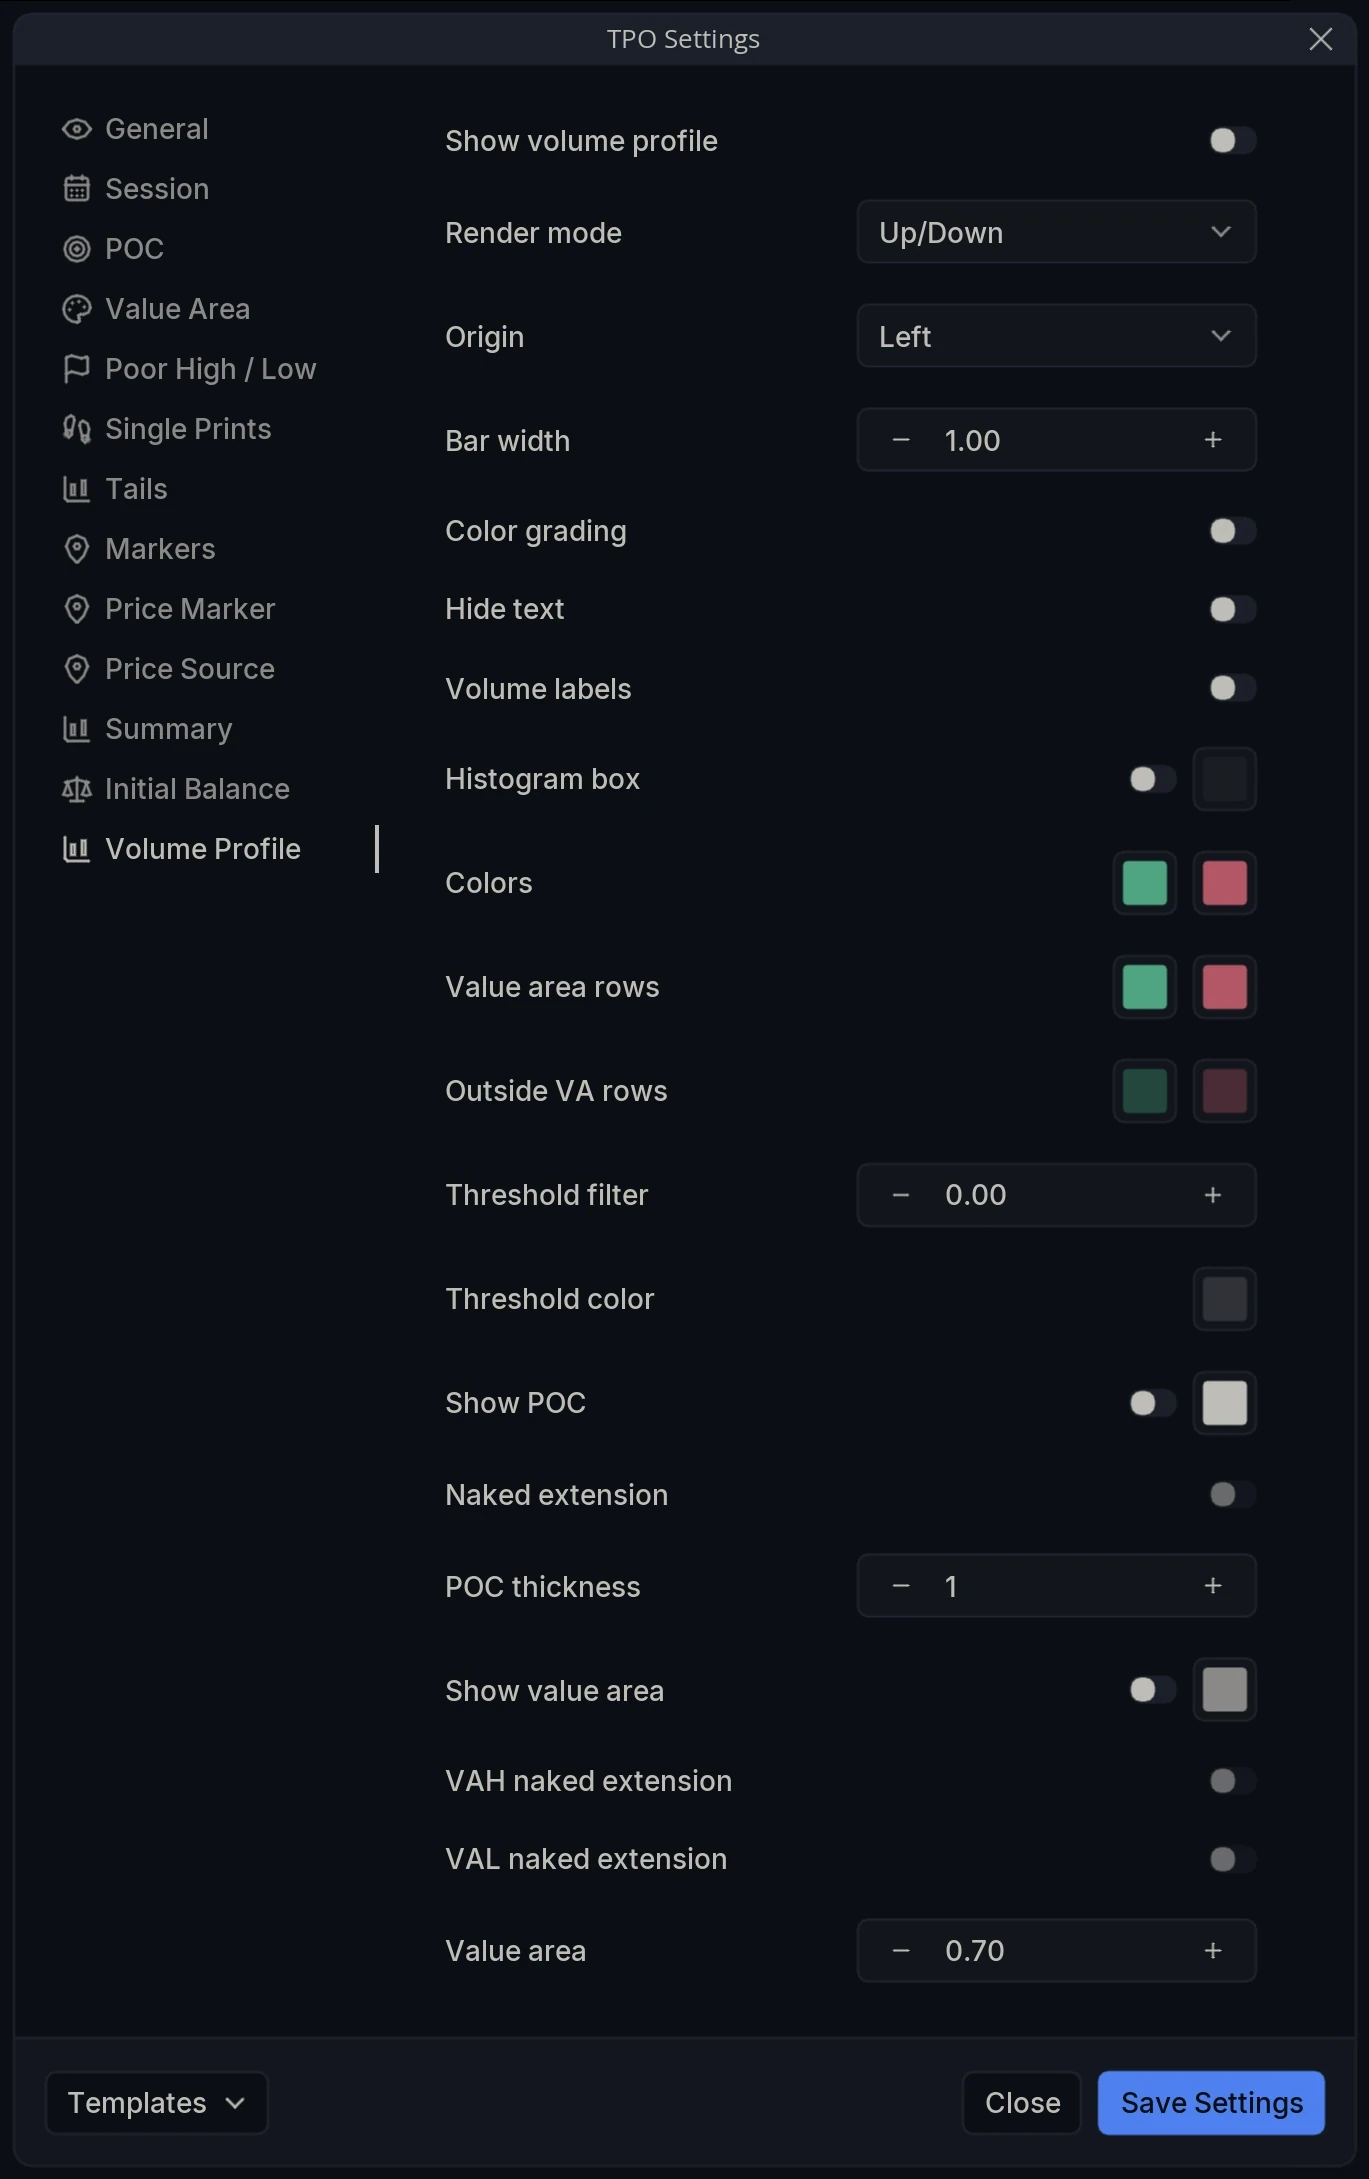
Show volume profile - Draw a volume distribution alongside the TPO profile.
Render mode - How volume is broken down, including Up/Down for buy and sell separation.
Origin - Which side the histogram is anchored to.
Bar width - Width of the histogram bars.
Color grading - Shade bars by magnitude.
Hide text - Suppress the numeric labels.
Volume labels - Show volume figures on the rows.
Histogram box - Draw a bounding box behind the histogram, with its color.
Colors - The up and down colors.
Value area rows / Outside VA rows - Separate color pairs for rows inside and outside the value area.
Threshold filter - The volume level a row must exceed to be highlighted.
Threshold color - color applied to every row above that threshold.
Show POC - Mark the volume profile’s own Point of Control, with its color.
Naked extension - Extend that POC forward until price returns to it.
POC thickness - Weight of the volume POC line.
Show value area - Mark the volume profile’s value area, with its color.
VAH naked extension / VAL naked extension - Extend the volume value area’s edges forward until price returns.
Value area - The percentage of volume the value area contains.
Templates
Note: Sessions are defined once for the whole terminal. To change the hours of a built-in session, or to add your own, open the terminal Settings and go to Sessions - every layer that works in sessions, TPO included, picks up the change.