What is a liquidation in trading?
By MichaelUpdated August 24, 2026
A liquidation is the forced closure of a leveraged position by the exchange, triggered when the trader's margin can no longer support it. A liquidations indicator plots those forced closures over time, separating long liquidations from short ones, so clusters of forced selling or buying become visible against price.
How do liquidations work?
Trading with leverage means borrowing against collateral. The exchange requires a minimum amount of equity to keep a position open, called maintenance margin. When the position moves against the trader far enough that equity falls below that threshold, the exchange closes the position for them. The trader has no say in it and no opportunity to add margin once the trigger is hit.
What makes this matter beyond the individual account is that a liquidation is not a normal trade. It is a market order that must fill, at whatever price is available, in whichever direction the position was wrong. A liquidated long is force-sold; a liquidated short is force-bought.
That creates a feedback loop. Forced selling pushes price lower, which pushes more longs below their maintenance margin, which forces more selling. When leverage is concentrated at similar levels, one liquidation triggers the next and the market cascades. These cascades produce the fastest and most violent moves in leveraged markets, and they end abruptly once the crowded positions have been cleared out, which is why heavy liquidation clusters so often mark a turning point rather than the start of a trend.
How do you read a liquidations indicator?
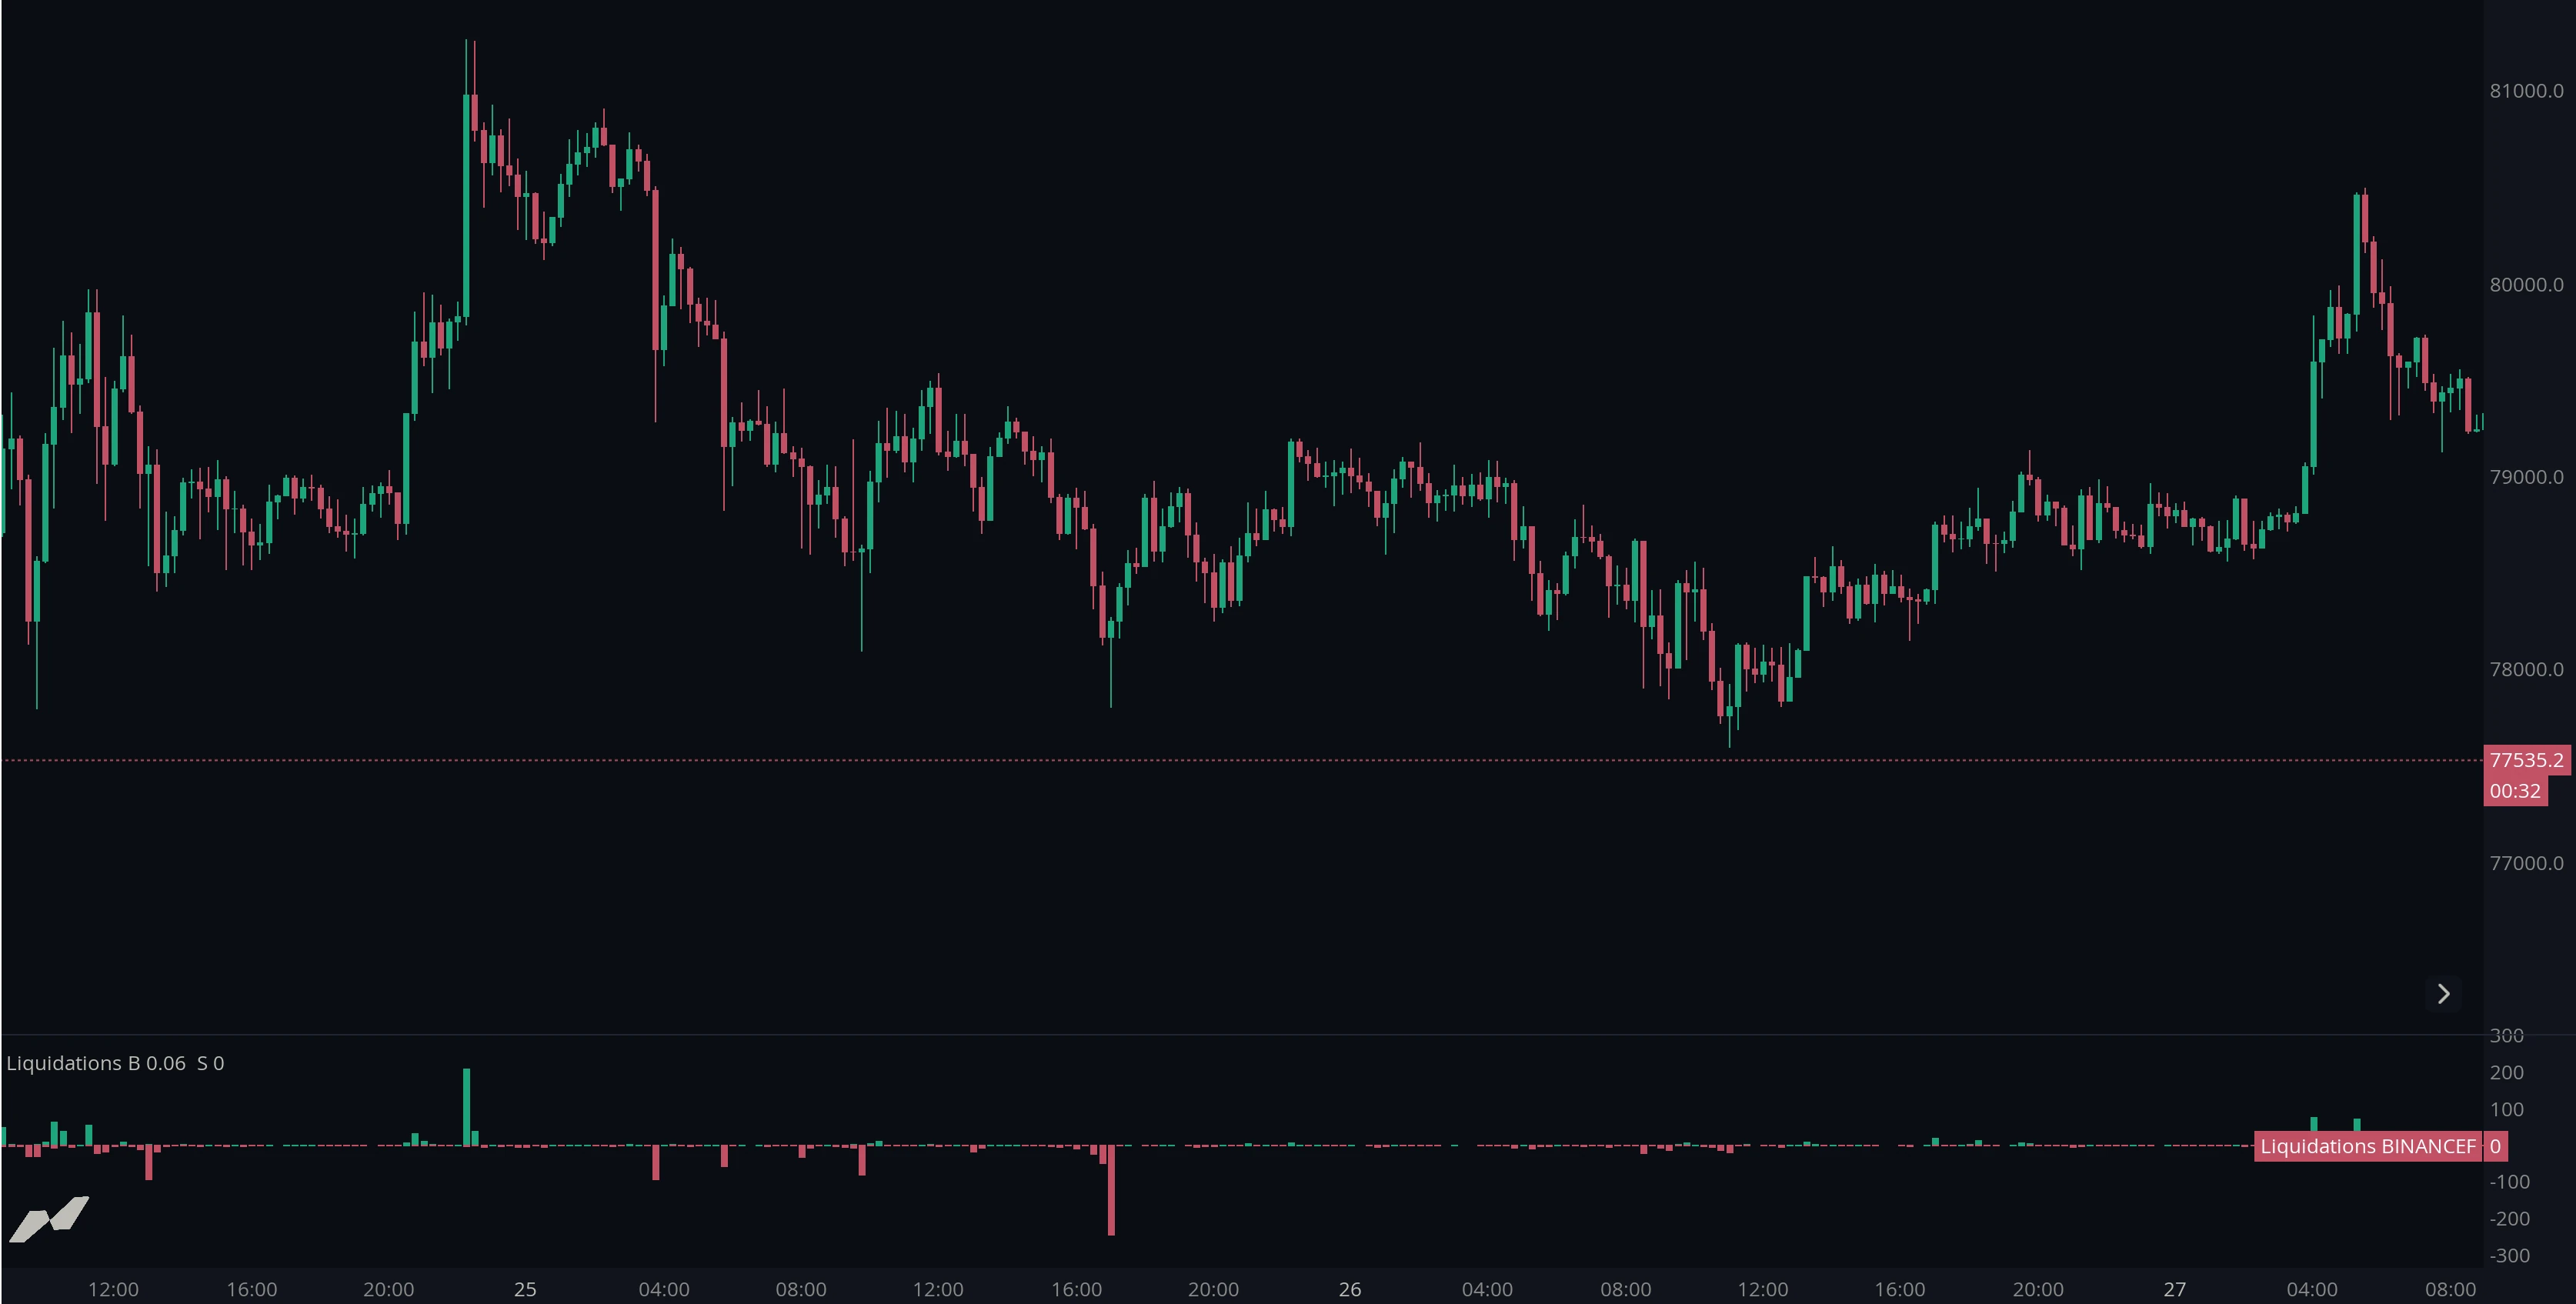
Liquidations are drawn as a histogram split around a baseline, and the side a bar sits on follows the pressure it created rather than the position that was closed. Short liquidations plot upward in the up color, because a liquidated short is force-bought and pushes price higher. Long liquidations plot downward in the down color, because a liquidated long is force-sold and pushes price lower. Bar height corresponds to the value liquidated in that period.
Read it for clusters rather than for individual events. A steady trickle of liquidations is normal in any leveraged market and carries little information. What matters is concentration: a large spike, or a run of consecutive heavy bars, means many positions were closed in a short space of time.
The direction tells you who was wrong. A large downward cluster is leveraged buyers being forced to sell, and that selling contributed to whatever fall you see on the chart above. A large upward cluster is leveraged sellers being forced to buy, which is what powers a violent squeeze higher.
The most useful reading is what happens after the cluster. A market that stops falling once heavy long liquidations subside has likely exhausted the forced selling, and the move down was substantially mechanical rather than a considered repricing.
Why do liquidations cause cascades?
Leverage tends to cluster. Traders using similar leverage on similar entries end up with maintenance margins at similar prices, so a single level can hold the liquidation points of a great many positions.
When price reaches that level, the first liquidations execute as market orders. Those orders move price further in the same direction, which reaches the next cluster of maintenance margins, which liquidates those positions too. Each round of forced closures supplies the aggression that triggers the next.
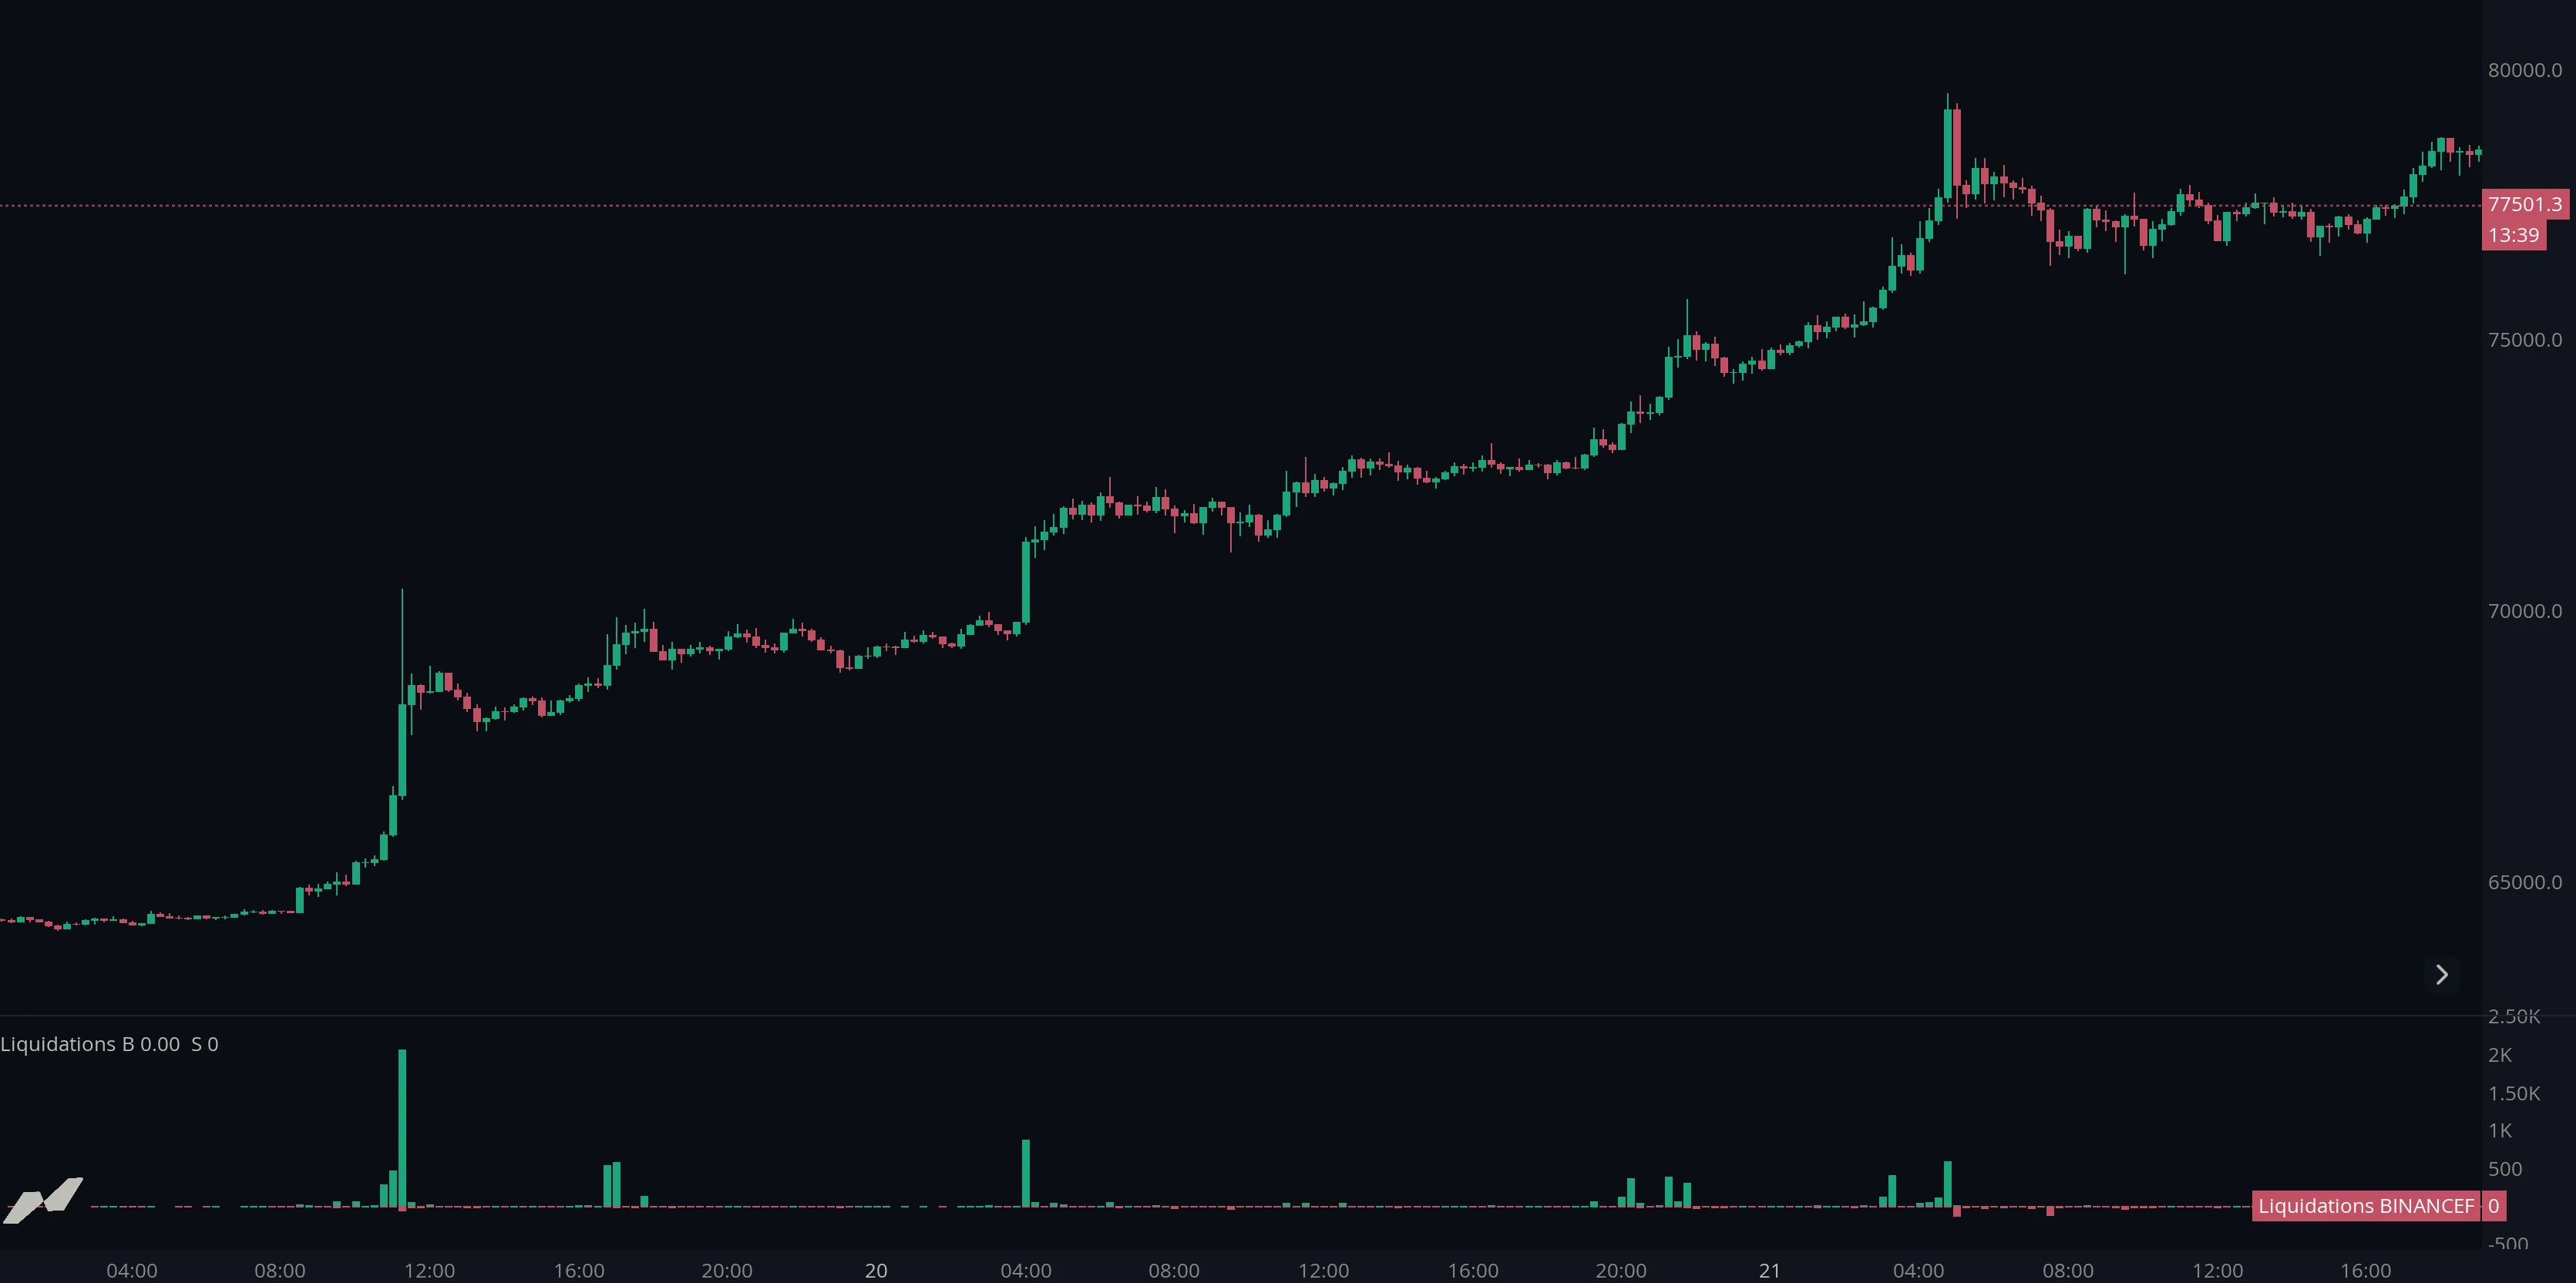
The cascade stops when the crowded positions are gone. Nothing is left to force, the aggressive flow ends abruptly, and price often reverses sharply because the move was driven by compulsion rather than by anyone deciding the asset was worth less.
Note: Liquidations only exist in leveraged markets. Spot markets have no margin requirement and therefore no forced closures, which is why a liquidations feed covers futures and perpetuals only.
What are the limits of liquidation data?
Liquidation data is genuinely useful but comes with caveats worth knowing.
Exchanges report differently. Liquidation engines are not standardized, and venues differ in how they unwind a position, whether they publish every event or a throttled sample, and how often they publish at all. Figures are not directly comparable between exchanges.
It is venue-specific. A liquidation feed only describes the exchange reporting it. Aggregating across venues gives a far better picture of how much leverage was actually flushed.
It is backward-looking. A liquidations indicator reports forced closures that have already executed. To see where liquidations are likely to occur next, you need a liquidation heatmap, which estimates where leveraged positions would be liquidated rather than where they already were.
Related: Liquidation heatmap · Volume · Open interest
Using liquidations in MMT
MMT tracks liquidation events across futures markets, separating long and short liquidations and totalling them per period. Data is processed with minimal delay, so events appear as the exchange publishes them.
How do you add liquidations to a chart?
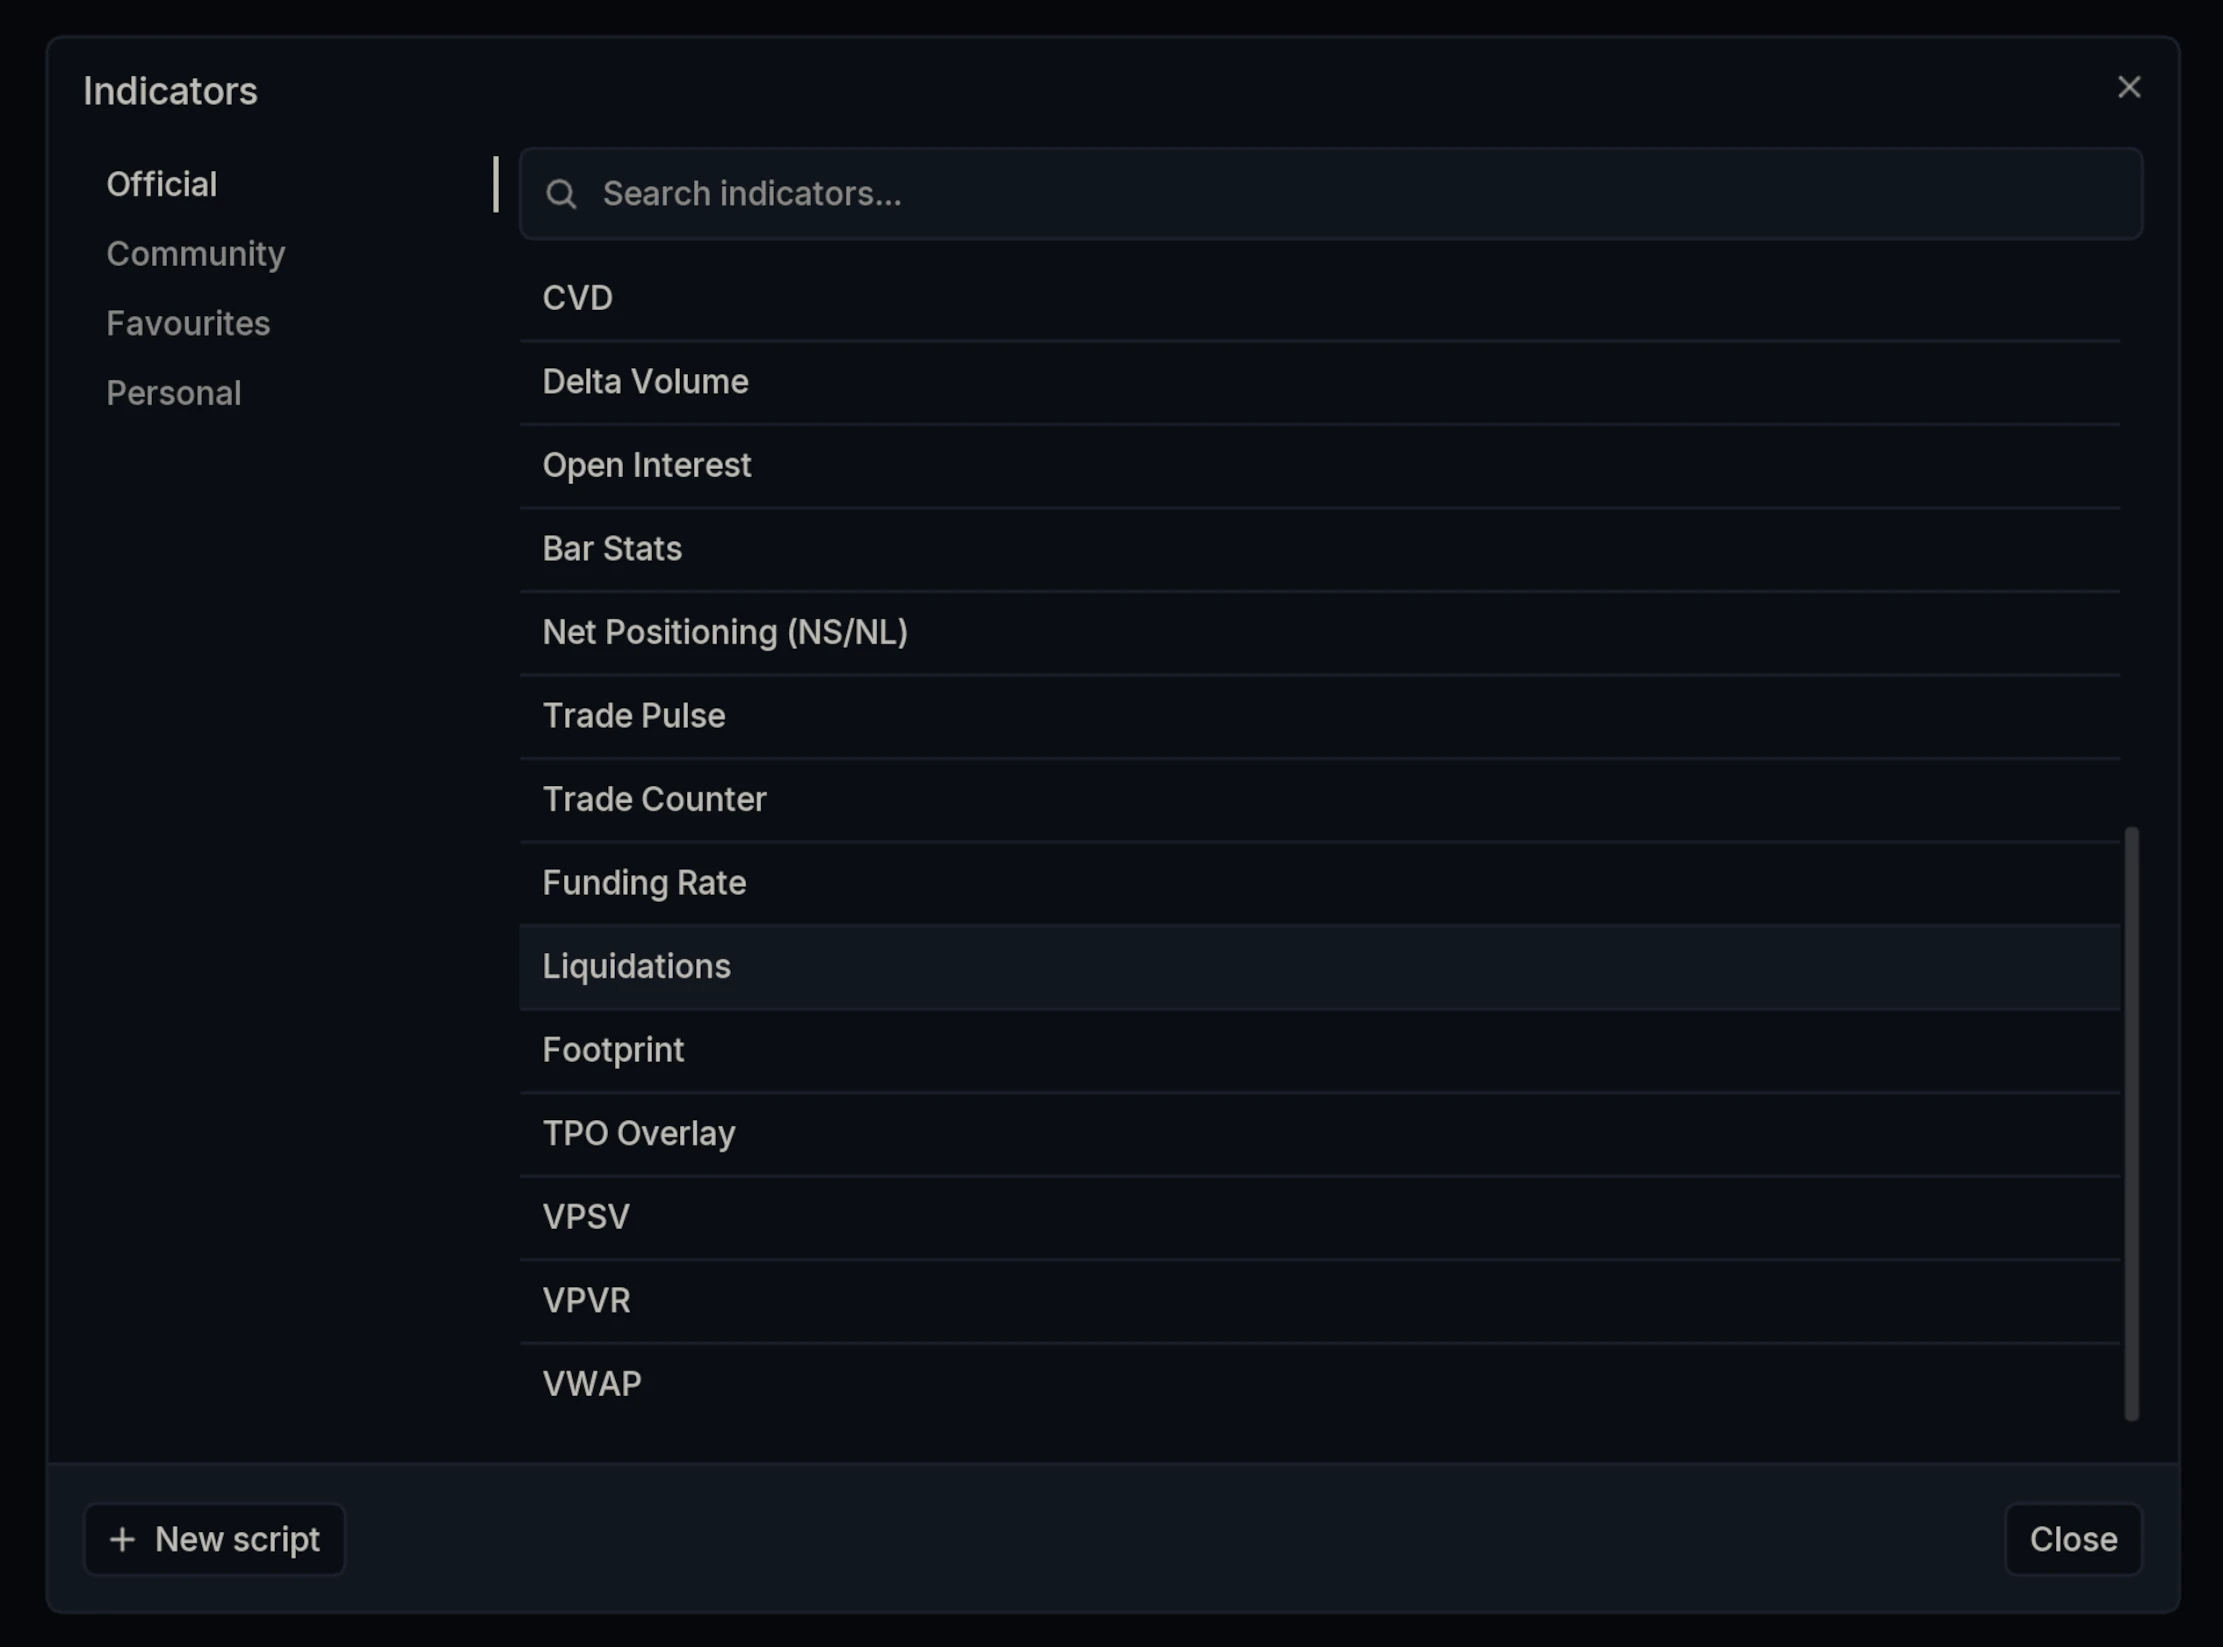
Open the Indicators dialog and select Liquidations under Official. It renders as a histogram in a panel below the price chart.
Layer Settings
Open Liquidations Settings via the cog wheel on the layer name. The panel has three tabs: Display, Price Marker and Aggregate.
Display
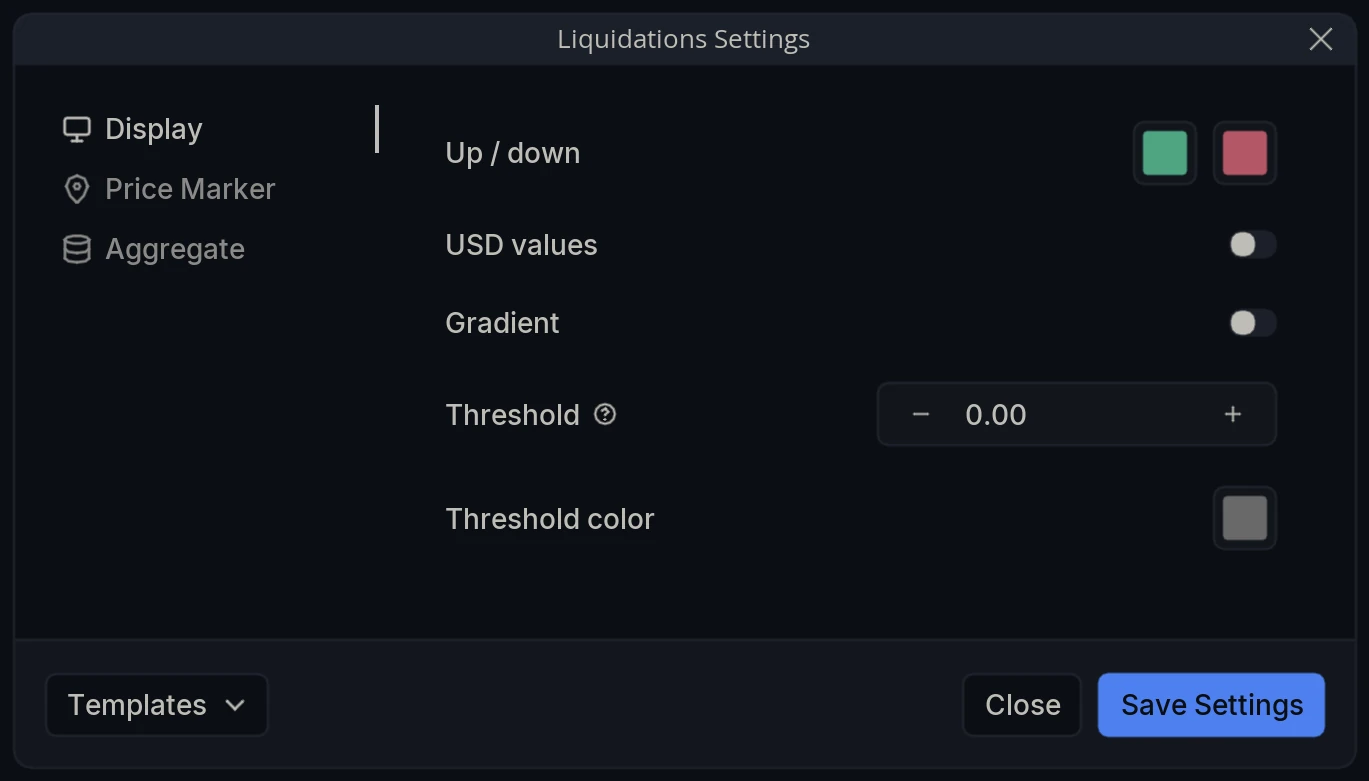
Up / down - The two colors used for the two sides. The up color marks short liquidations, which are force-bought and push price higher; the down color marks long liquidations, which are force-sold and push price lower.
USD values - Report liquidations in USD rather than in units of the base asset, which makes figures comparable across markets.
Gradient - Shade each bar by its value, so the largest liquidations render most strongly and smaller ones fade back. The same behavior as color grading on the volume profile layers.
Threshold - The value a liquidation event must exceed to be highlighted, so only significant events stand out from the routine flow. The figure is read in whichever unit is currently selected, coin or USD, per the USD values toggle above.
Threshold color - The color applied to events above that threshold.
Price Marker
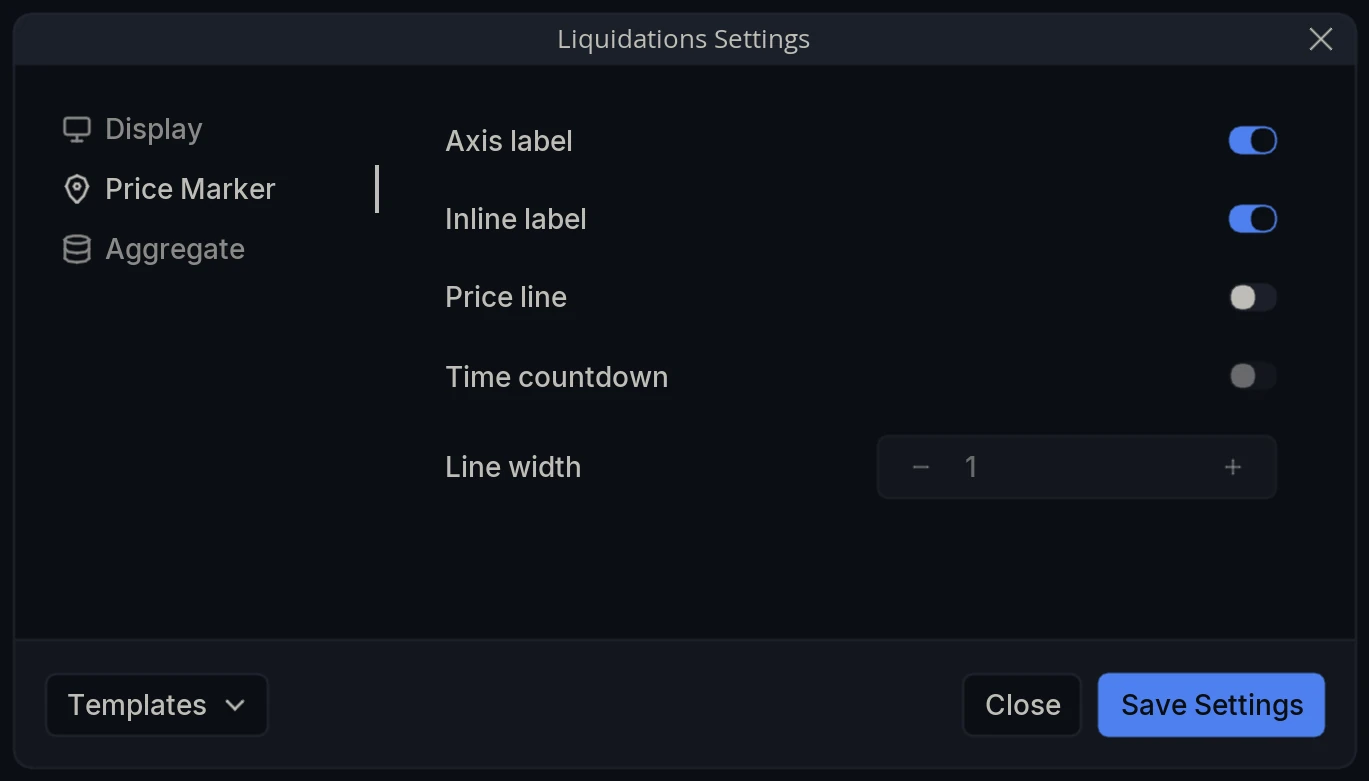
Axis label - Show the current value as a label on the panel’s axis.
Inline label - Show that value on the panel itself rather than on the axis.
Price line - Draw a horizontal line across the panel at the current value.
Time countdown - Show the time remaining until the current candle closes.
Line width - Thickness of that line.
Aggregate
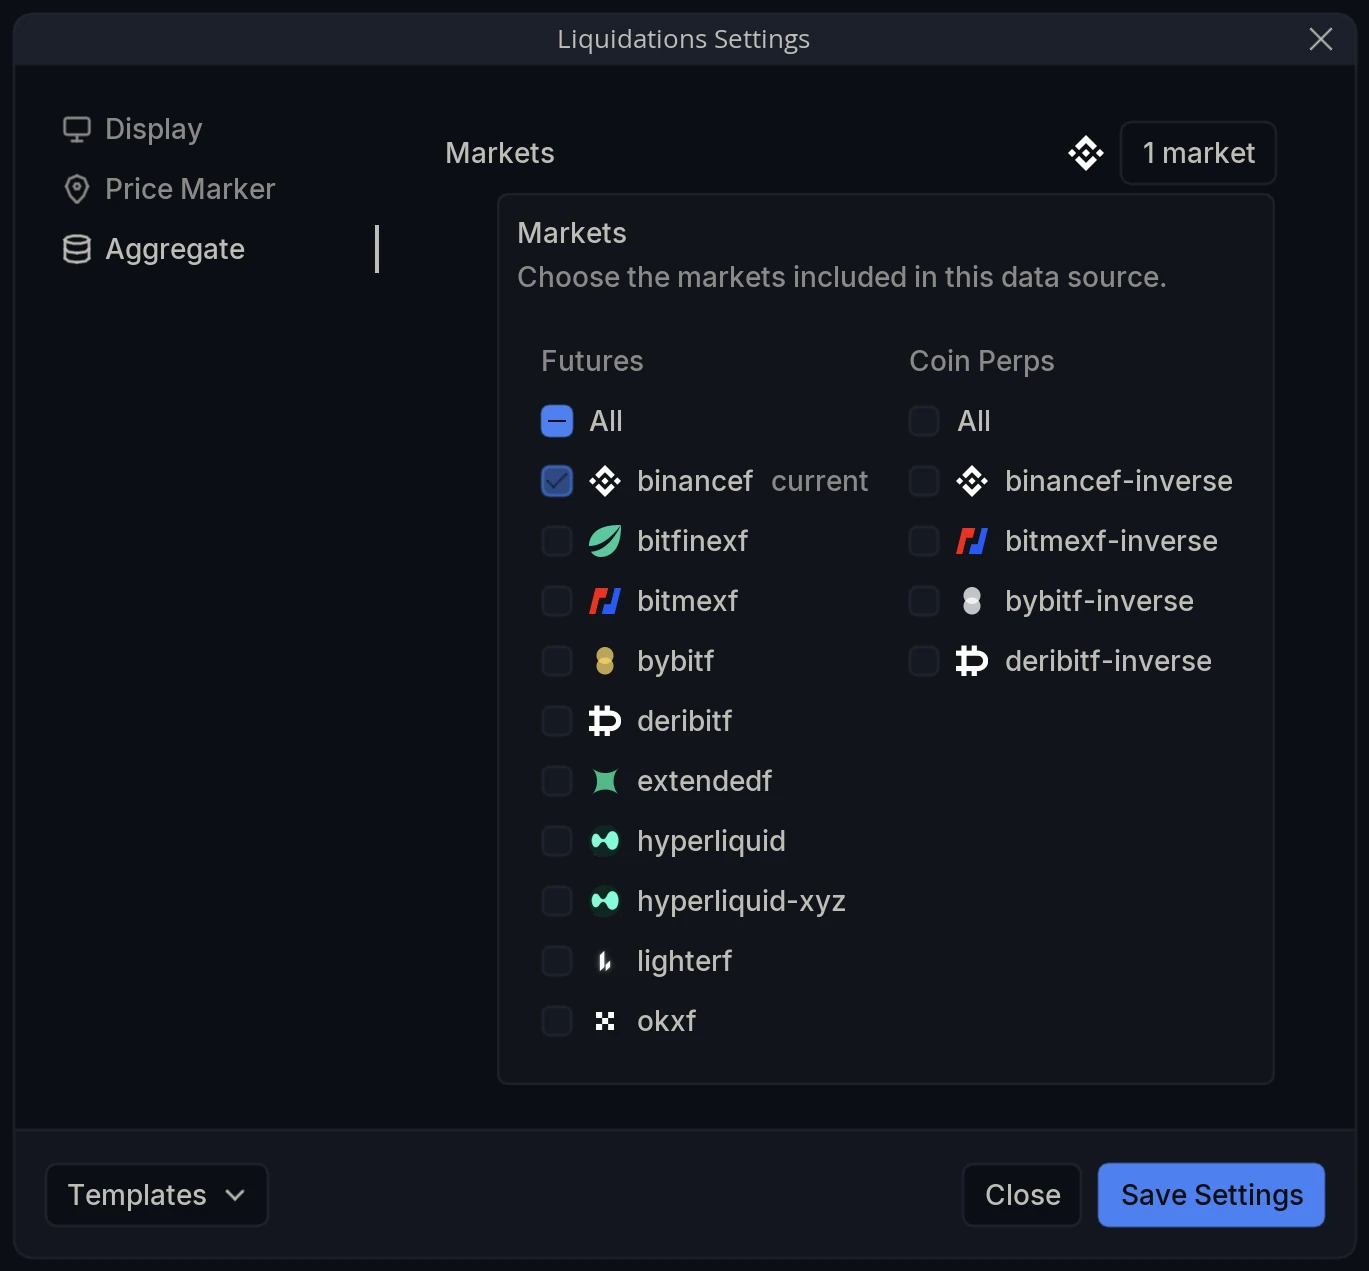
Markets - Choose the markets whose liquidations are counted. The selector offers Futures and Coin Perps only, with no Spot column, because spot markets have no leverage and therefore no liquidations. Your chart’s own market is tagged current.
Because exchanges publish liquidation data inconsistently, combining venues gives a much fuller picture of how much leverage was flushed than any single feed reports.