What is tape reading?
By MichaelUpdated August 26, 2026
Tape reading is the practice of watching individual trades as they execute, rather than waiting for them to be summarized into candles. Each print carries a price, a size and the side that crossed the spread, and the pattern of those arrivals describes what a market is doing right now.
How does tape reading work?
A market only moves when someone is impatient. Resting limit orders sit and wait; market orders cross the spread and take them. Every trade that prints is one of those crossings, and it carries three pieces of information: the price, the size, and which side was the aggressor.
That stream of executions is what traders call the tape, and it is the raw material every other order flow tool is built from. Volume is the tape summed. Volume delta is the tape split by side and netted. A footprint is the tape organized by price within a bar. All of them are compressions, and compression means detail is discarded.
Reading the tape itself skips the compression. Instead of a bar telling you that 400 traded over five minutes, you see the individual orders arriving: a run of small buys, then one large sell, then nothing for ten seconds. The shape of that arrival is information a finished candle cannot preserve, because by the time the candle closes it has been reduced to four prices and a total.
The traditional form is a scrolling list of executions, one line per print. The difficulty with a list is that it moves too fast to read in an active market and the numbers all look alike. A visual treatment solves that by making size and side immediately obvious, so the exceptional orders separate themselves from the routine ones without being read.
What does the tape show that a candle hides?
Rhythm. Steady, evenly spaced trades describe a different market from long silences broken by bursts. Both can produce the same candle.
Size distribution. A candle’s volume can be one large order or hundreds of small ones. On the tape you see which, immediately, and that distinction separates a single participant moving size from a crowd reacting together.
Which side is chasing. Sustained buying into a market that will not rise is aggression meeting resistance. Watching it happen tells you sooner than any indicator built on completed bars.
Reaction speed. When a level breaks, the tape shows whether the response was instant and heavy or slow and thin. That is often the difference between a break that holds and one that fails.
The caveat is that all of this is short-horizon information. The tape describes what is happening now. It cannot tell you about anything beyond the next few minutes, and it rewards attention rather than analysis.
What are the limits of tape reading?
It demands attention. The tape only exists while you are watching it. Look away and it is gone, which makes it unsuitable as the basis for anything you cannot monitor.
It is fast and it is noisy. Most of what arrives is routine. Reading it well means ignoring almost all of it, and that skill takes time to build.
It is venue-specific. One exchange’s tape is one exchange’s participants.
Size is not intent. A large market order tells you someone wanted it filled immediately. It does not tell you whether that was an entry, an exit, a hedge or a liquidation.
Related: Volume delta · CVD · Volume bubbles · Liquidations
Using Trade Pulse in MMT
MMT’s Trade Pulse renders the live tape directly on the price chart. Each market order arrives as its size in figures, colored by side and sized by how large it is, then travels across the chart and fades. The result is a tape you read by shape rather than line by line.
How do you add Trade Pulse to a chart?
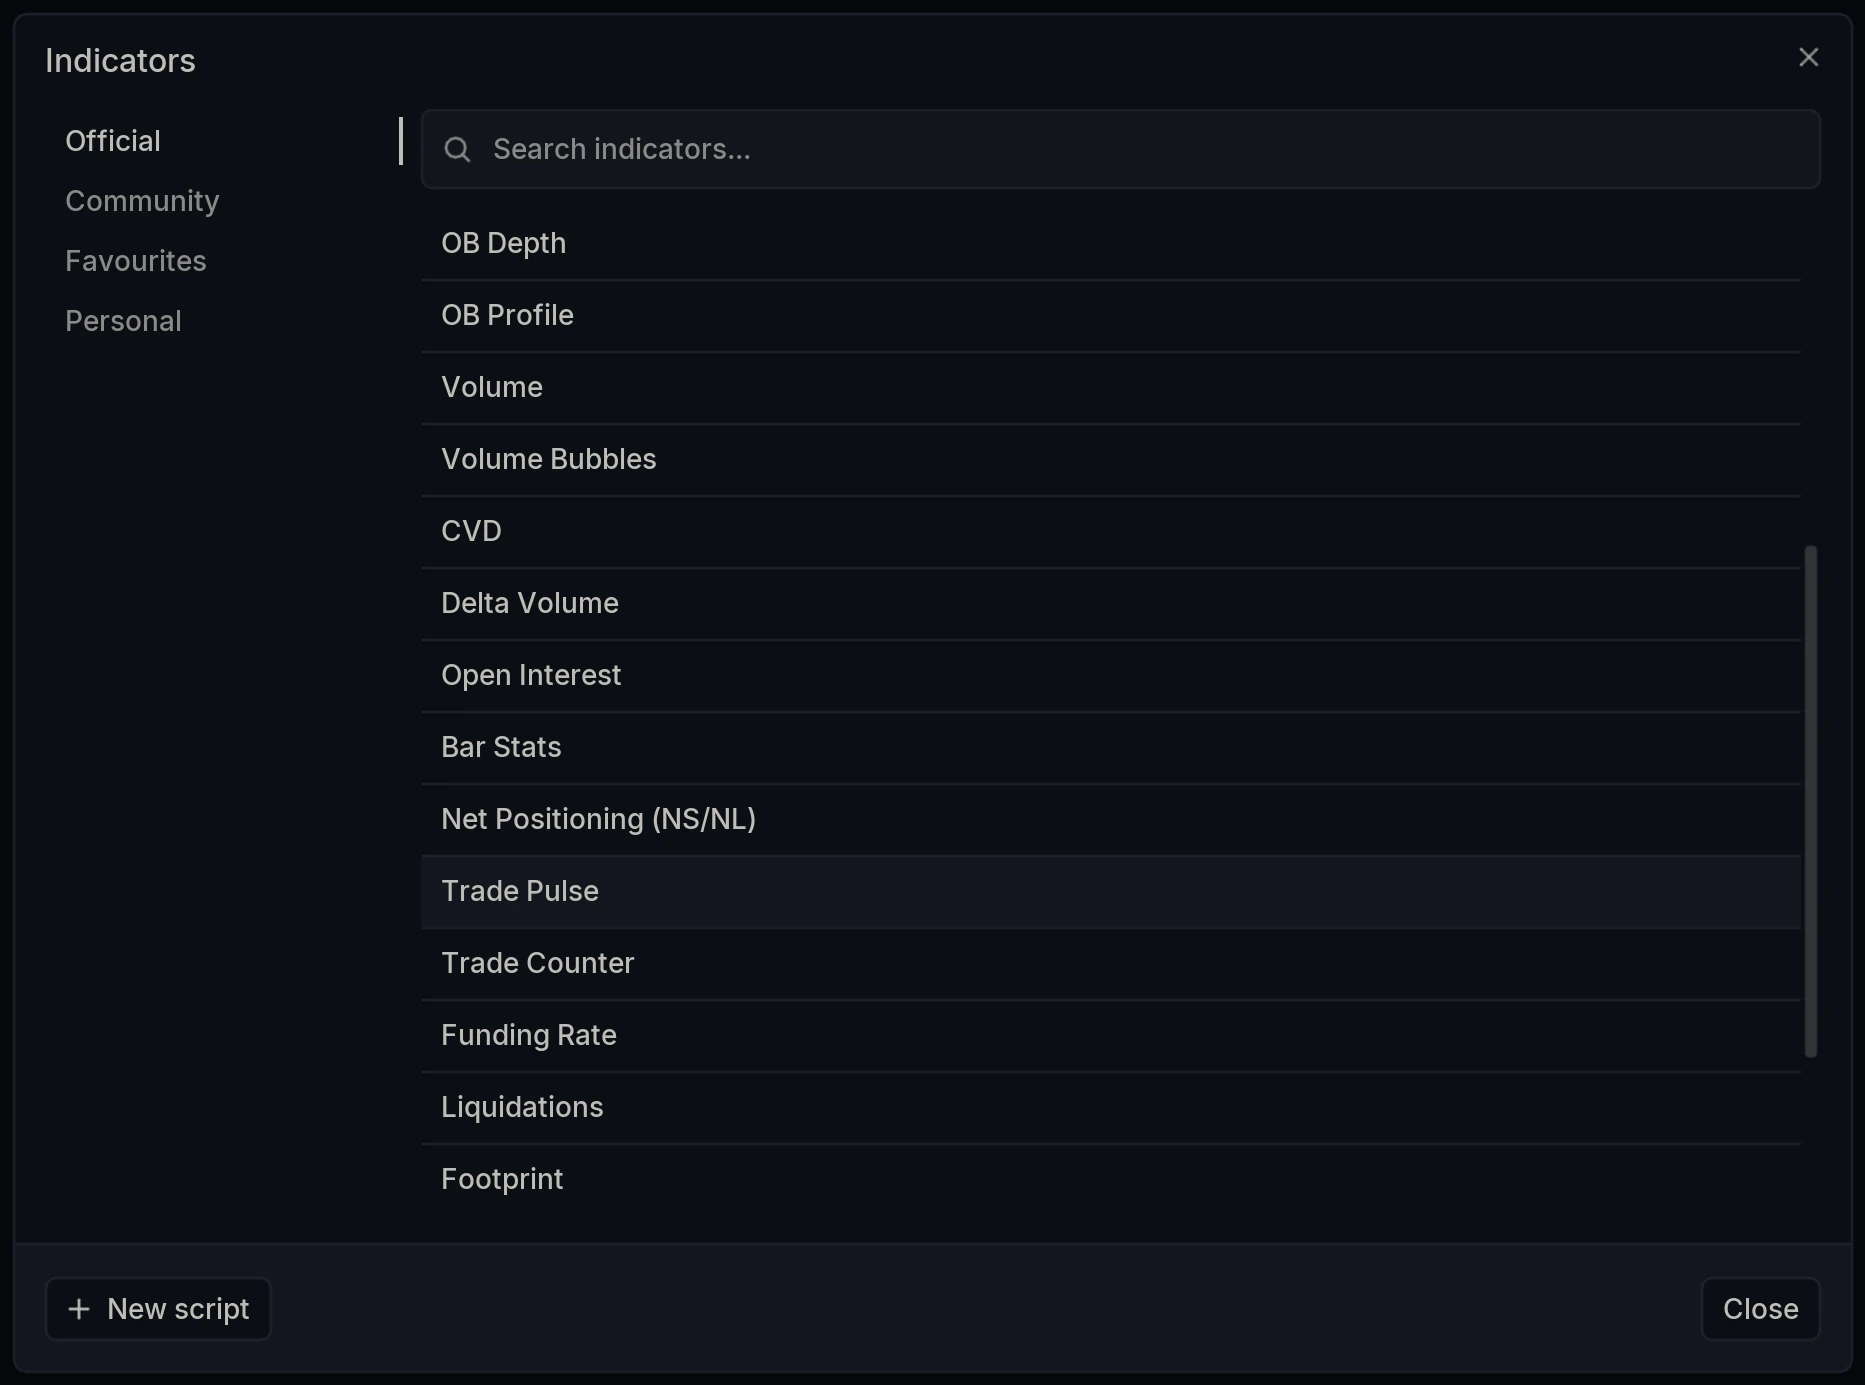
Open the Indicators dialog and select Trade Pulse under Official.
How does the pulse work?
Every trade that clears the filter spawns near the current price and flies toward a fixed destination on the chart, arriving over the course of a second or so before disappearing. Several are usually in flight at once.
Its size decides how it is drawn. Larger trades render in a larger font, scaled between Min font size and Max font size, so a big order announces itself without being read.
What counts as large is set by Scale window, a rolling period of one to thirty seconds. Trades arriving inside that window are sampled and scaled against each other, so the length of the window changes how honest the sizing is. At one second a pulse is only being compared with the last second of trading, which means an ordinary order arriving during a lull renders as though it were significant. At thirty seconds it is measured against a far broader sample, and the font size becomes a truer reflection of how that trade compares with recent activity.
The longer the window, the more proportional the scaling. A short window makes the display livelier and more reactive; a long one makes it more honest.
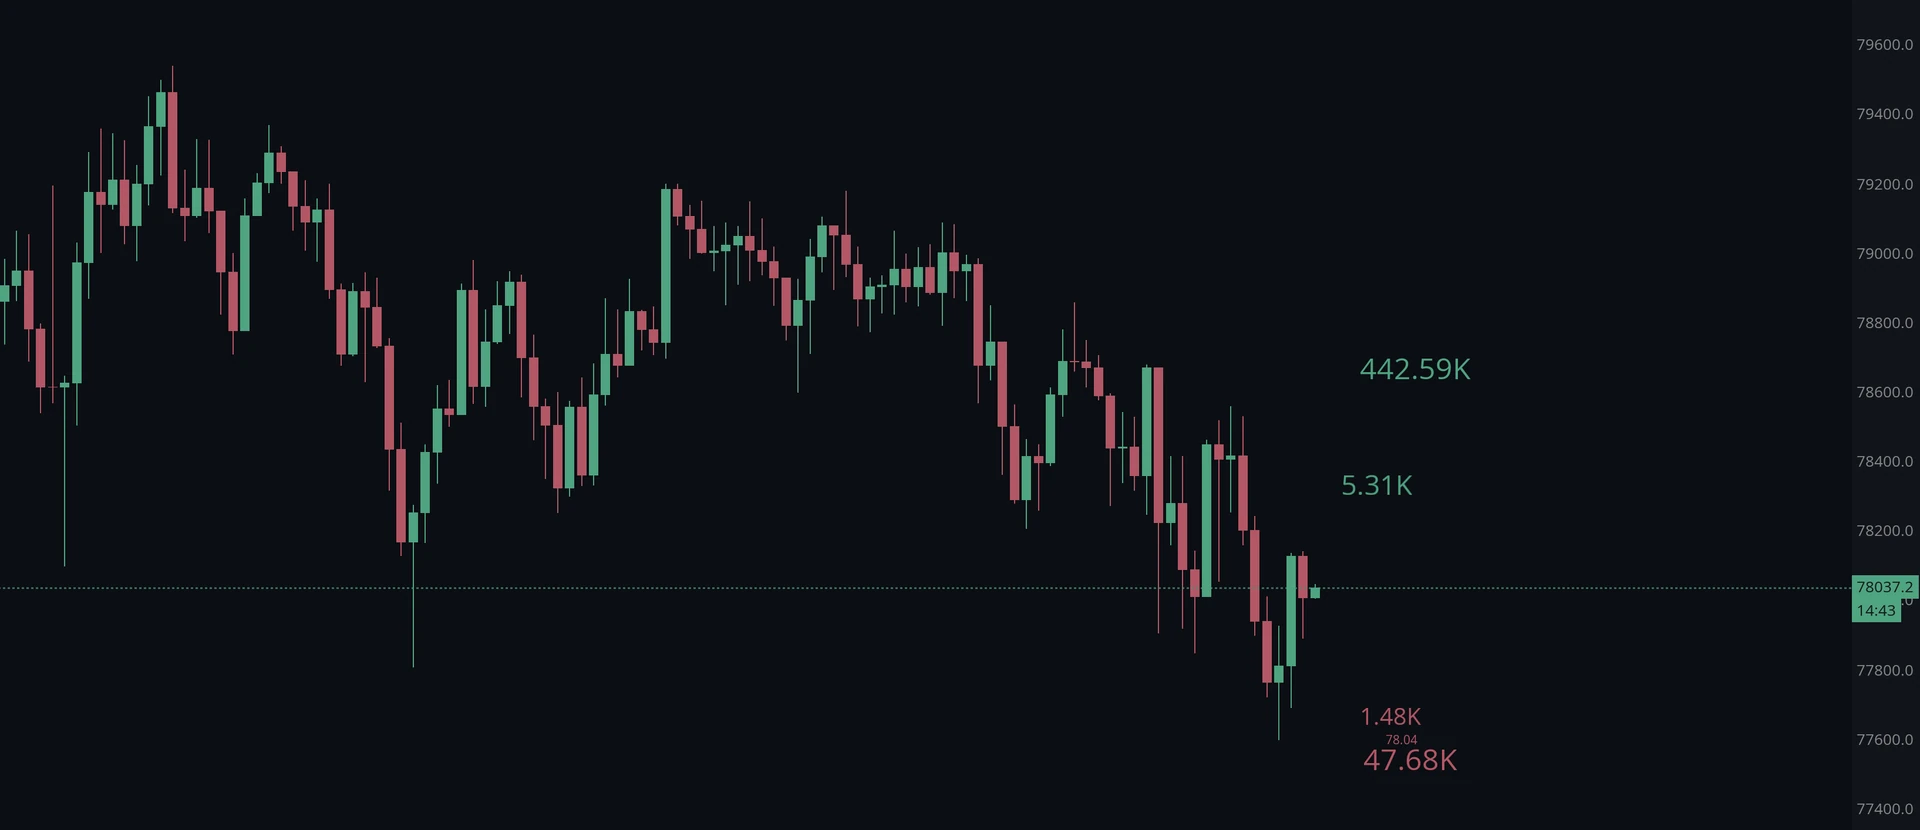
The figure sitting still at the destination is the Static display. It is not one of the trades in flight, and it can show one of two things.
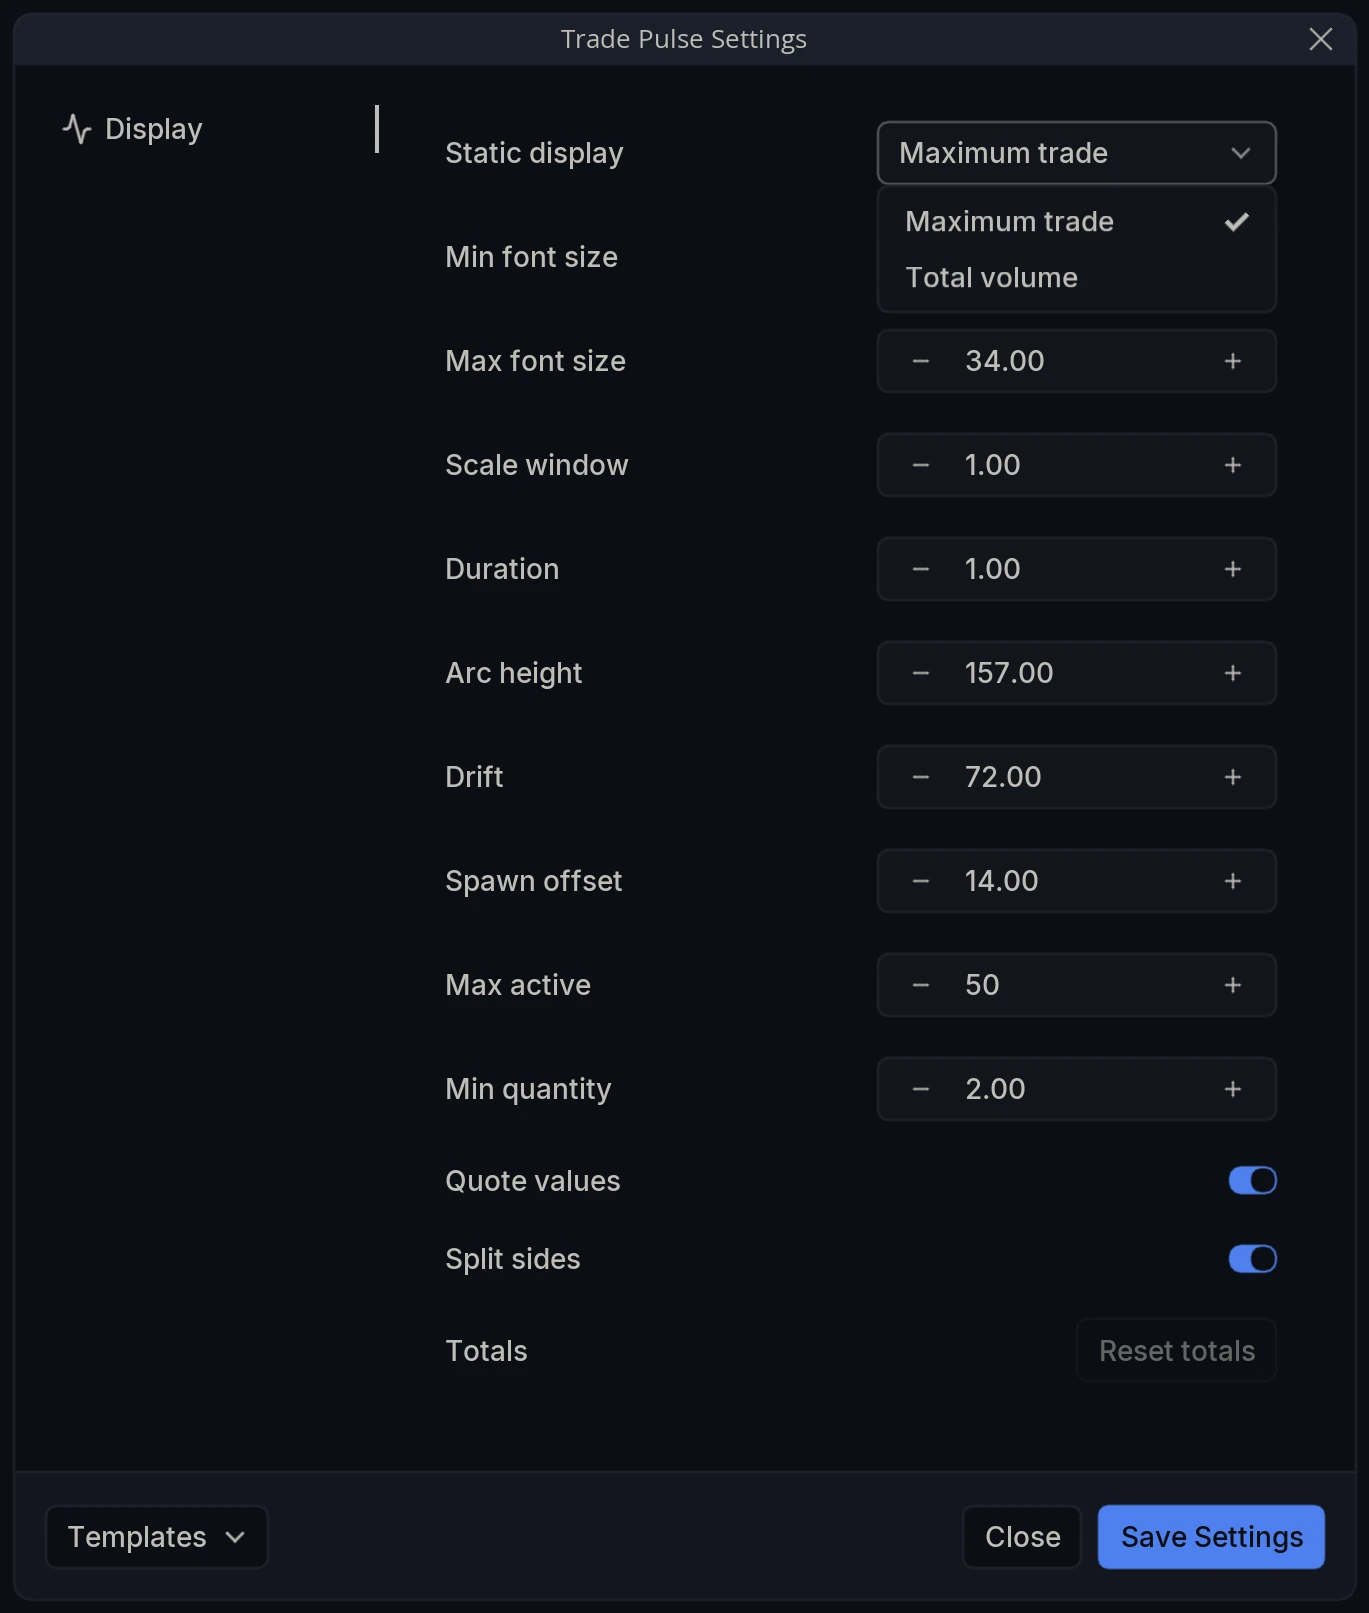
Maximum trade holds the largest trade seen and keeps it there until something bigger replaces it. That gives you a high-water mark alongside the live stream, so you can tell whether the order that just went past was genuinely large or merely large-looking.
Total volume accumulates instead, so the figure counts everything that has arrived rather than singling out one print. Split across the two sides, that turns the destinations into a running tally of how much has been bought against how much has been sold.
The two answer different questions. Maximum trade asks whether anyone big is here; total volume asks which side has done more.
Which side is which?
Split sides separates the two directions vertically: buys travel above, sells below. Turned off, everything runs along the same path.
Splitting them is worth leaving on. It turns the layer into a live picture of which side is doing the taking, since a busy upper track and an empty lower one is aggressive buying at a glance, no reading required.
How do you filter out the noise?
Min quantity sets the smallest trade that will be drawn. Everything below it is ignored entirely.
This is the setting that decides what the layer is for. At zero you see everything, which in an active market is a great deal of movement. Raised, the small orders disappear and only size remains, which turns the pulse from a picture of overall activity into a monitor for large participants.
Max active caps how many figures can be on screen at once, which keeps the display readable when the tape is busiest.
Tuning the animation
The remaining settings shape the movement itself rather than the data. Duration is how long a trade takes to travel from spawn to destination in seconds, Arc height how far it curves on the way, Drift how far it travels, and Spawn offset where it starts relative to price. None of them change what is shown, only how it moves, and they exist so the layer can be made calm or lively to taste.
Which side is which?
Split sides separates the two directions vertically: buys travel above, sells below. Turned off, everything runs along the same path.
Splitting them is worth leaving on. It turns the layer into a live picture of which side is doing the taking, since a busy upper track and an empty lower one is aggressive buying at a glance, no reading required.
How do you filter out the noise?
Min quantity sets the smallest trade that will be drawn. Everything below it is ignored entirely.
This is the setting that decides what the layer is for. At zero you see everything, which in an active market is a great deal of movement. Raised, the small orders disappear and only size remains, which turns the pulse from a picture of overall activity into a monitor for large participants.
Max active caps how many figures can be on screen at once, which keeps the display readable when the tape is busiest.
Tuning the animation
The remaining settings shape the movement itself rather than the data. Duration is how long a trade takes to travel from spawn to destination in seconds, Arc height how far it curves on the way, Drift how far it travels, and Spawn offset where it starts relative to price. None of them change what is shown, only how it moves, and they exist so the layer can be made calm or lively to taste.
Layer Settings
Open Trade Pulse Settings via the cog wheel on the layer name. The panel has a single tab: Display.
Display
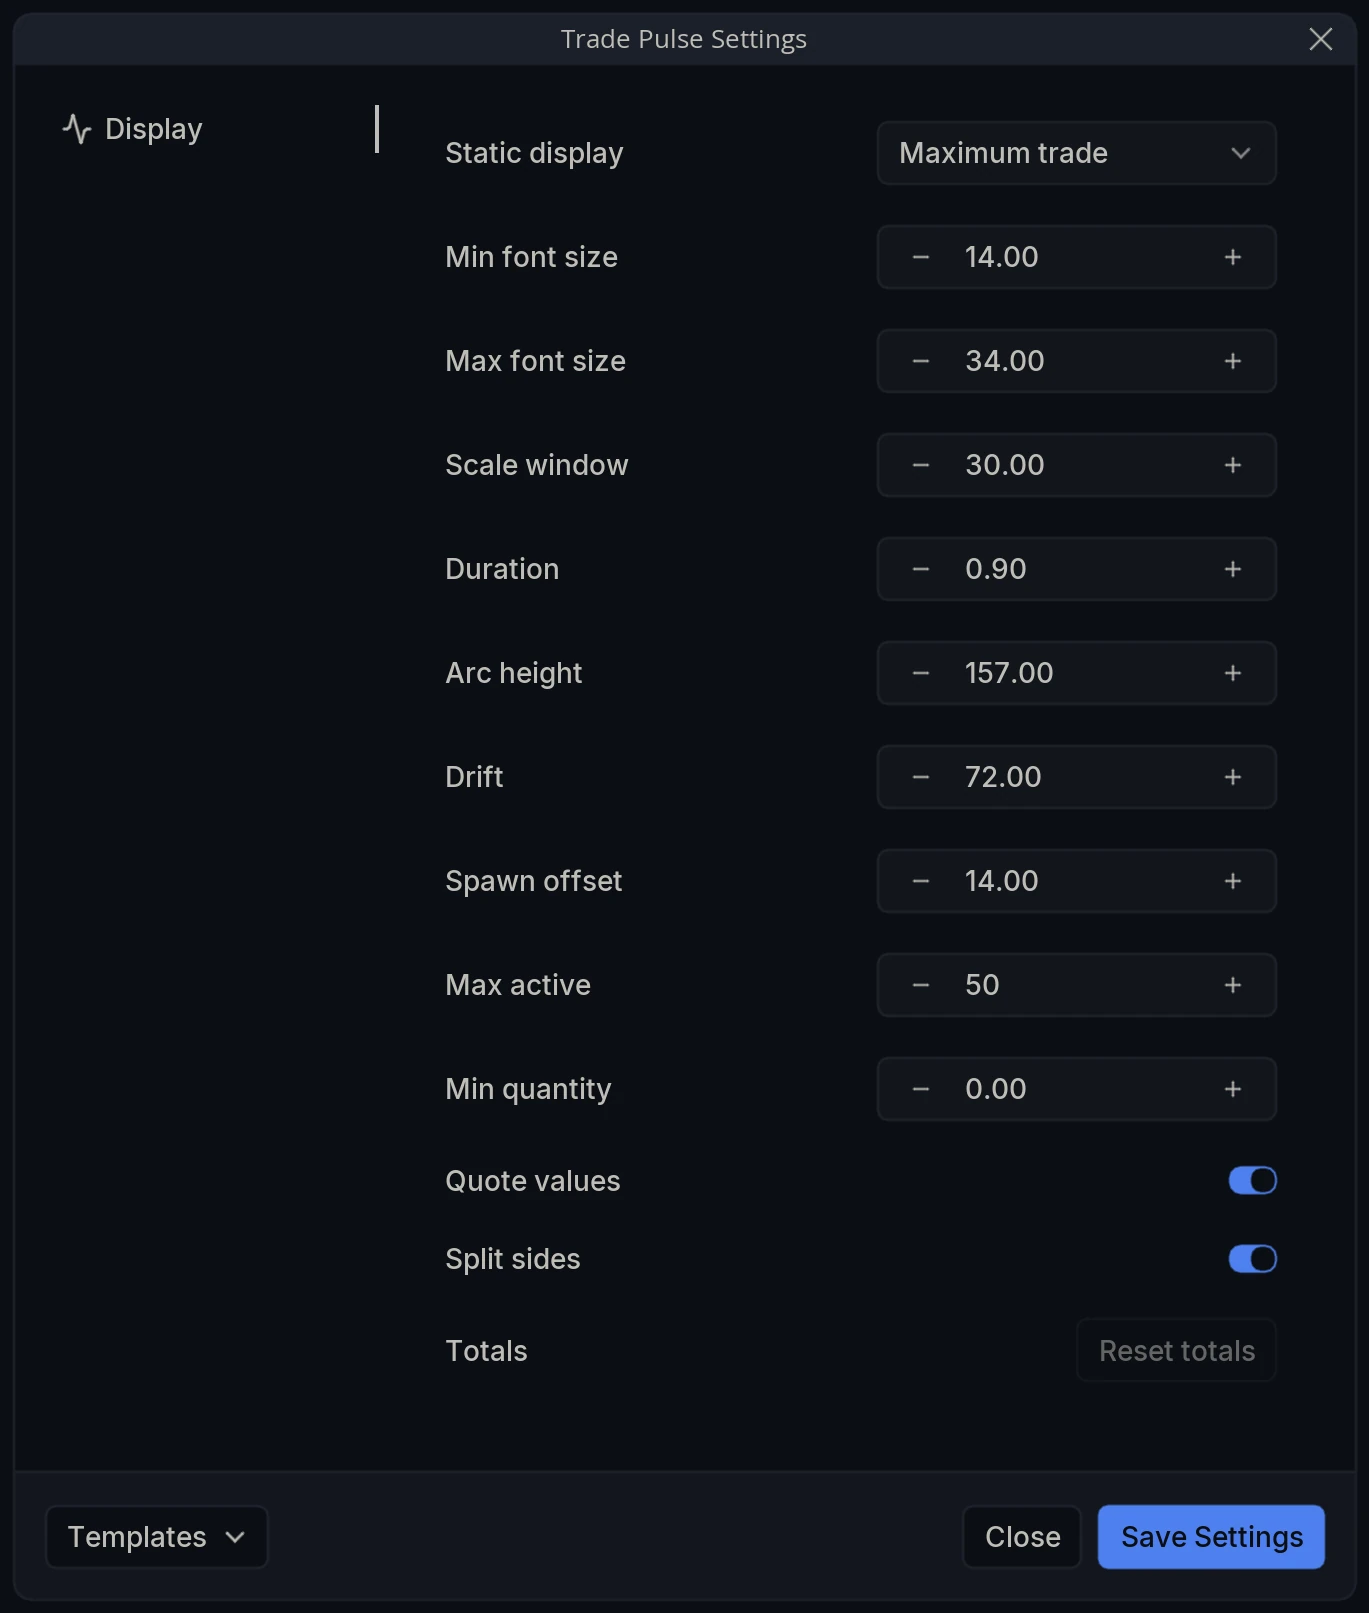
Static display - What the fixed figure at the destination shows. Set to Maximum trade it holds the largest trade seen and is replaced when a bigger one arrives.
Min font size - The size the smallest drawn trades render at. 14.00 by default.
Max font size - The size the largest render at. 34.00 by default.
Scale window - The window used to decide what counts as large when scaling between the two font sizes. 30.00 by default.
Duration - How long each trade takes to travel from spawn to destination, in seconds. 0.90 by default.
Arc height - How far the path curves on the way. 157.00 by default.
Drift - How far each figure travels. 72.00 by default.
Spawn offset - Where a figure appears relative to price. 14.00 by default.
Max active - The maximum number of figures on screen at once. 50 by default.
Min quantity - The smallest trade that will be drawn. Everything below it is ignored. 0.00 by default, which draws everything.
Quote values - Report sizes in the quote currency rather than in units of the base asset.
Split sides - Send buys above and sells below. Turned off, both run along the same path.
Totals - Reset totals clears the accumulated figures the display is working from, including the standing maximum.