What is open interest at price?
By MichaelUpdated August 27, 2026
Open interest at price shows where positions were opened and closed within a candle, level by level, instead of as one figure for the whole bar. Combined with net long and net short data at the same granularity, it shows not just that positioning changed but at exactly which price.
How does open interest at price work?
A footprint breaks a candle into rows and puts the buying and selling that happened at each price into its own cell. That is the structure. What fills the cells is a separate question, and volume is only the most obvious answer.
Put position data in those cells instead and the chart answers something different. Each row now carries how much open interest changed at that price, or how many net longs, or how many net shorts. The candle stops being a record of what traded and becomes a record of what was taken on and given up, priced level by level.
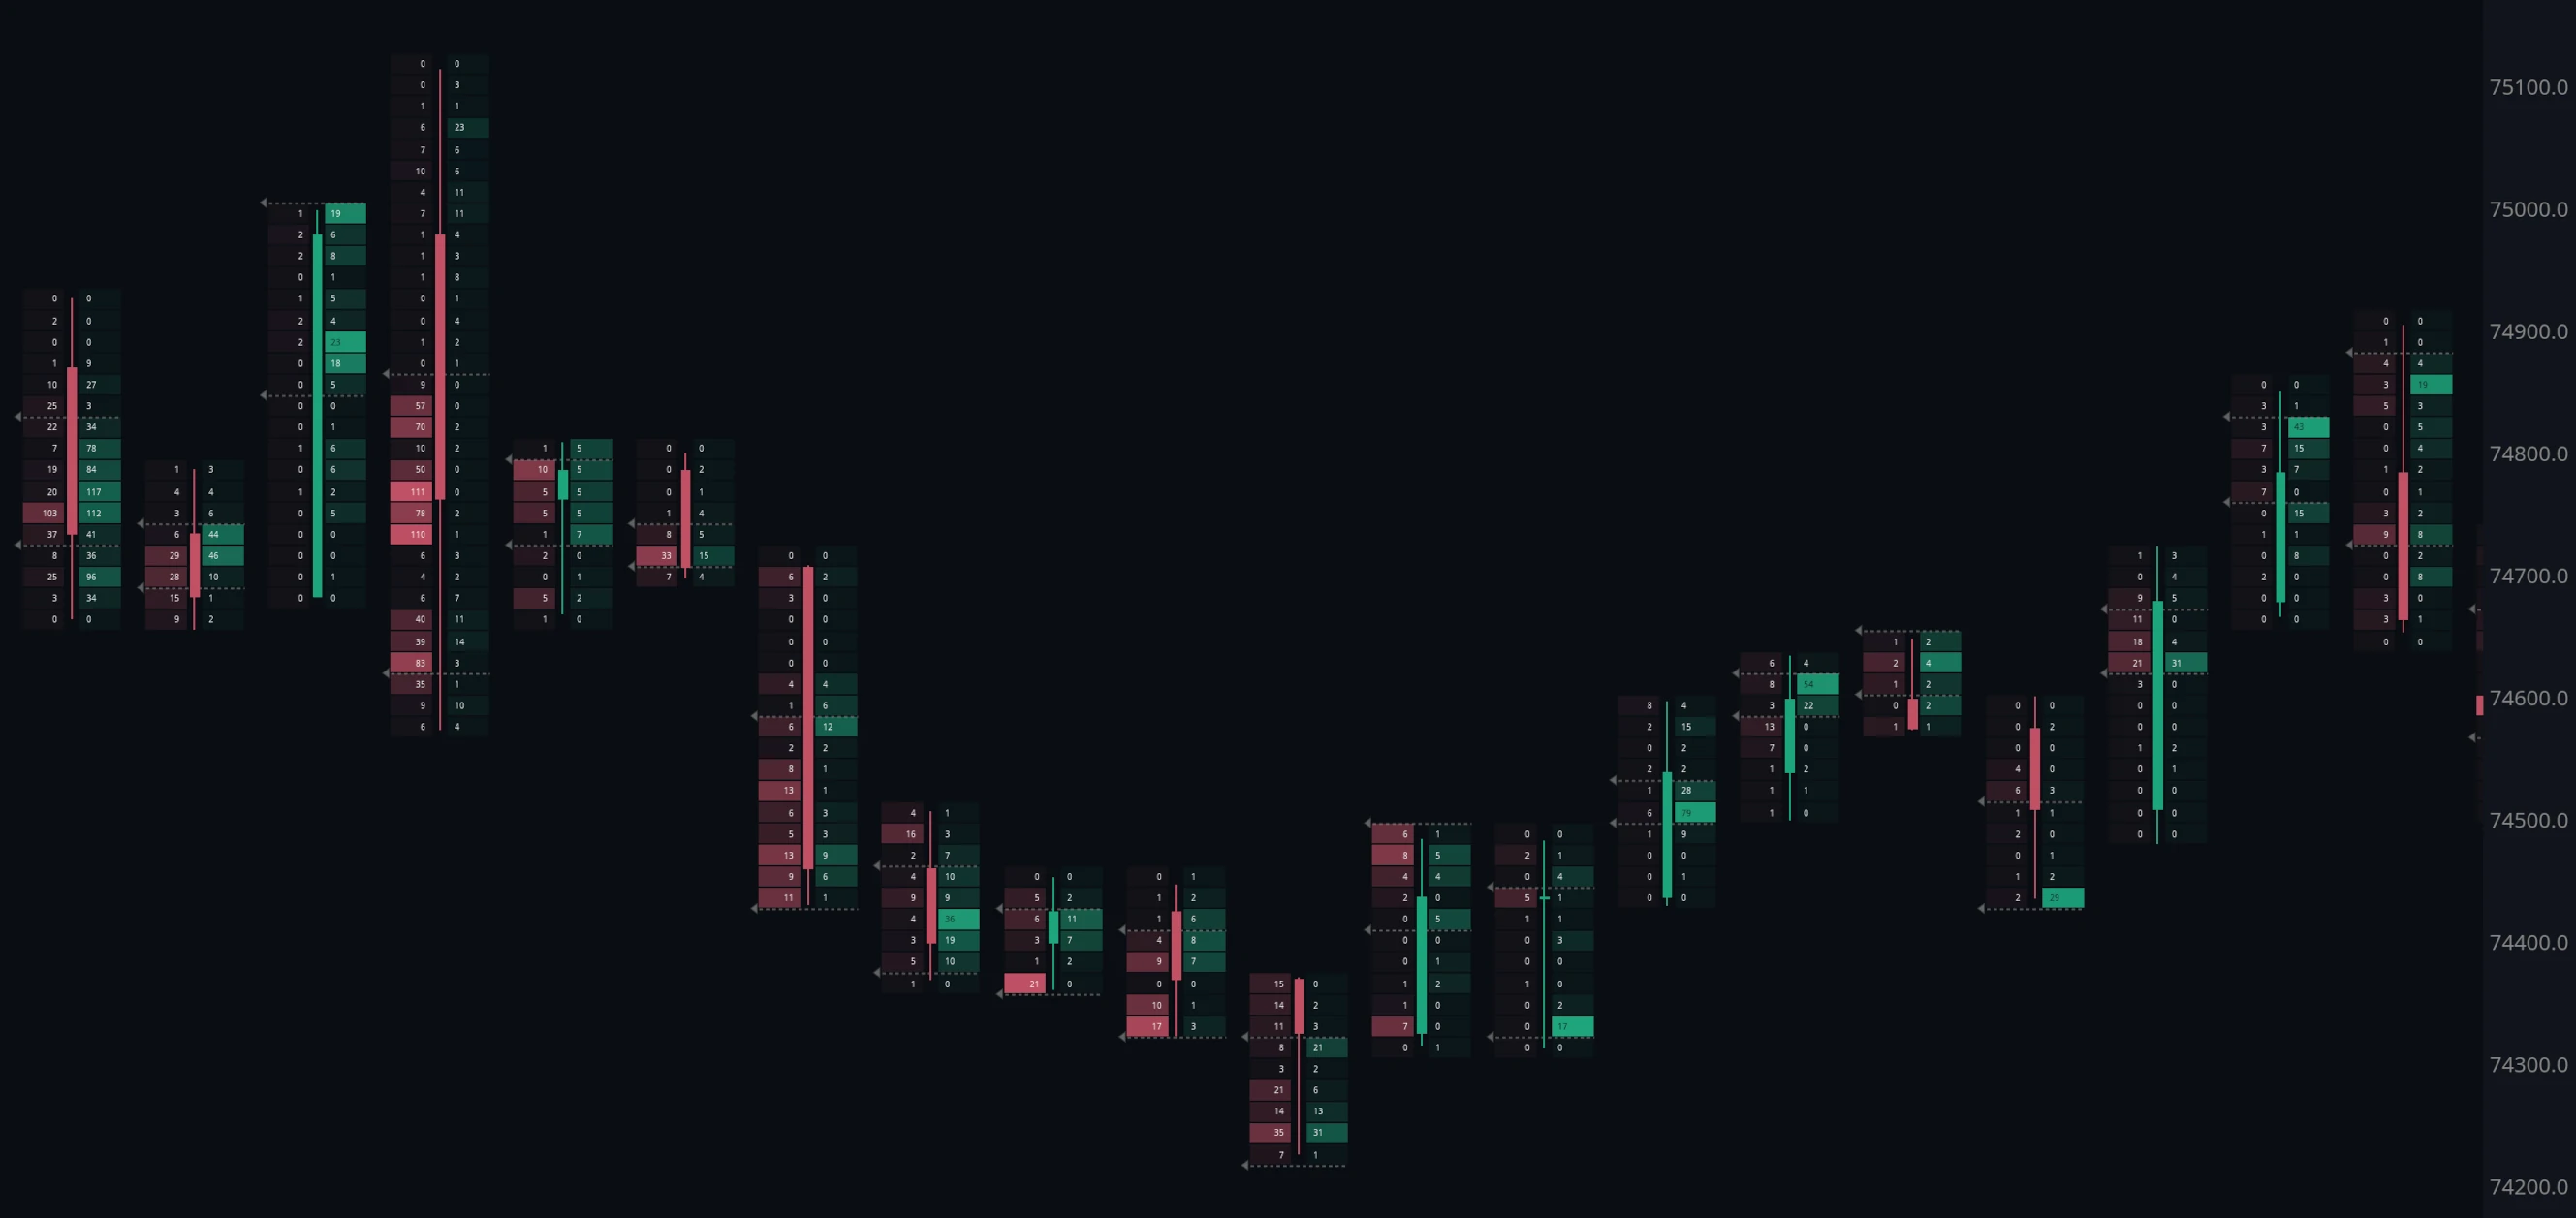
The difference from a per-bar figure is the whole point. Open interest reported once per candle tells you the market ended the period holding more exposure or less. It cannot tell you where inside the bar that happened, and inside a bar that spanned a wide range those are very different statements. Positions built at the low of a sharp drop and positions built at the high are opposite events that produce an identical bar-level number.
Why does per-level positioning matter?
Because a level is actionable and a bar is not.
It locates the risk. If new longs were opened across a specific band of prices, that band is where those positions sit. It is where their stops cluster and where they become uncomfortable, which makes it a level worth marking whether or not you agree with them.
It separates opening from closing at the same price. A price that saw heavy trading might have been where positions were built or where they were unwound. Volume alone cannot tell you; open interest at that level can.
It shows who was doing it. Net longs and net shorts split the same measurement by side. Open interest rising at a price tells you exposure was created there; the net long and net short views tell you which side created it.
It qualifies the extremes. Heavy new shorting into a low is a different market from heavy short covering into the same low, and the two produce similar-looking candles.
Read across several bars, the pattern is where positioning is accumulating. That is a considerably more specific piece of information than a rising open interest line, because it comes with prices attached.
Why is this data rare?
Most exchanges do not publish position data at this granularity. They report open interest as a periodic snapshot, usually one figure per interval for the whole market, which is enough to plot a line and not enough to place anything at a price.
Reconstructing it per price level requires processing every individual trade as it happens and tracking what each one did to the outstanding position count. That means running infrastructure against the venue directly rather than polling a summary endpoint, and it only works where the venue exposes enough per-trade detail to make the reconstruction possible.
That combination is uncommon, which is why per-bar open interest is widely available and per-level open interest is not.
What are the limits?
It is venue-specific by nature. This data exists for the venues where it can be reconstructed. It is not a market-wide picture and should not be read as one.
It inherits footprint’s constraints. Row height governs the reading, the chart is unreadable zoomed out, and it is a tool for examining an area rather than scanning.
Positioning is not intent. New longs at a price are new longs whether they belong to a directional bet, a hedge or a market maker offsetting elsewhere.
Related: Footprint · Open interest · Net positioning · Volume delta
Using the Hyperliquid footprint layers in MMT
MMT reconstructs this data by running its own Hyperliquid node and processing every trade, which is what makes level-by-level position data possible at all. Other venues do not expose per-trade detail at this granularity, so the layers are Hyperliquid-only.
Three layers share the footprint structure and differ only in what fills the cells:
Footprint Hyperliquid OI puts the change in open interest at each price. Positive where positions were created, negative where they were closed.
Footprint Hyperliquid NL puts net longs at each price, so you see where long exposure was built and unwound.
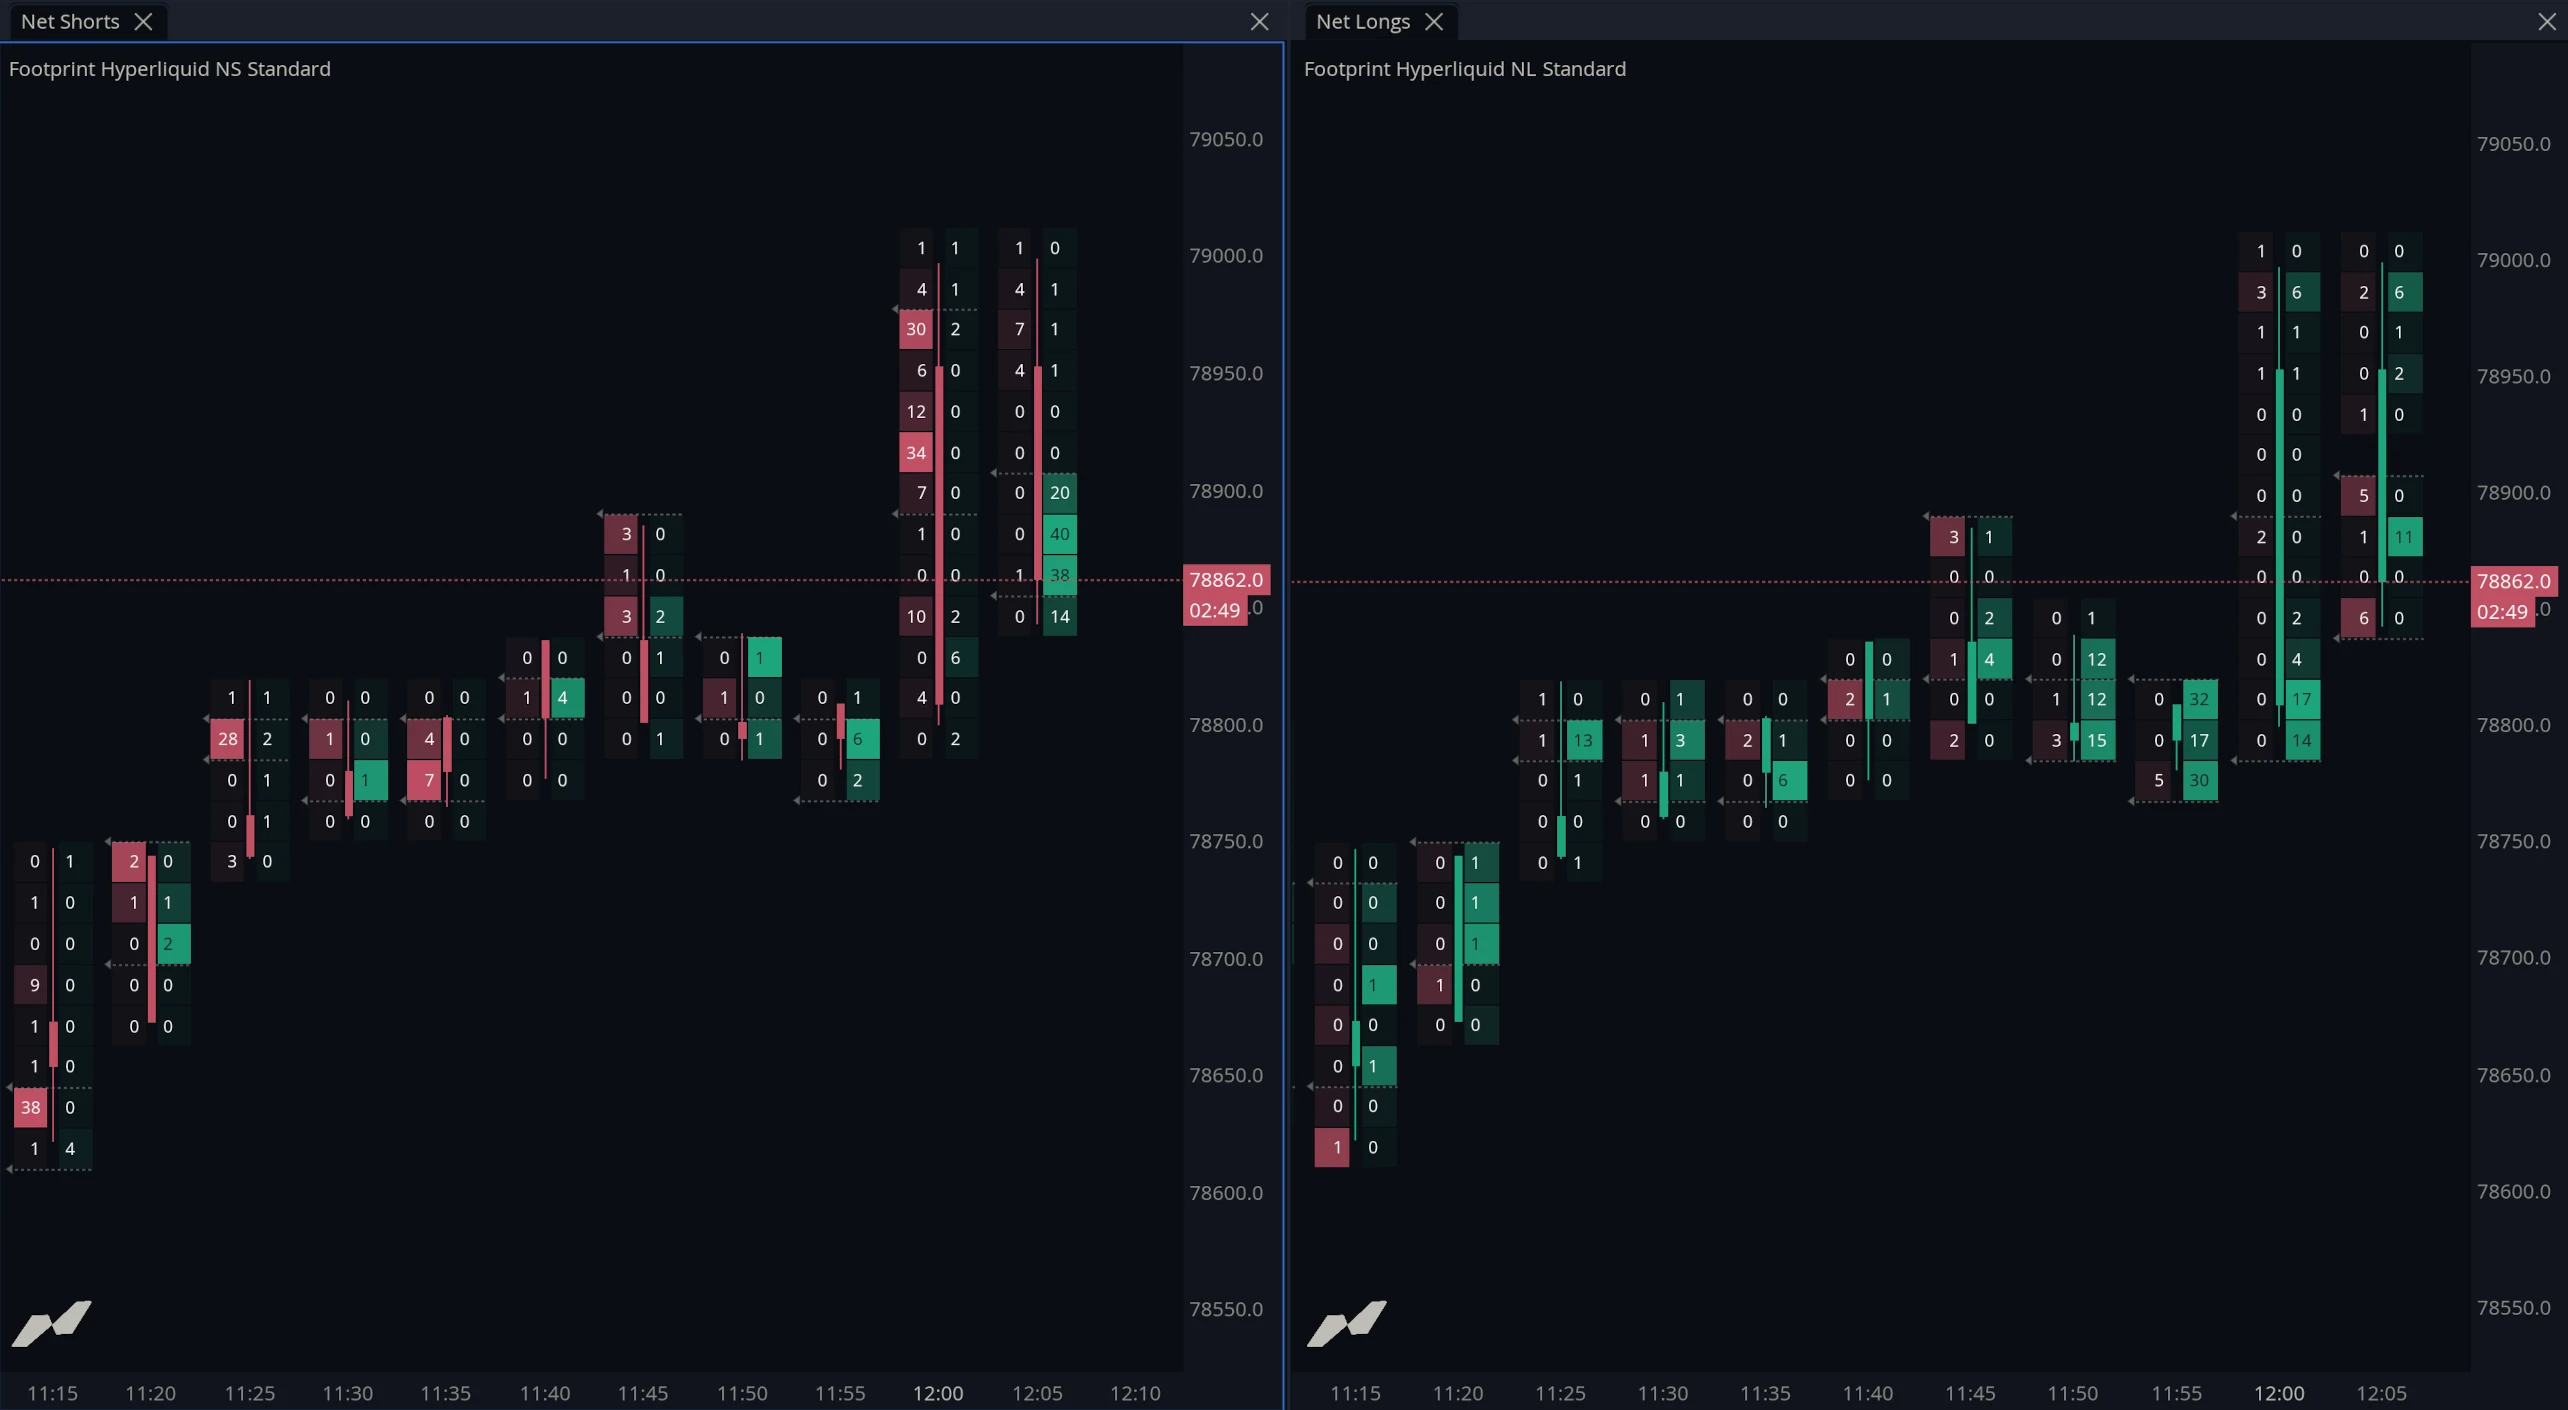
Footprint Hyperliquid NS does the same for net shorts.
Running OI alongside one of the other two is the useful combination: OI tells you exposure changed at a price, and NL or NS tells you whose.
How do you add them?
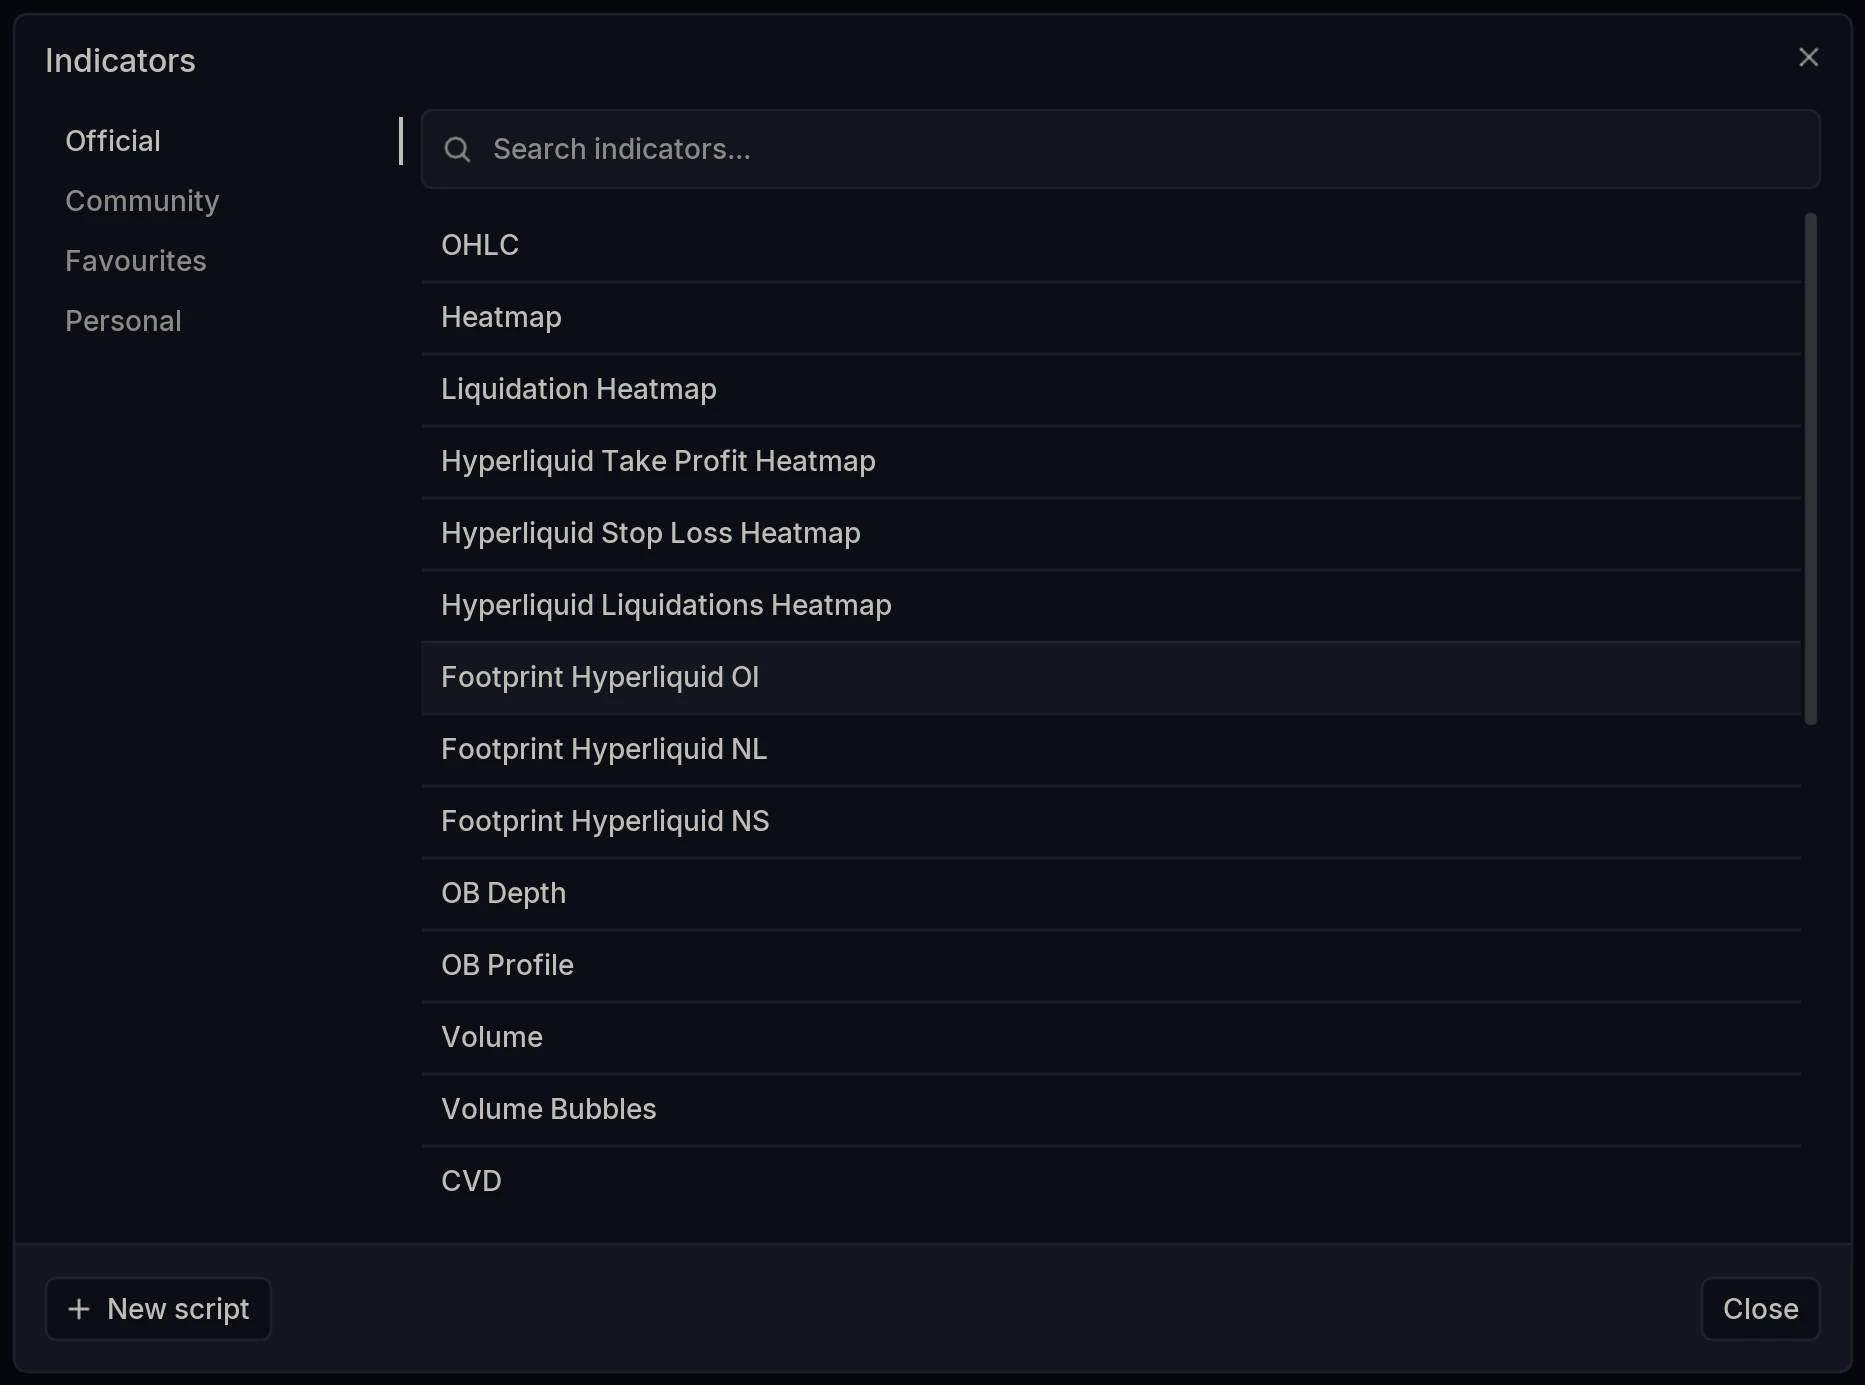
Open the Indicators dialog and select Footprint Hyperliquid OI, Footprint Hyperliquid NL or Footprint Hyperliquid NS under Official.
Standard or delta?
All three run in either mode, exactly as the base footprint does.
Standard shows the two sides at each price separately. Delta collapses them to one figure per row, the net, which is usually the more direct read when the question is simply whether exposure went up or down at a level.
Settings
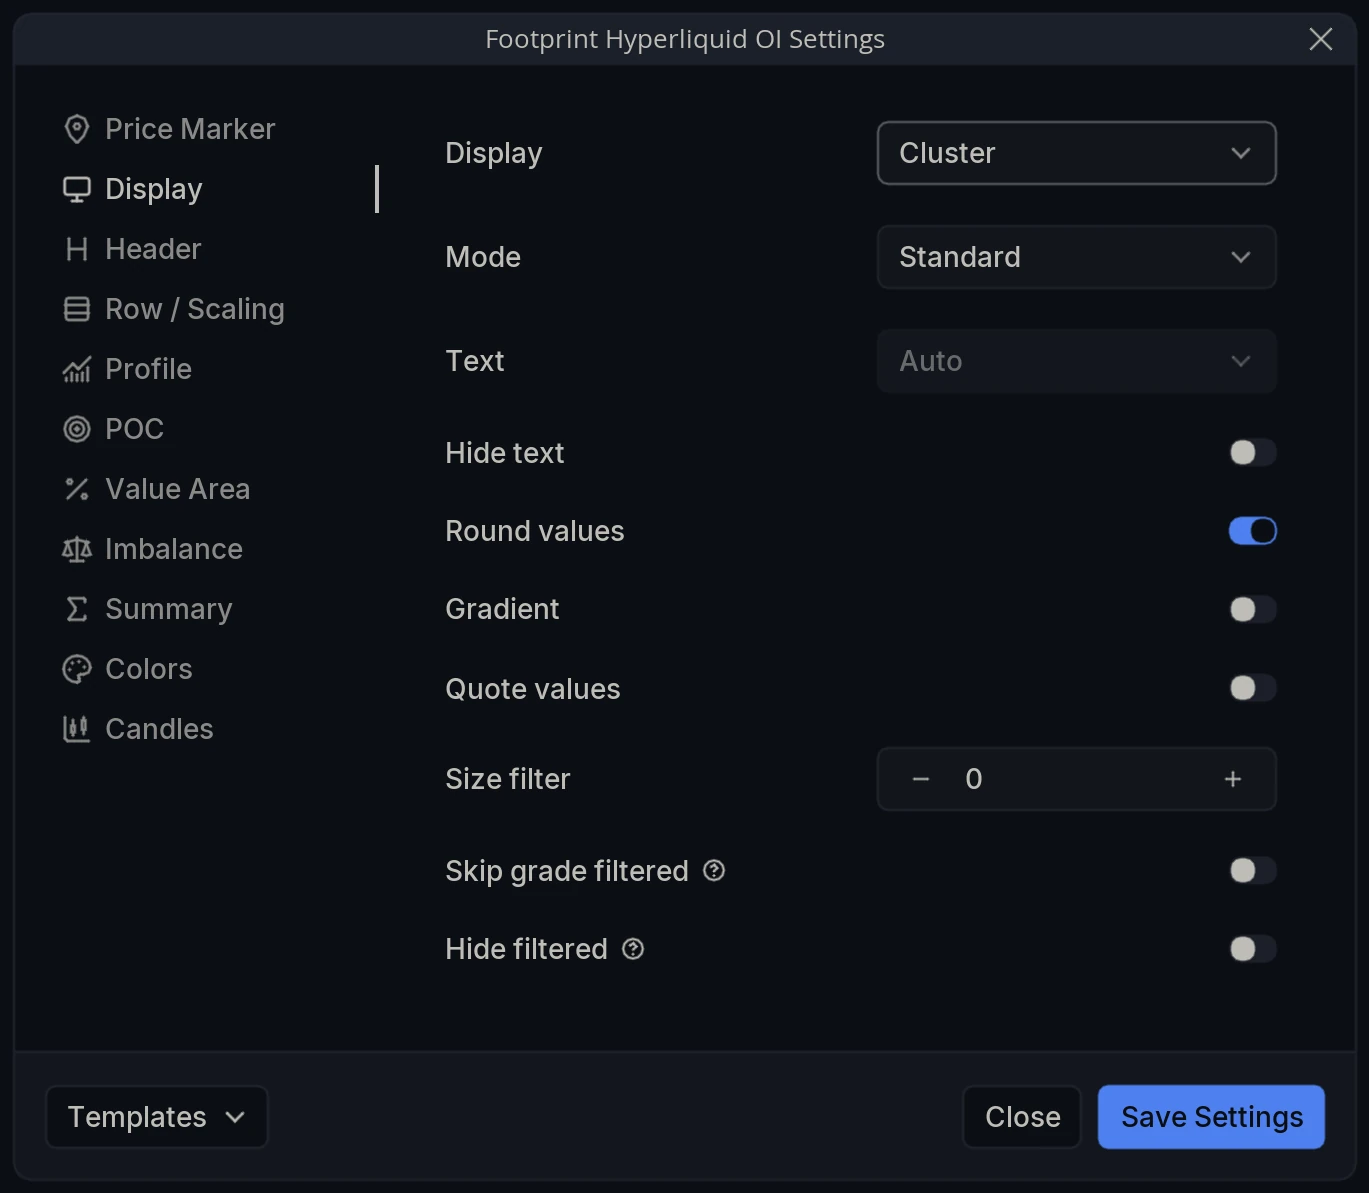
The settings panel is the footprint panel. Display, Mode, Text, row sizing, POC, value area, imbalance, summary, colors and candles all behave exactly as documented in the footprint article, and everything there applies here unchanged.
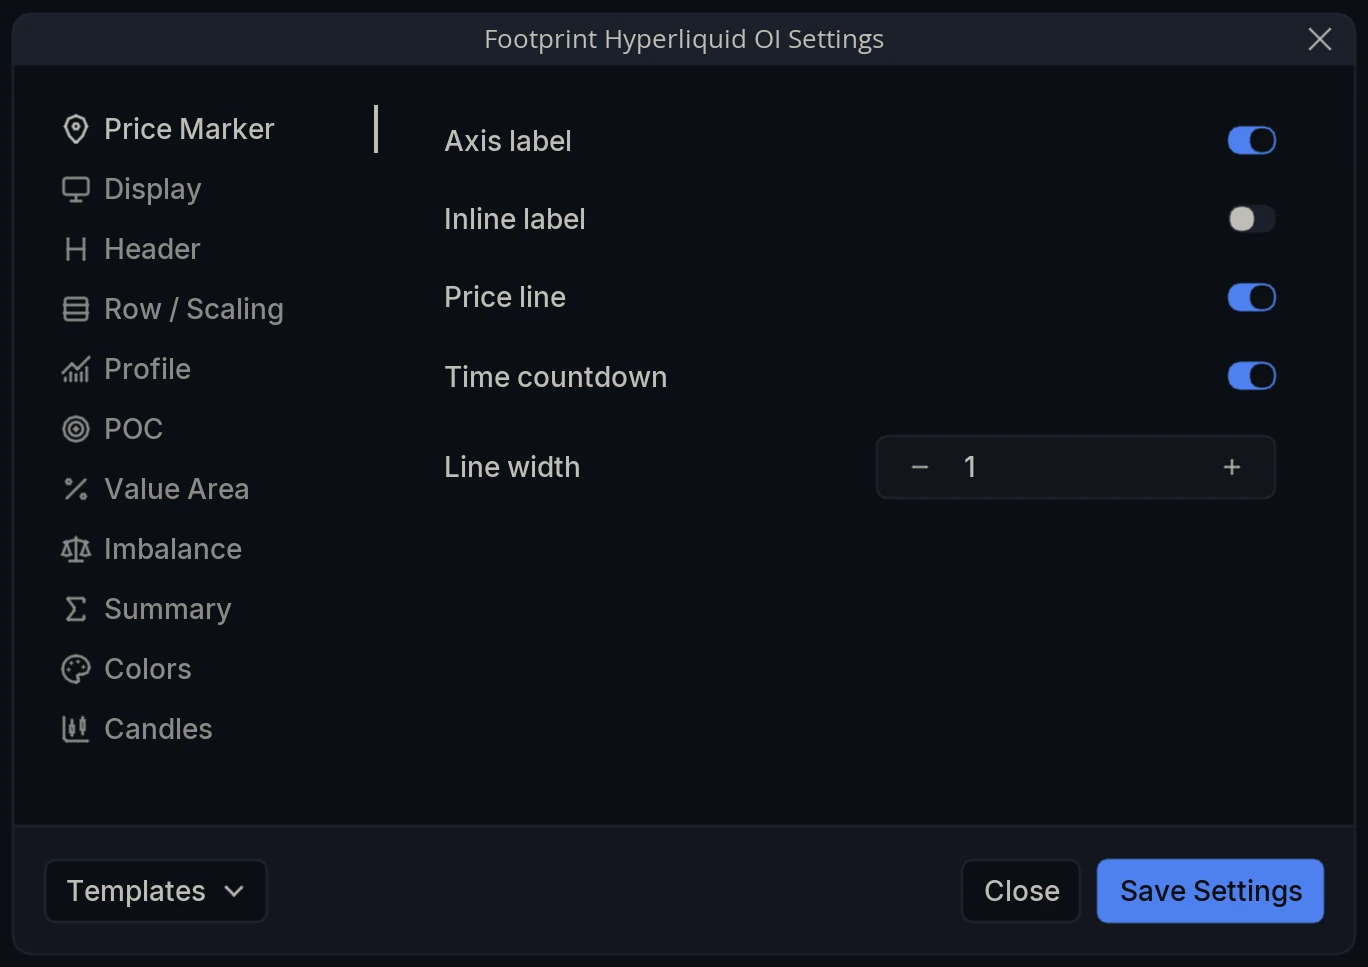
The one difference is that there is no Aggregate tab. The base footprint can pool venues; these layers cannot, because the data exists for one venue only.