What is depth of market (DOM)?
By MichaelUpdated August 27, 2026
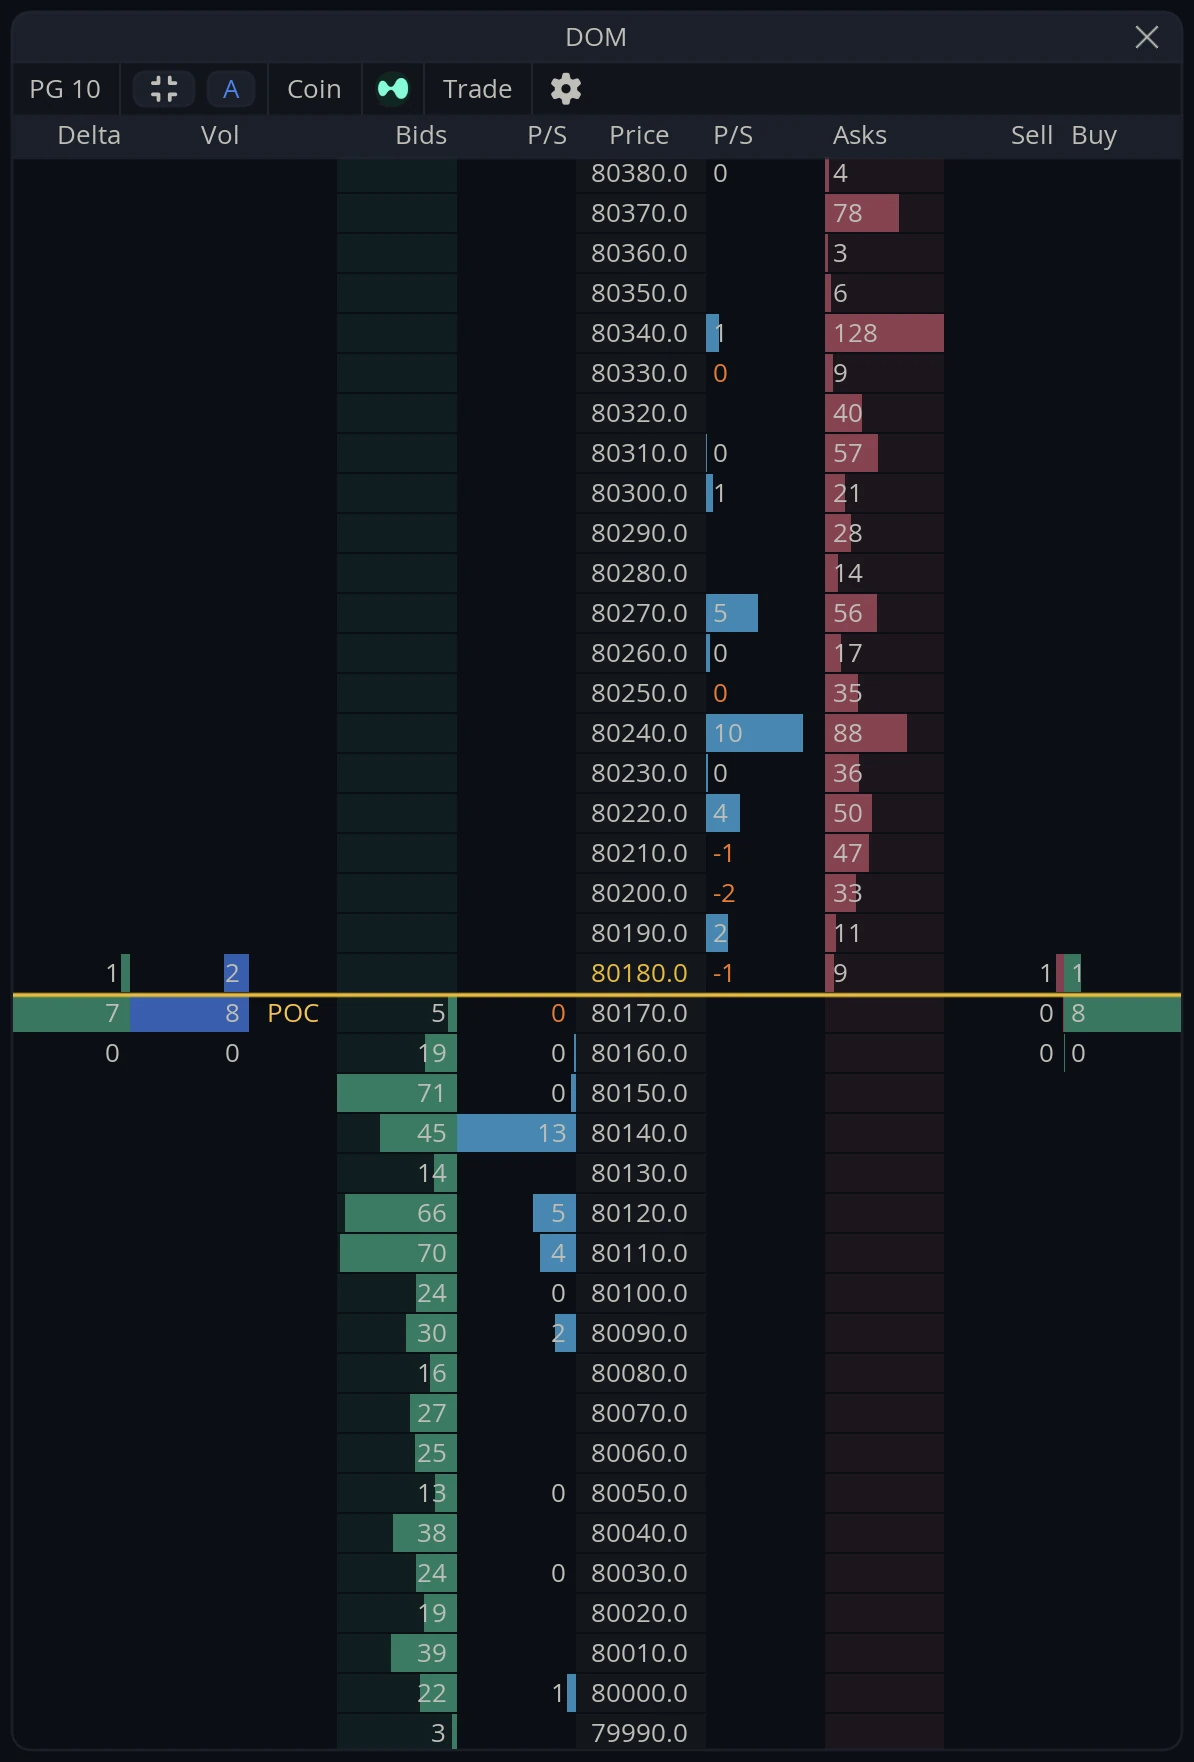
Depth of market, or DOM, is a price ladder showing the resting buy and sell orders at each level alongside the trading that has happened there. It combines what is waiting with what has executed, in one column of prices, and is the standard interface for trading directly from the book.
How does a DOM work?
A DOM is built around a vertical list of prices. Each row is one price level, and everything the widget knows about that price is laid out across the row.
The core of it is the same information an order book carries: how much is bid below the current price and how much is offered above it. What a DOM adds is context in the same row. Volume traded at that price, which side was the aggressor, how the resting size is changing, and any working orders of your own all sit on the line they belong to.
That layout is why it is the trading interface rather than just a display. Everything relevant to a price is in one place, so a decision about that price needs no cross-referencing, and orders can be placed by clicking the row itself.
The other structural difference from a chart is that a DOM does not scroll through time. It is a live view of one moment, updating in place. Reading it is a matter of watching numbers change rather than examining a shape.
What is stacking and pulling?
The most useful thing a DOM shows is not the size at a level but the way that size is changing.
Stacking is size being added at a price. Somebody is building there, which means they intend to defend or accumulate at that level. Pulling is size being removed, and it usually means the opposite: whoever was there has decided not to be.
Neither is visible from the resting quantity alone. A level showing 50 could be a level that has held 50 all day or one that had 300 a moment ago and is being abandoned as price approaches. Those are opposite situations that look identical in a static book.
Pulling just ahead of price is the pattern worth knowing. Size that evaporates as the market reaches it was never going to be filled, and the level it appeared to defend gives way easily. Size that stays and absorbs is the real thing.
How do you read a DOM?
Read across the row, not down the column. The point of the layout is that everything about one price is on one line. Heavy resting size with heavy volume traded and a strongly one-sided delta describes a level being fought over right now.
Compare resting size against executed volume. A price with a great deal resting and almost nothing traded has not been tested. A price with heavy volume and thin remaining size has been consumed.
Watch the changes, not the state. As above: the numbers moving matter more than the numbers themselves.
Use the point of control as the anchor. The price that has traded most over the retained period is where the market has been doing its business. Bear in mind that it resets on the clock, so it describes the current period rather than a rolling history.
What are the limits of a DOM?
It shows one venue’s book. Depth on one exchange is not depth everywhere.
Resting orders are not commitments. Anything in the book can be canceled, which is exactly why stacking and pulling matter more than the raw figures.
It has no history. A DOM describes the current moment. For how depth behaved over time you need an order book heatmap, and for executions over time a time and sales feed.
It rewards attention. Like the tape, a DOM only tells you things while you are watching it.
Related: Order book · Order book heatmap · Time and sales · Footprint · Volume delta
Using the DOM widget in MMT
MMT’s DOM puts eleven columns around the price ladder, covering executed volume, resting depth, how that depth is changing, and prints by side. Orders can be placed directly from the ladder, and the whole widget can be pooled across exchanges.
How do you add the DOM?
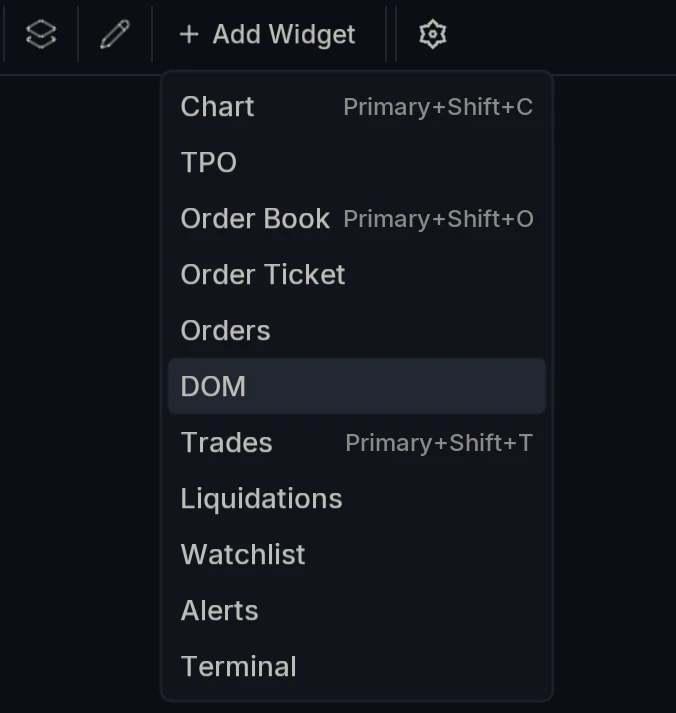
Open Add Widget and choose DOM.
What do the columns show?
Reading from the outside in, the ladder is arranged so that executed activity sits on the left, resting orders sit in the middle around the price, and prints sit on the right.
Delta and Vol are executed activity at that price. Vol is how much traded there; Delta is the buy-minus-sell split of it. Both are kept for the Trade retention period, which clears and starts again at each interval.
Bids and Asks are the resting size on each side, bids below the current price and asks above it.
P/S appears twice, once against each side, and carries the pull and stack figures described above. Blue means size was added at that price over the Pull / stack window; orange means size was pulled.
Sell prints and Buy prints are the executions at that price shown separately by side, rather than netted as Delta shows them.
POC and VAL are marked on the ladder: the price that has traded most over the current retention period, and the value area low.
Retention is not a rolling lookback. It is a fixed period aligned to the clock, so with it set to 5m the ladder clears at every five-minute boundary and starts counting again. That is worth knowing before you read the POC: immediately after a reset it is built from a few seconds of trading and means very little, and it becomes meaningful as the period fills out.
How do you trade from the DOM?
Click Trade and the toolbar changes: a row of size presets appears alongside Buy, Sell and Cancel all, and two new columns, BUY and SELL, open up inside the ladder.
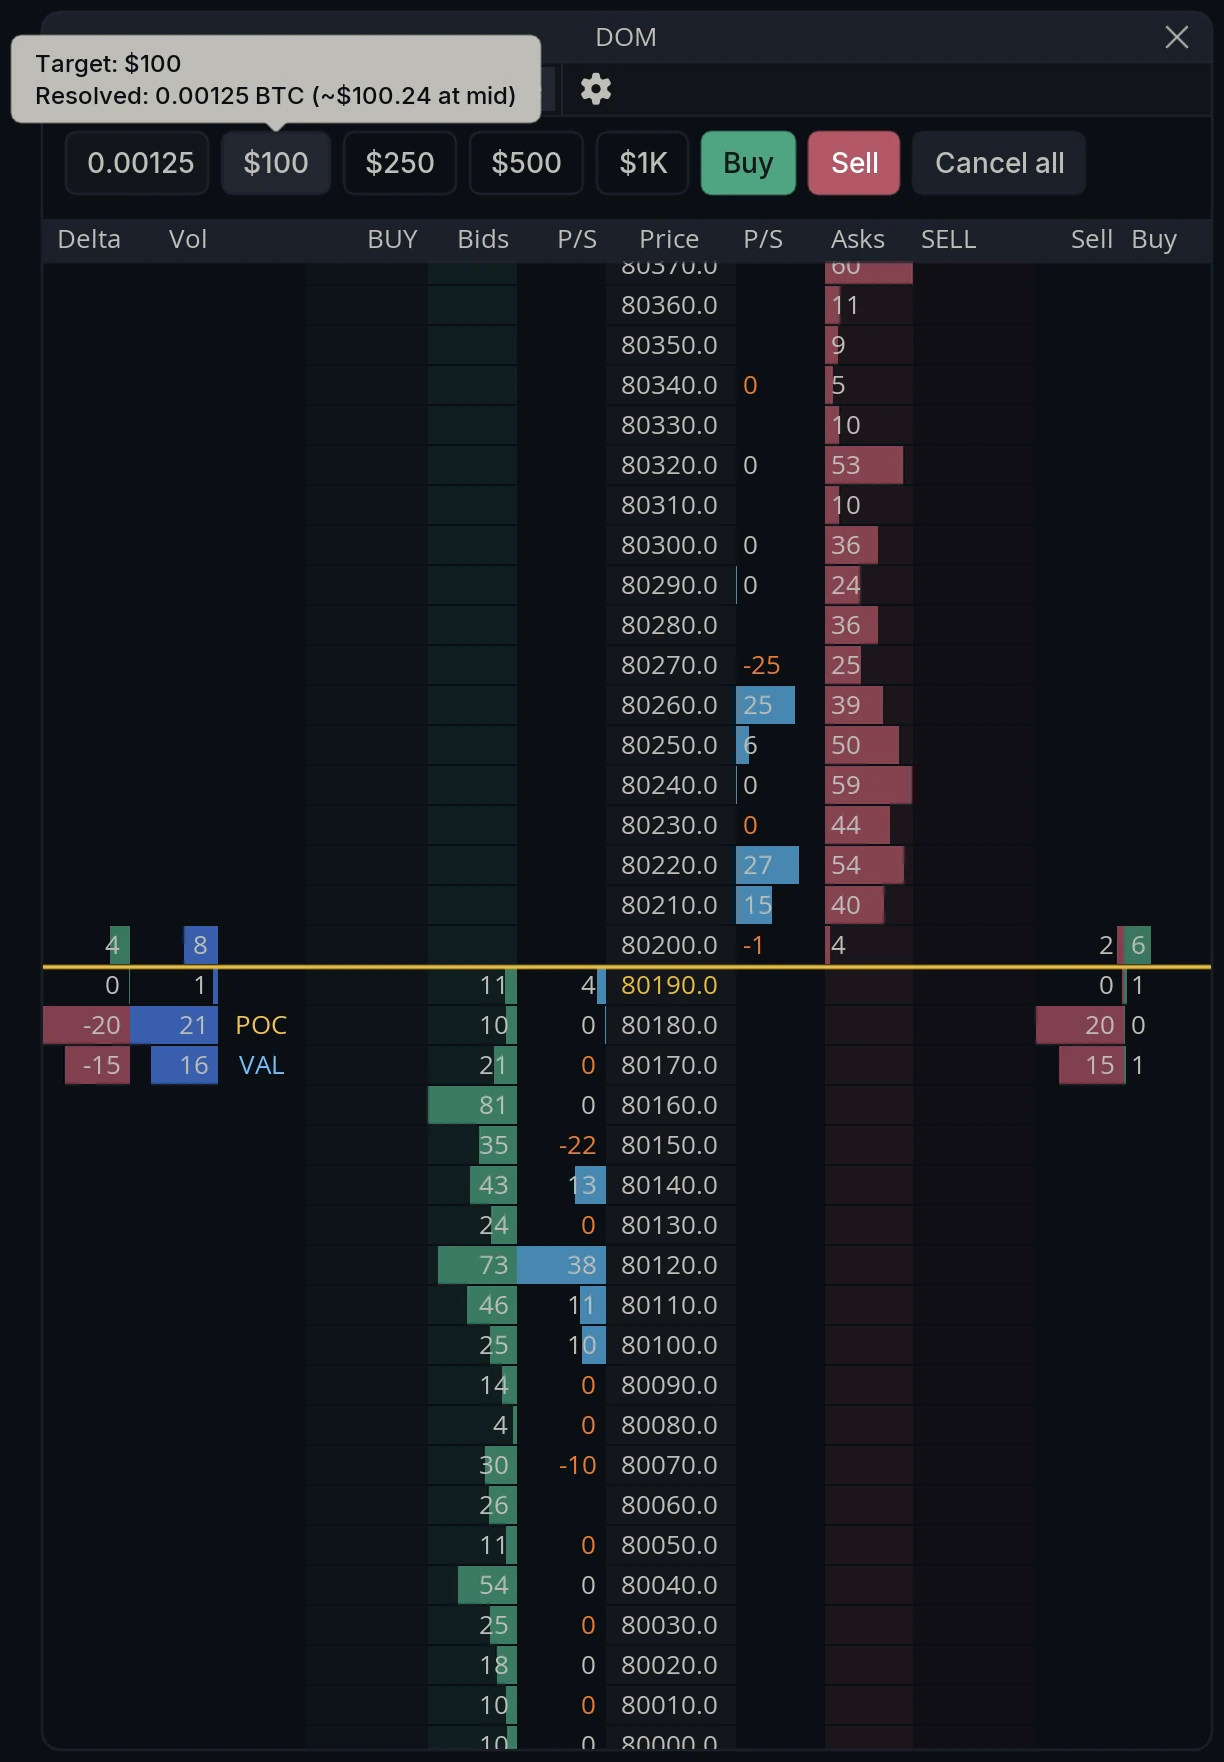
To place an order, pick a size and click the cell at the price you want it. The order goes in at that price, at that size, and appears in the BUY or SELL column so you can see your own working orders on the same ladder as everyone else’s.
Sizes can be set in USD or in the coin. Hovering a USD preset resolves it, so $100 shows as Resolved: 0.00125 BTC (~$100.24 at mid) before you commit to anything. The presets themselves are configurable in the settings.
How does the ladder stay centered?
Auto (drift to edge) lets the price line move as the market does and recenters when it reaches the edge. Recenter edge offset controls how close it gets first: as the tooltip puts it, rows from top/bottom before recentering the live midpoint. 0 disables it.
A larger offset recenters earlier, keeping price well inside the ladder. A smaller one lets it run closer to the edge before snapping back, which means fewer interruptions but less room to see what is coming.
Widget Settings
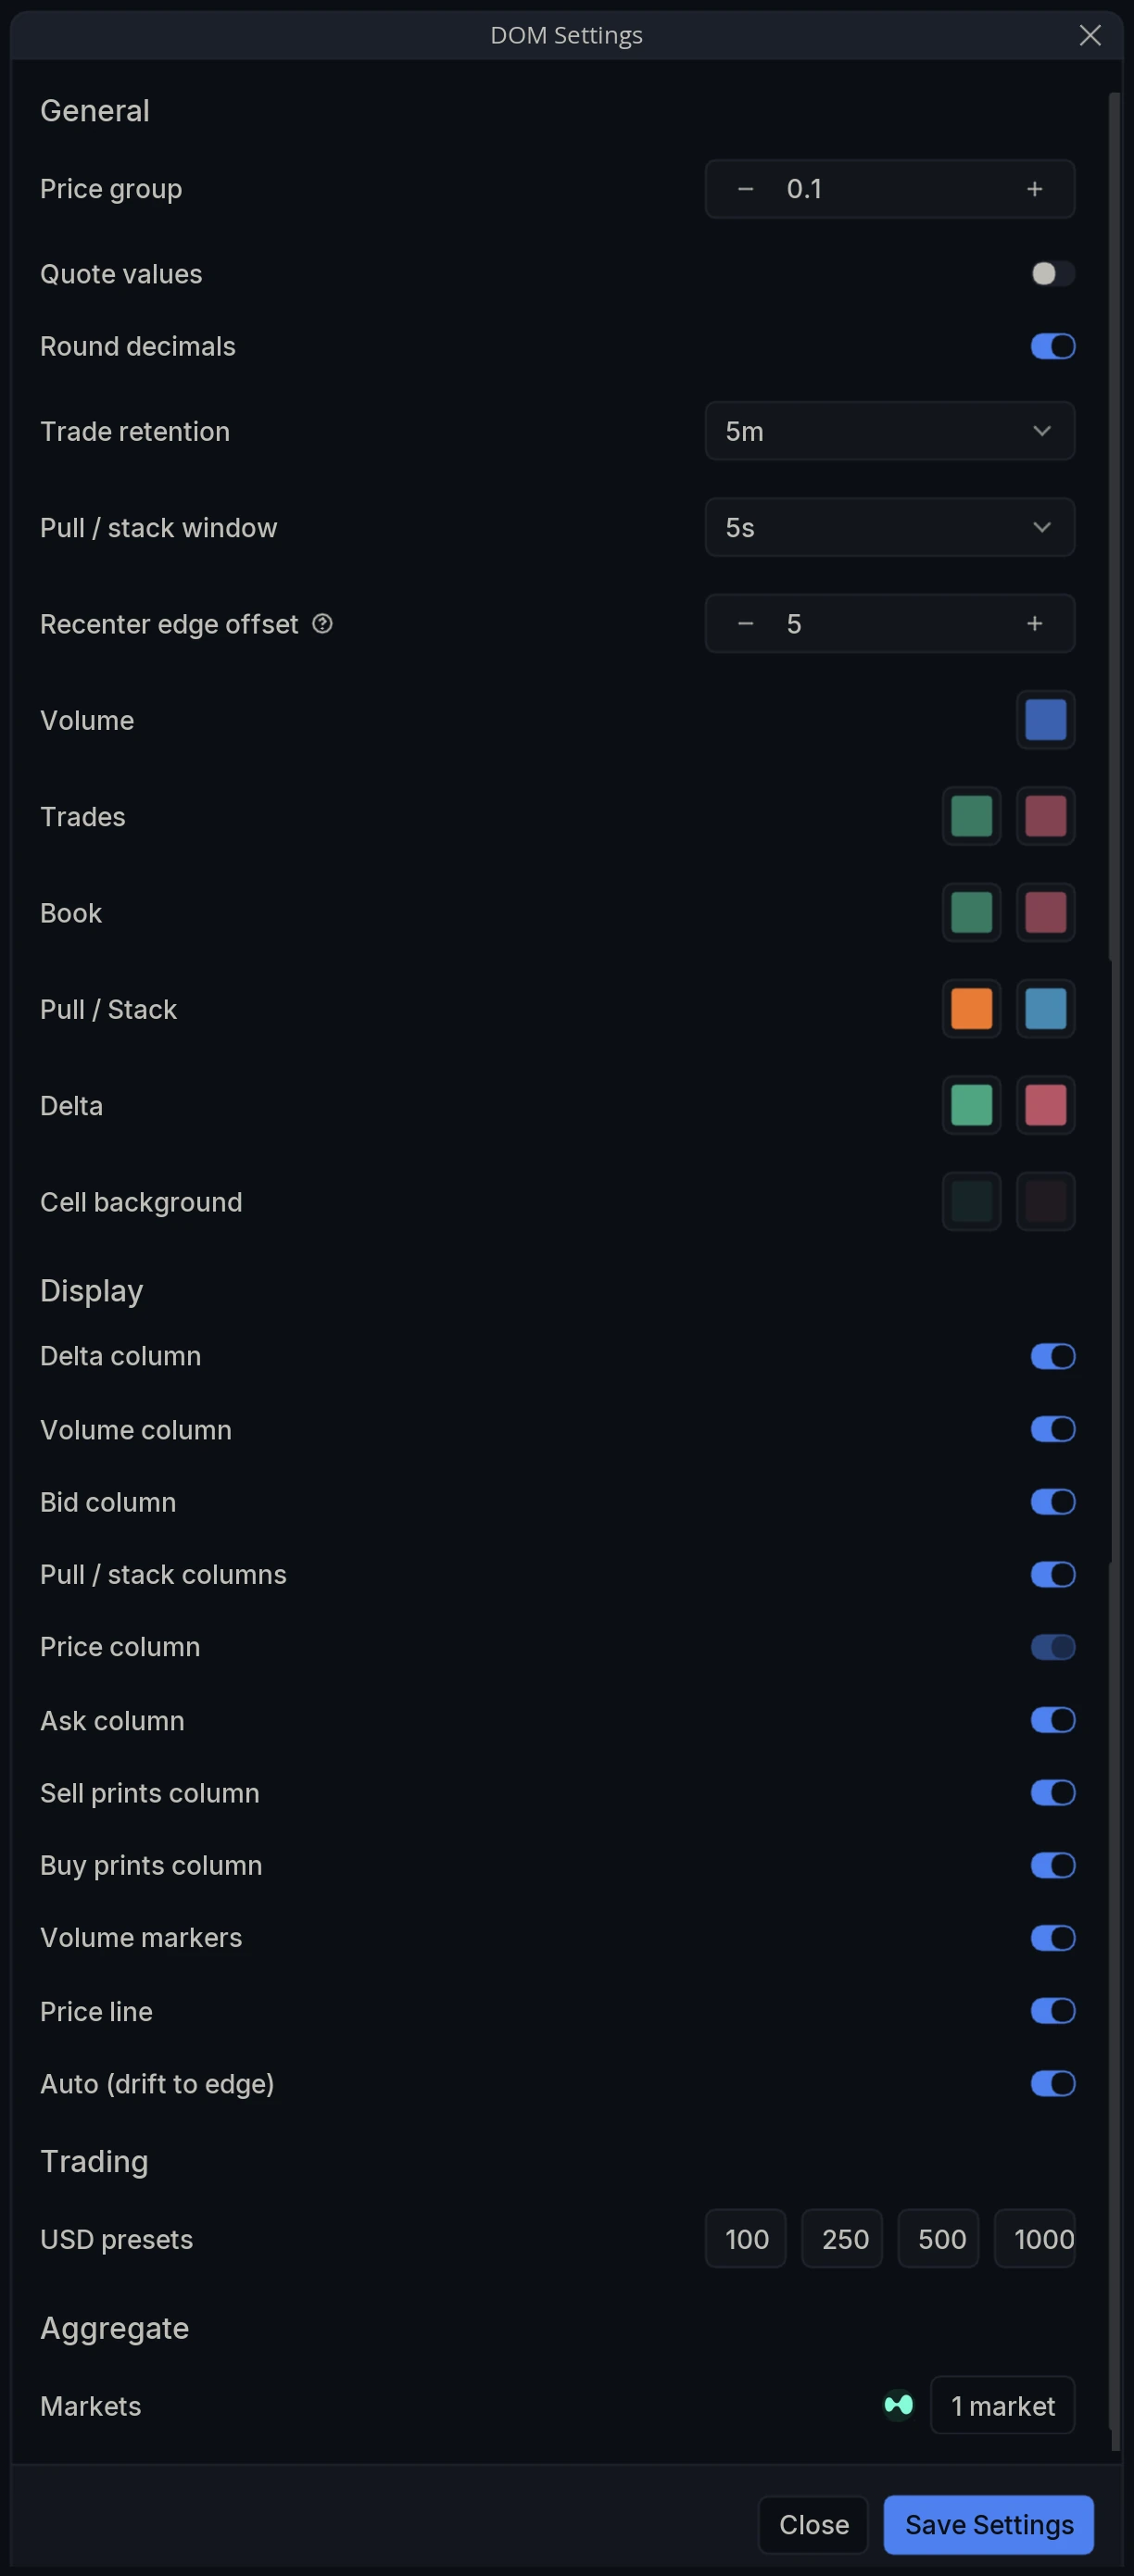
Open DOM Settings via the cog on the widget’s toolbar.
General
Price group - How many price levels are merged into each row.
Quote values - Report sizes in the quote currency rather than the base asset.
Round decimals - Round the printed figures.
Trade retention - How long executed volume is kept on the ladder before clearing. The period is aligned to the clock, so it resets at each interval rather than rolling.
Pull / stack window - The rolling period the pull and stack figures are measured over.
Recenter edge offset - Rows from top or bottom before recentering the live midpoint. 0 disables it.
Volume - The color used for the volume column.
Trades - The two colors used for executions.
Book - The two colors used for resting bids and asks.
Pull / Stack - The two colors used for pulled and stacked size.
Delta - The two colors used for positive and negative delta.
Cell background - The background shading for the two sides of the ladder.
Display
Delta column / Volume column / Bid column / Pull / stack columns / Price column / Ask column / Sell prints column / Buy prints column - Show or hide each column individually.
Volume markers - Mark volume on the ladder.
Price line - Draw the line marking the current price.
Auto (drift to edge) - Let the price line drift and recenter when it reaches the edge.
Trading
USD presets - The four size buttons available in trade mode. 100, 250, 500 and 1000 by default.
Aggregate
Markets - Choose which exchanges are included.