What is a footprint chart?
By MichaelUpdated August 26, 2026
A footprint chart shows the trading that happened inside each candle, broken down by price. Instead of one bar summarizing a period, every price level within it displays how much was bought and sold there, so the buying and selling that produced the candle can be read directly.
How does a footprint chart work?
A candle is four numbers: open, high, low and close. It tells you where price went and nothing about how it got there. Two candles with identical shapes can be built from completely different trading, and once the bar closes that difference is gone.
A footprint recovers it. The candle’s price range is divided into rows, and every trade is assigned to the row containing its price and the side that crossed the spread. What you end up with is a grid: one column per candle, one row per price, and in each cell the volume that traded there split into aggressive buying and aggressive selling.
That is the whole idea. The candle is still there, but it is now filled in. A long red bar that fell twenty points is no longer just a decline; you can see that most of the selling happened in the top third, that buyers took control near the low, and exactly which price the two sides fought over.
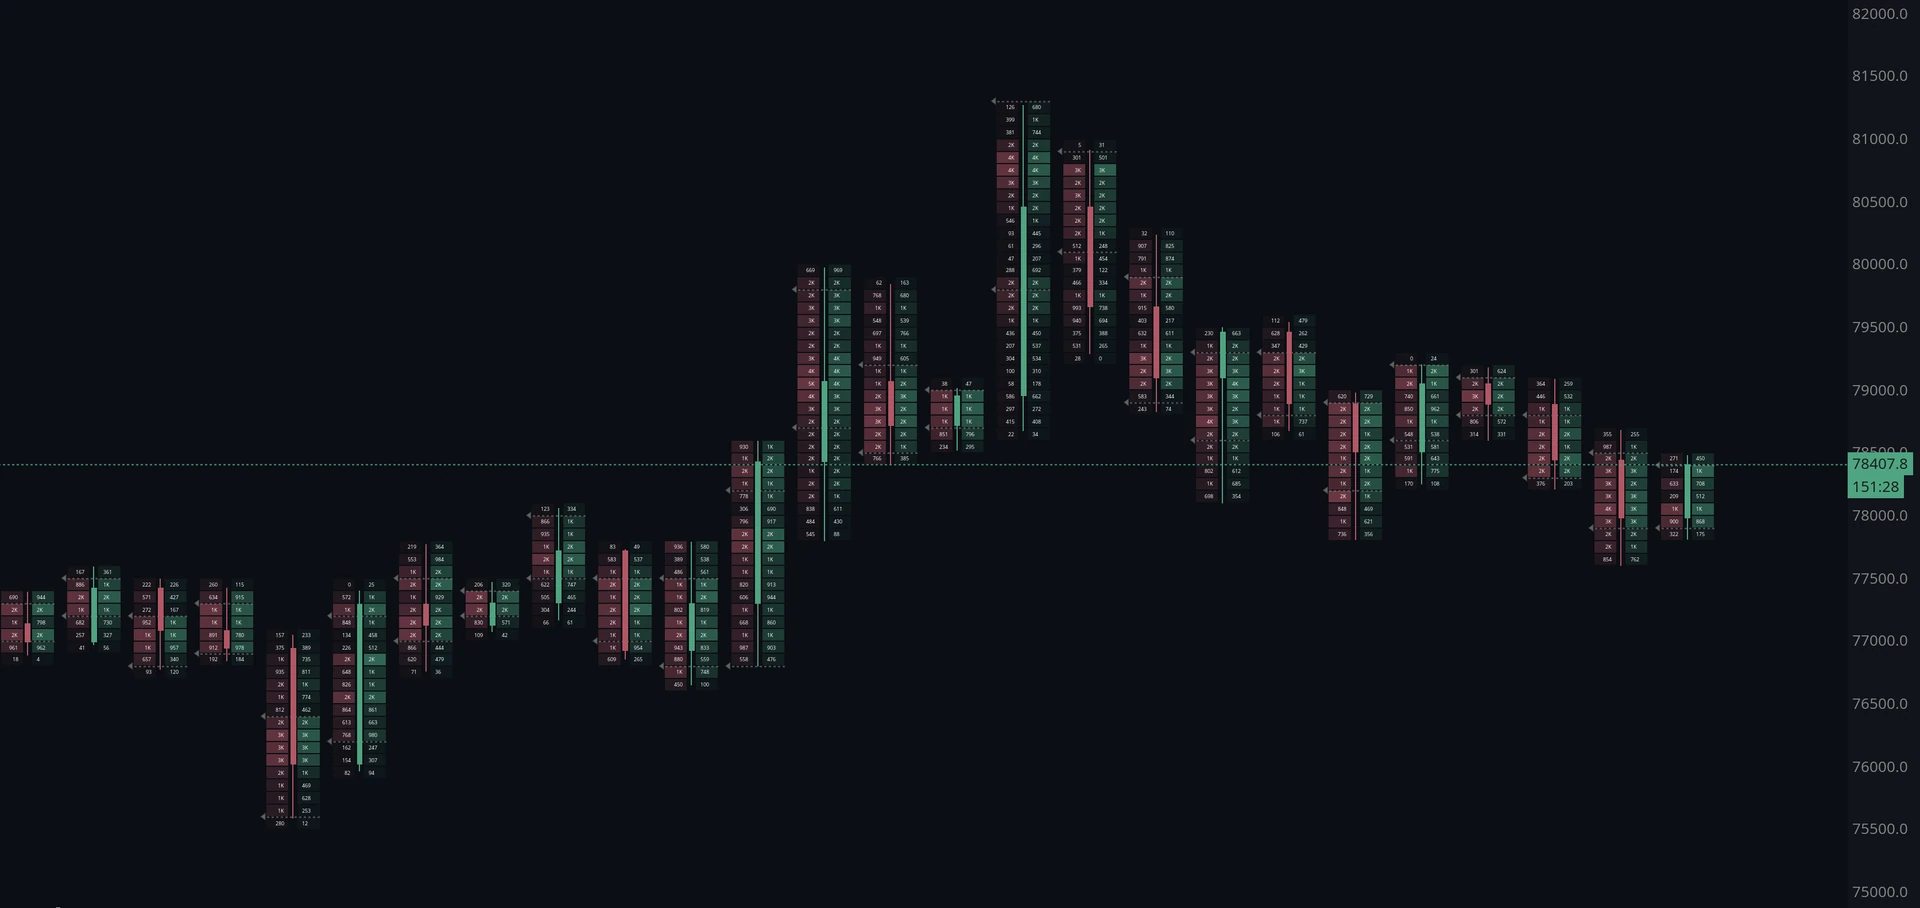
Because every cell holds two numbers, a footprint carries more information per candle than any other chart type, and it is correspondingly demanding to read.
How do you read a footprint?
Work from the shape of the numbers rather than the numbers themselves.
Where the volume sat. Every candle has prices that traded heavily and prices that barely traded. Heavy rows are where business was done; thin rows are where price moved through quickly because there was nothing to trade against. A candle whose volume is concentrated at one end tells a different story from one where it is spread evenly.
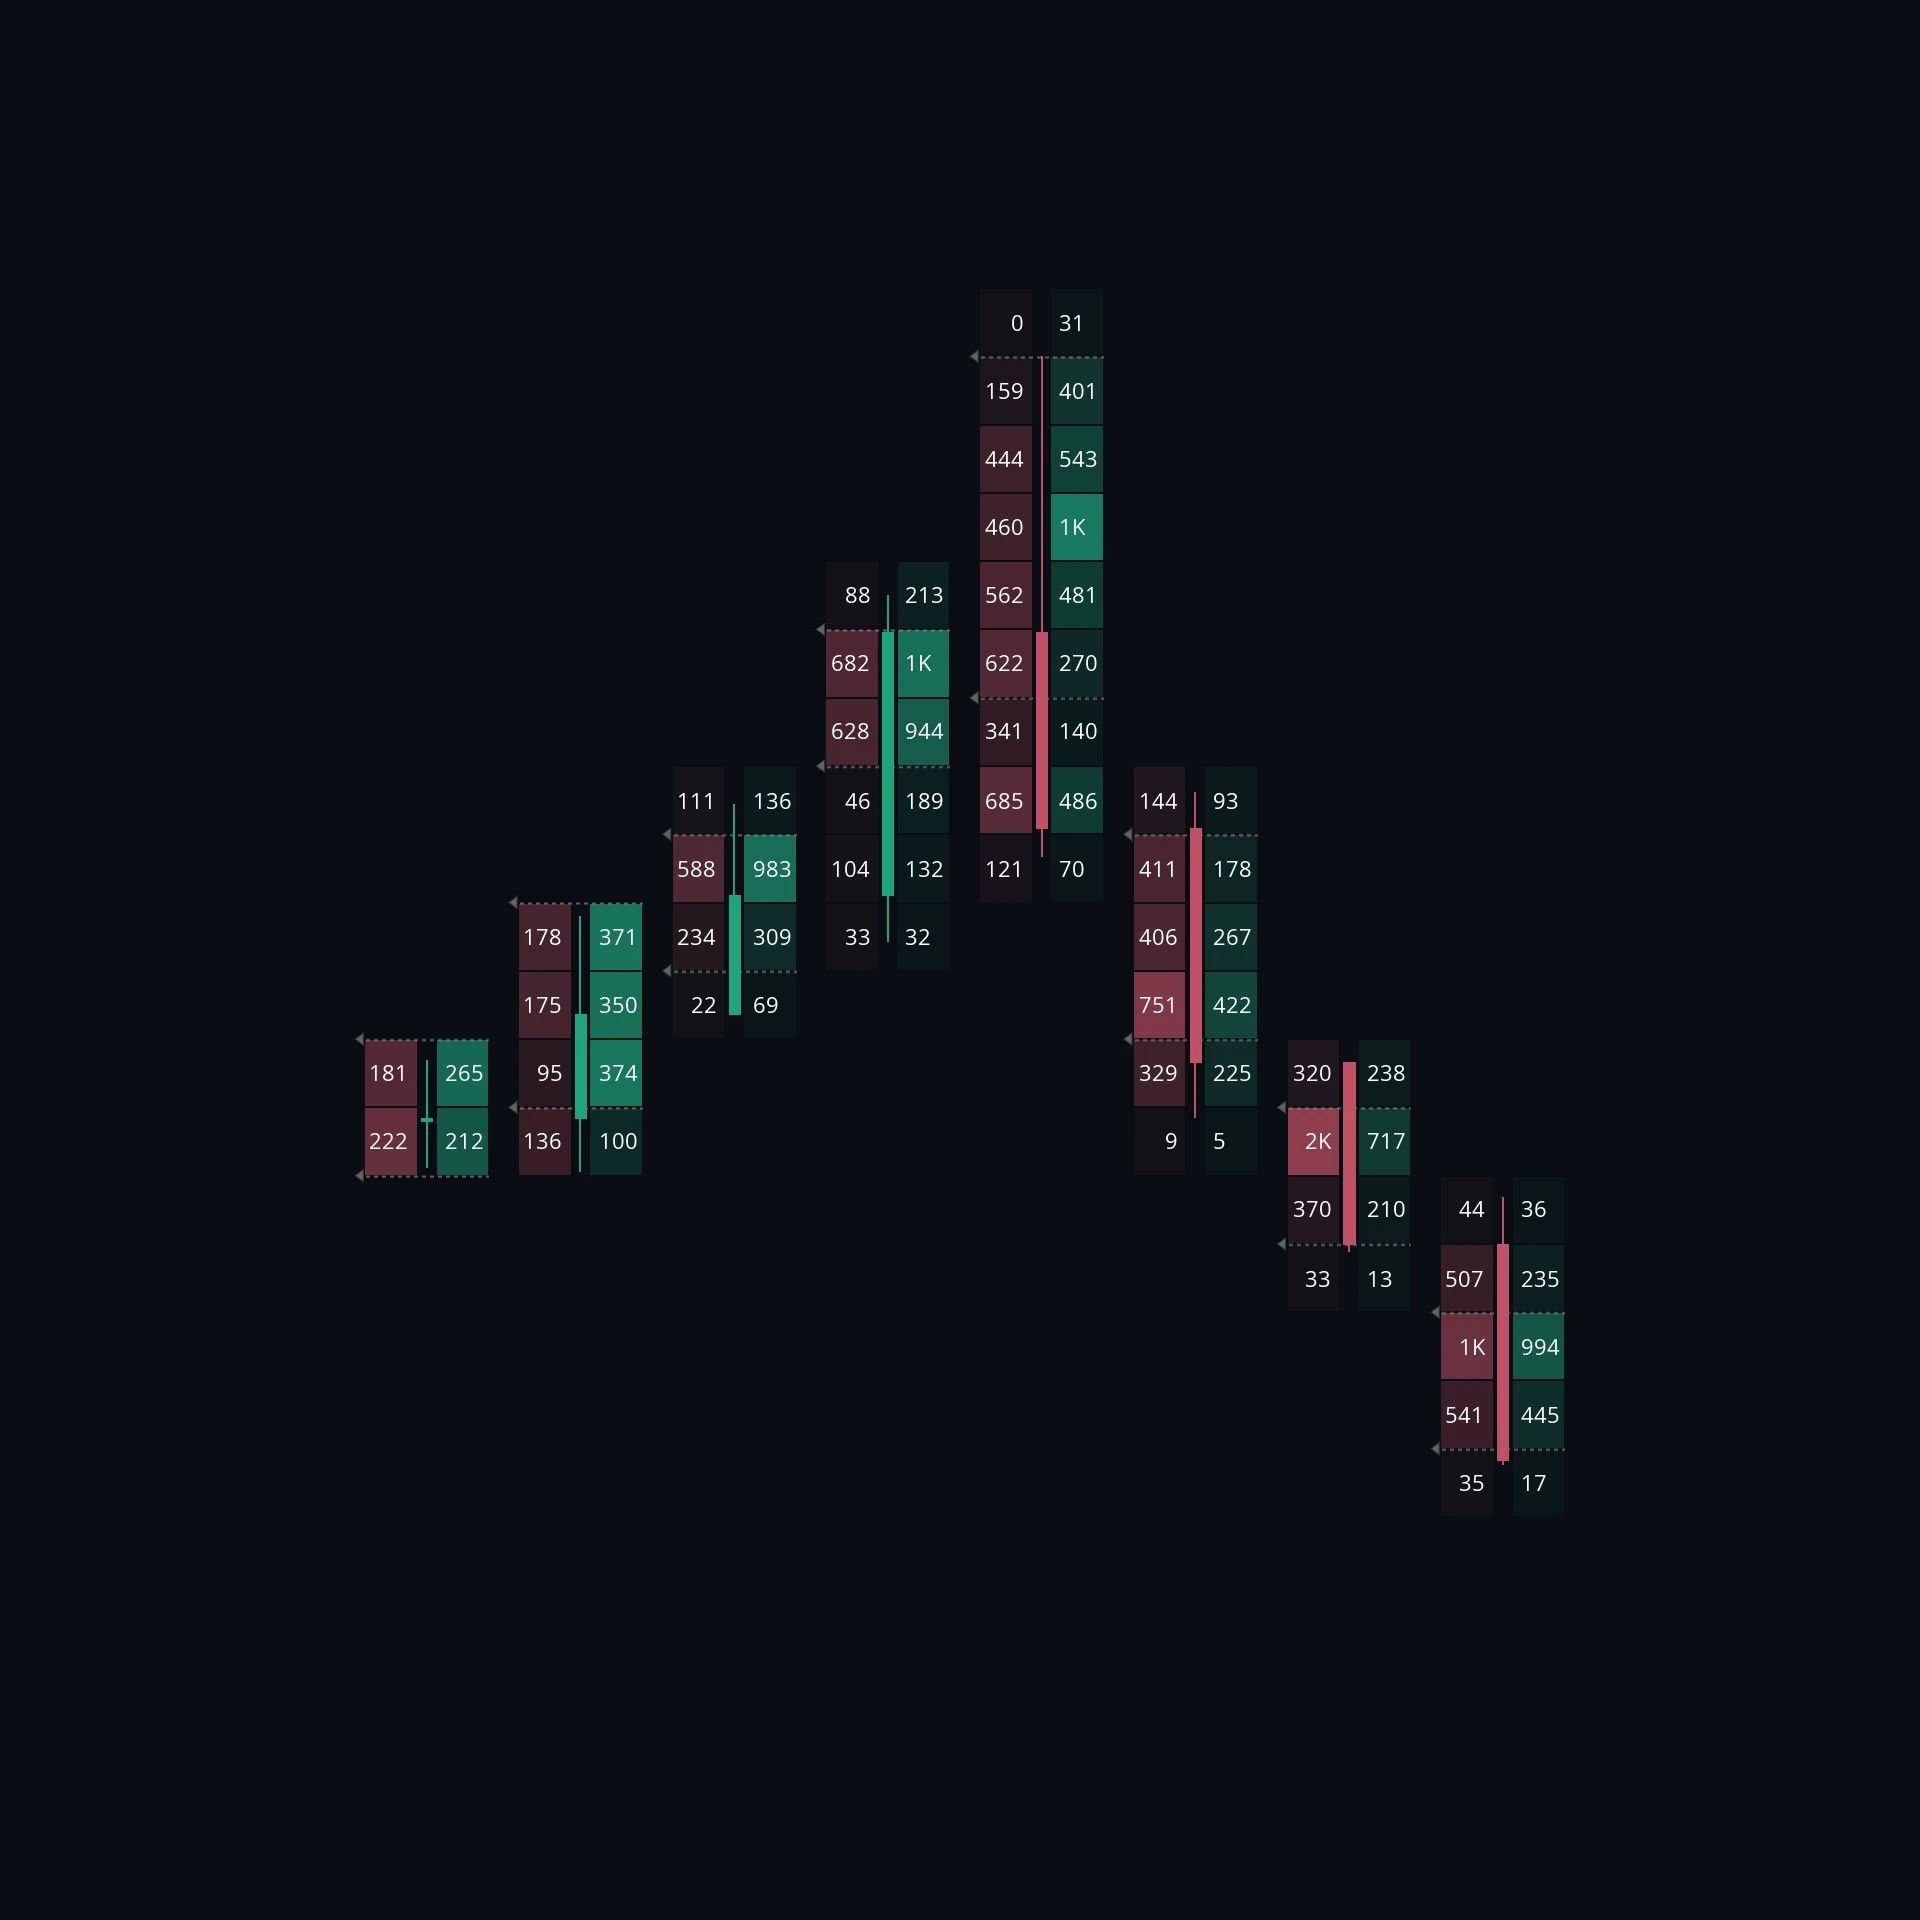
Which side did the work. Compare the two columns row by row. Rows where buying dominates and rows where selling dominates are not usually spread evenly through a bar, and the pattern is the point: heavy selling at the top of an up candle means the advance was fought, not walked.
Where the result disagrees with the effort. This is the reading footprints exist for. A candle that closes near its high on predominantly aggressive selling means sellers pushed and got nowhere, because someone was absorbing them with resting orders. The reverse is just as informative. Effort in one direction and a result in the other is the single most useful thing a footprint shows.
What happened at the extremes. The rows at the very top and bottom of a bar are where the turn occurred. Heavy volume at a low with buying dominating is a level defended in real time.
What is a footprint imbalance?
An imbalance is a price where one side did overwhelmingly more than the other.
The comparison is diagonal, not straight across. Buying at one price is measured against selling one row away, because those are the two sides that were actually competing: a buyer lifting an offer at one level and a seller hitting a bid at the level below are on opposite sides of the same fight. Comparing a cell with the one directly beside it would compare two figures that never met.
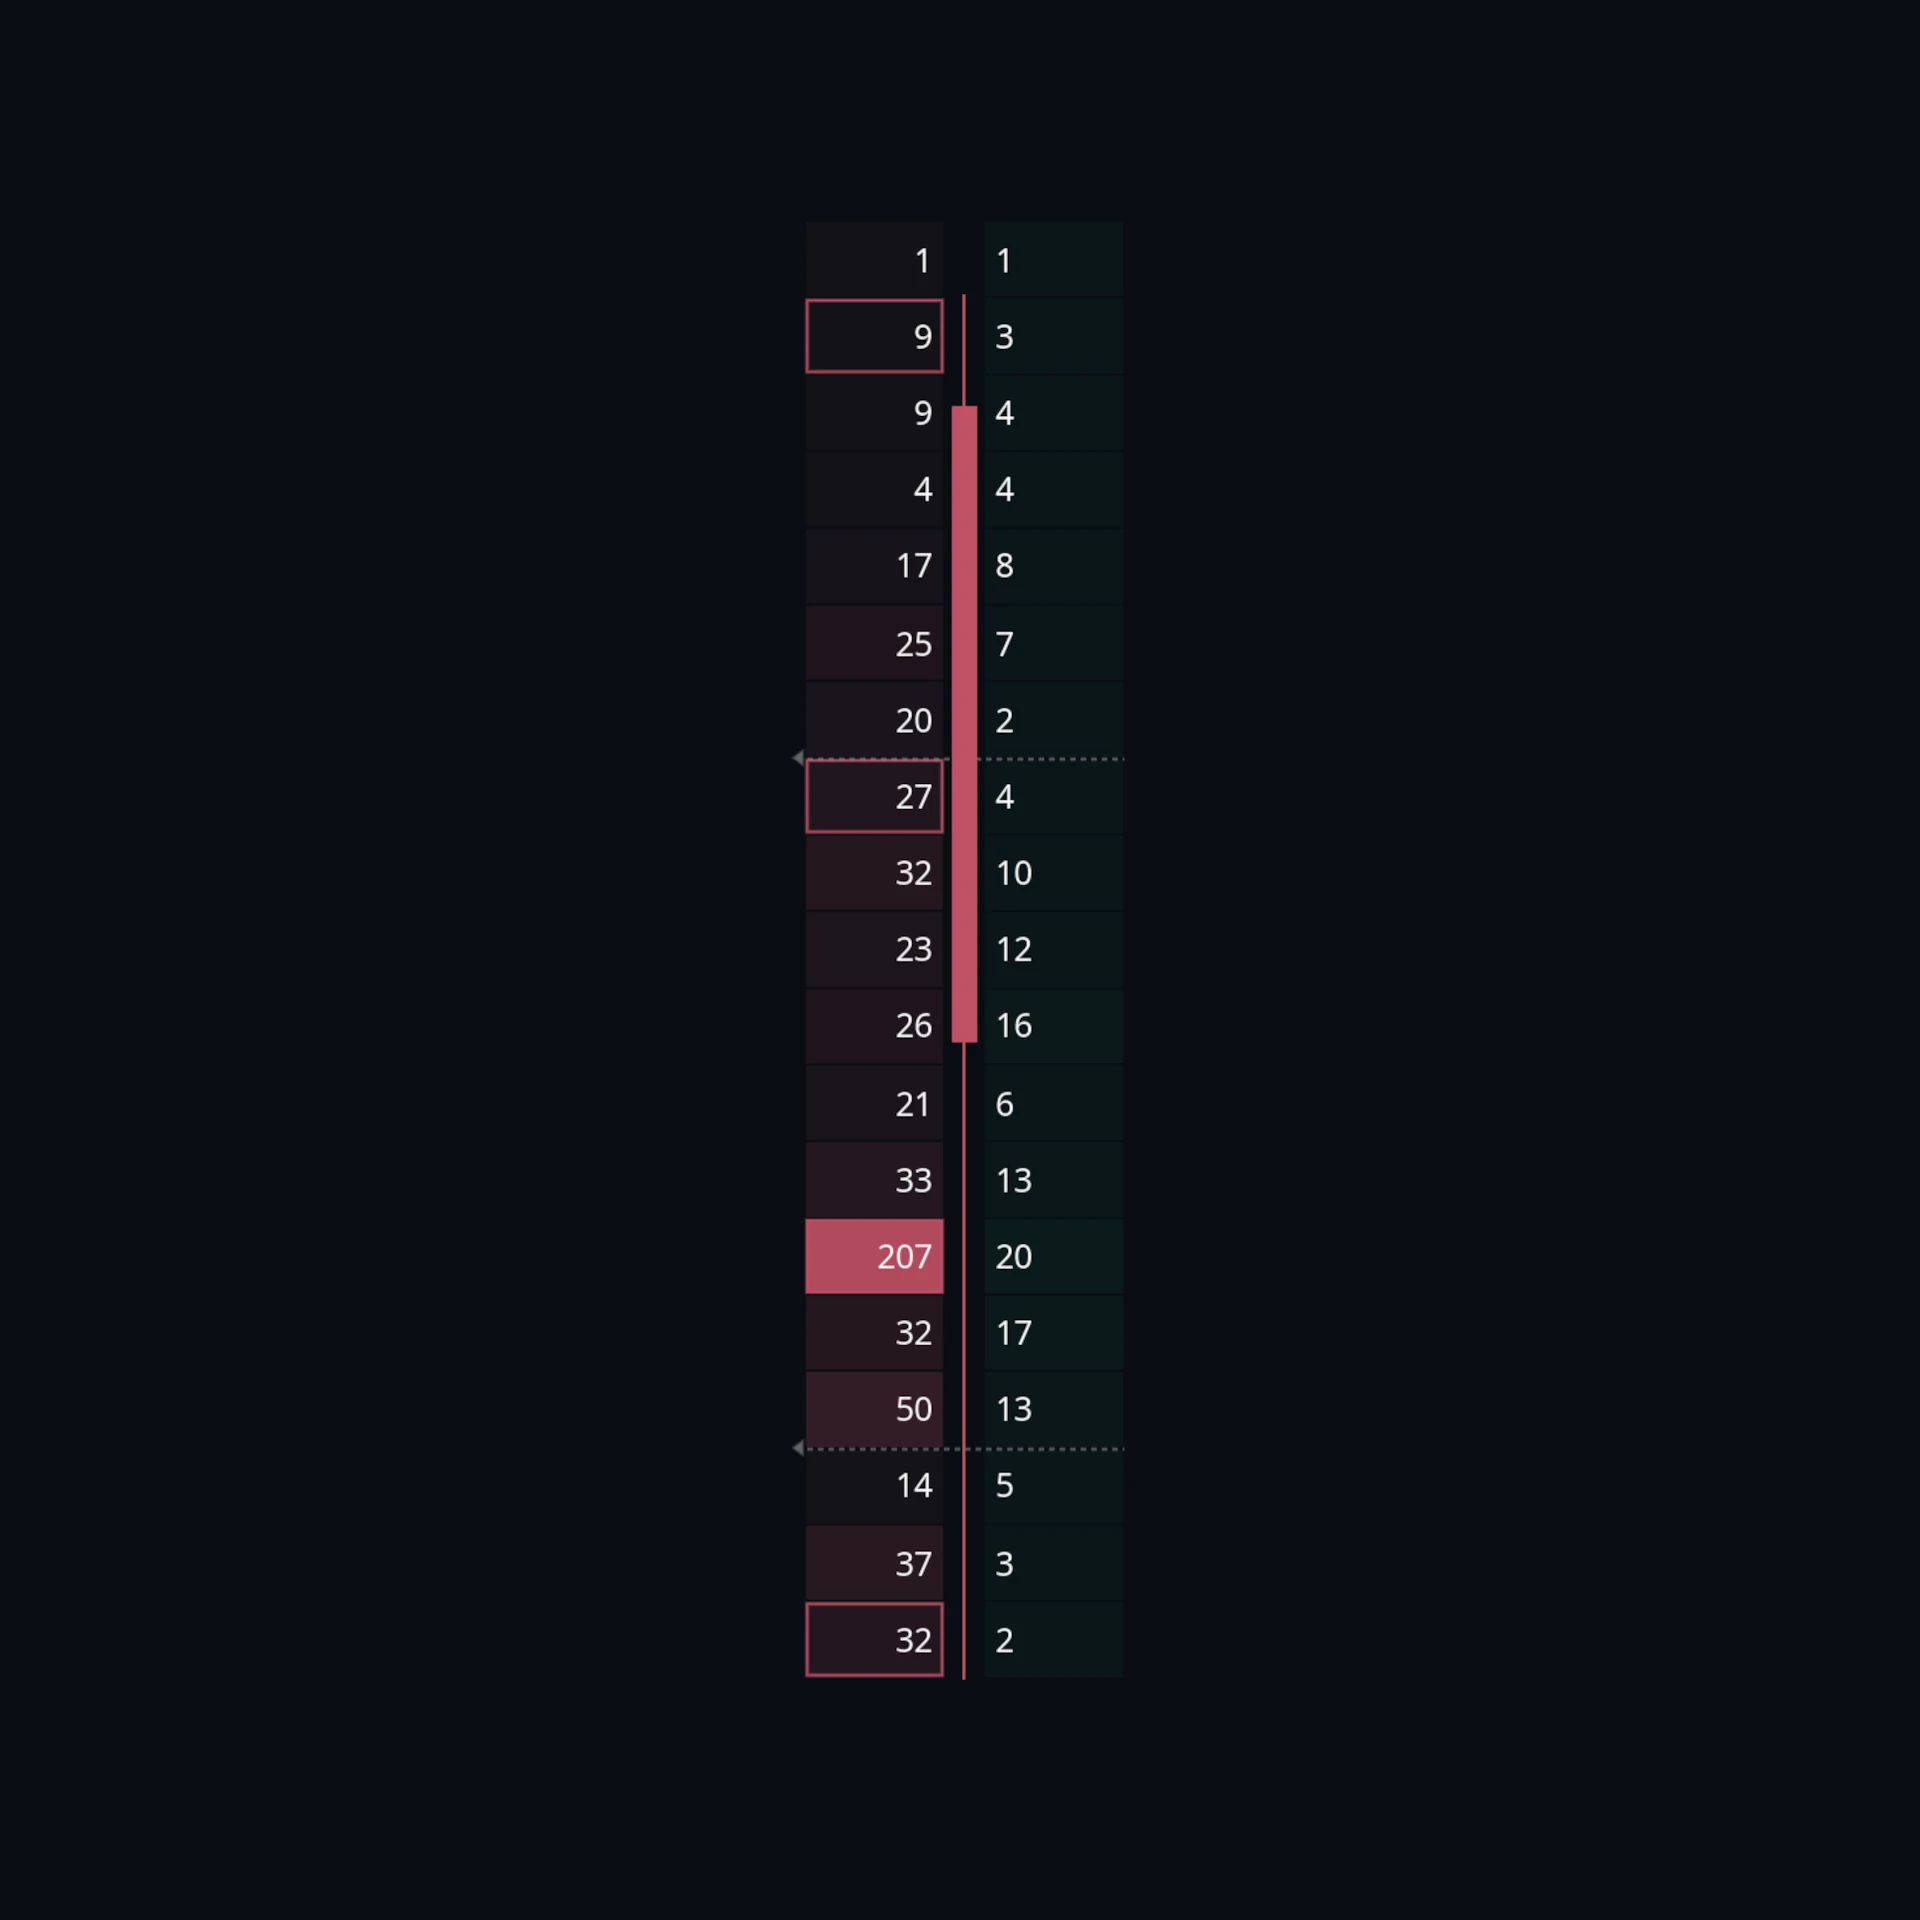
An imbalance is declared when one side exceeds the other by a set ratio, commonly several times over. A ratio of 10 means one side must have traded ten times what the opposing diagonal did. A minimum volume can be required as well, so that a cell with two contracts against zero does not qualify as a meaningful event.
What an imbalance marks is aggression that met no resistance. Somebody bought at that price and almost nobody sold to them there, which means the buying had to reach higher to get filled. Isolated ones are common and mean little. The reason to mark them at all is what they build into.
What are stacked imbalances?
A stacked imbalance is several imbalanced prices in a row, all on the same side.
One imbalance is a moment. Three or four consecutive ones are a stretch of the candle where a single side had it entirely their own way, level after level, with nothing meeting them. That is a genuinely different event, and it leaves a mark on the chart that price often respects later.
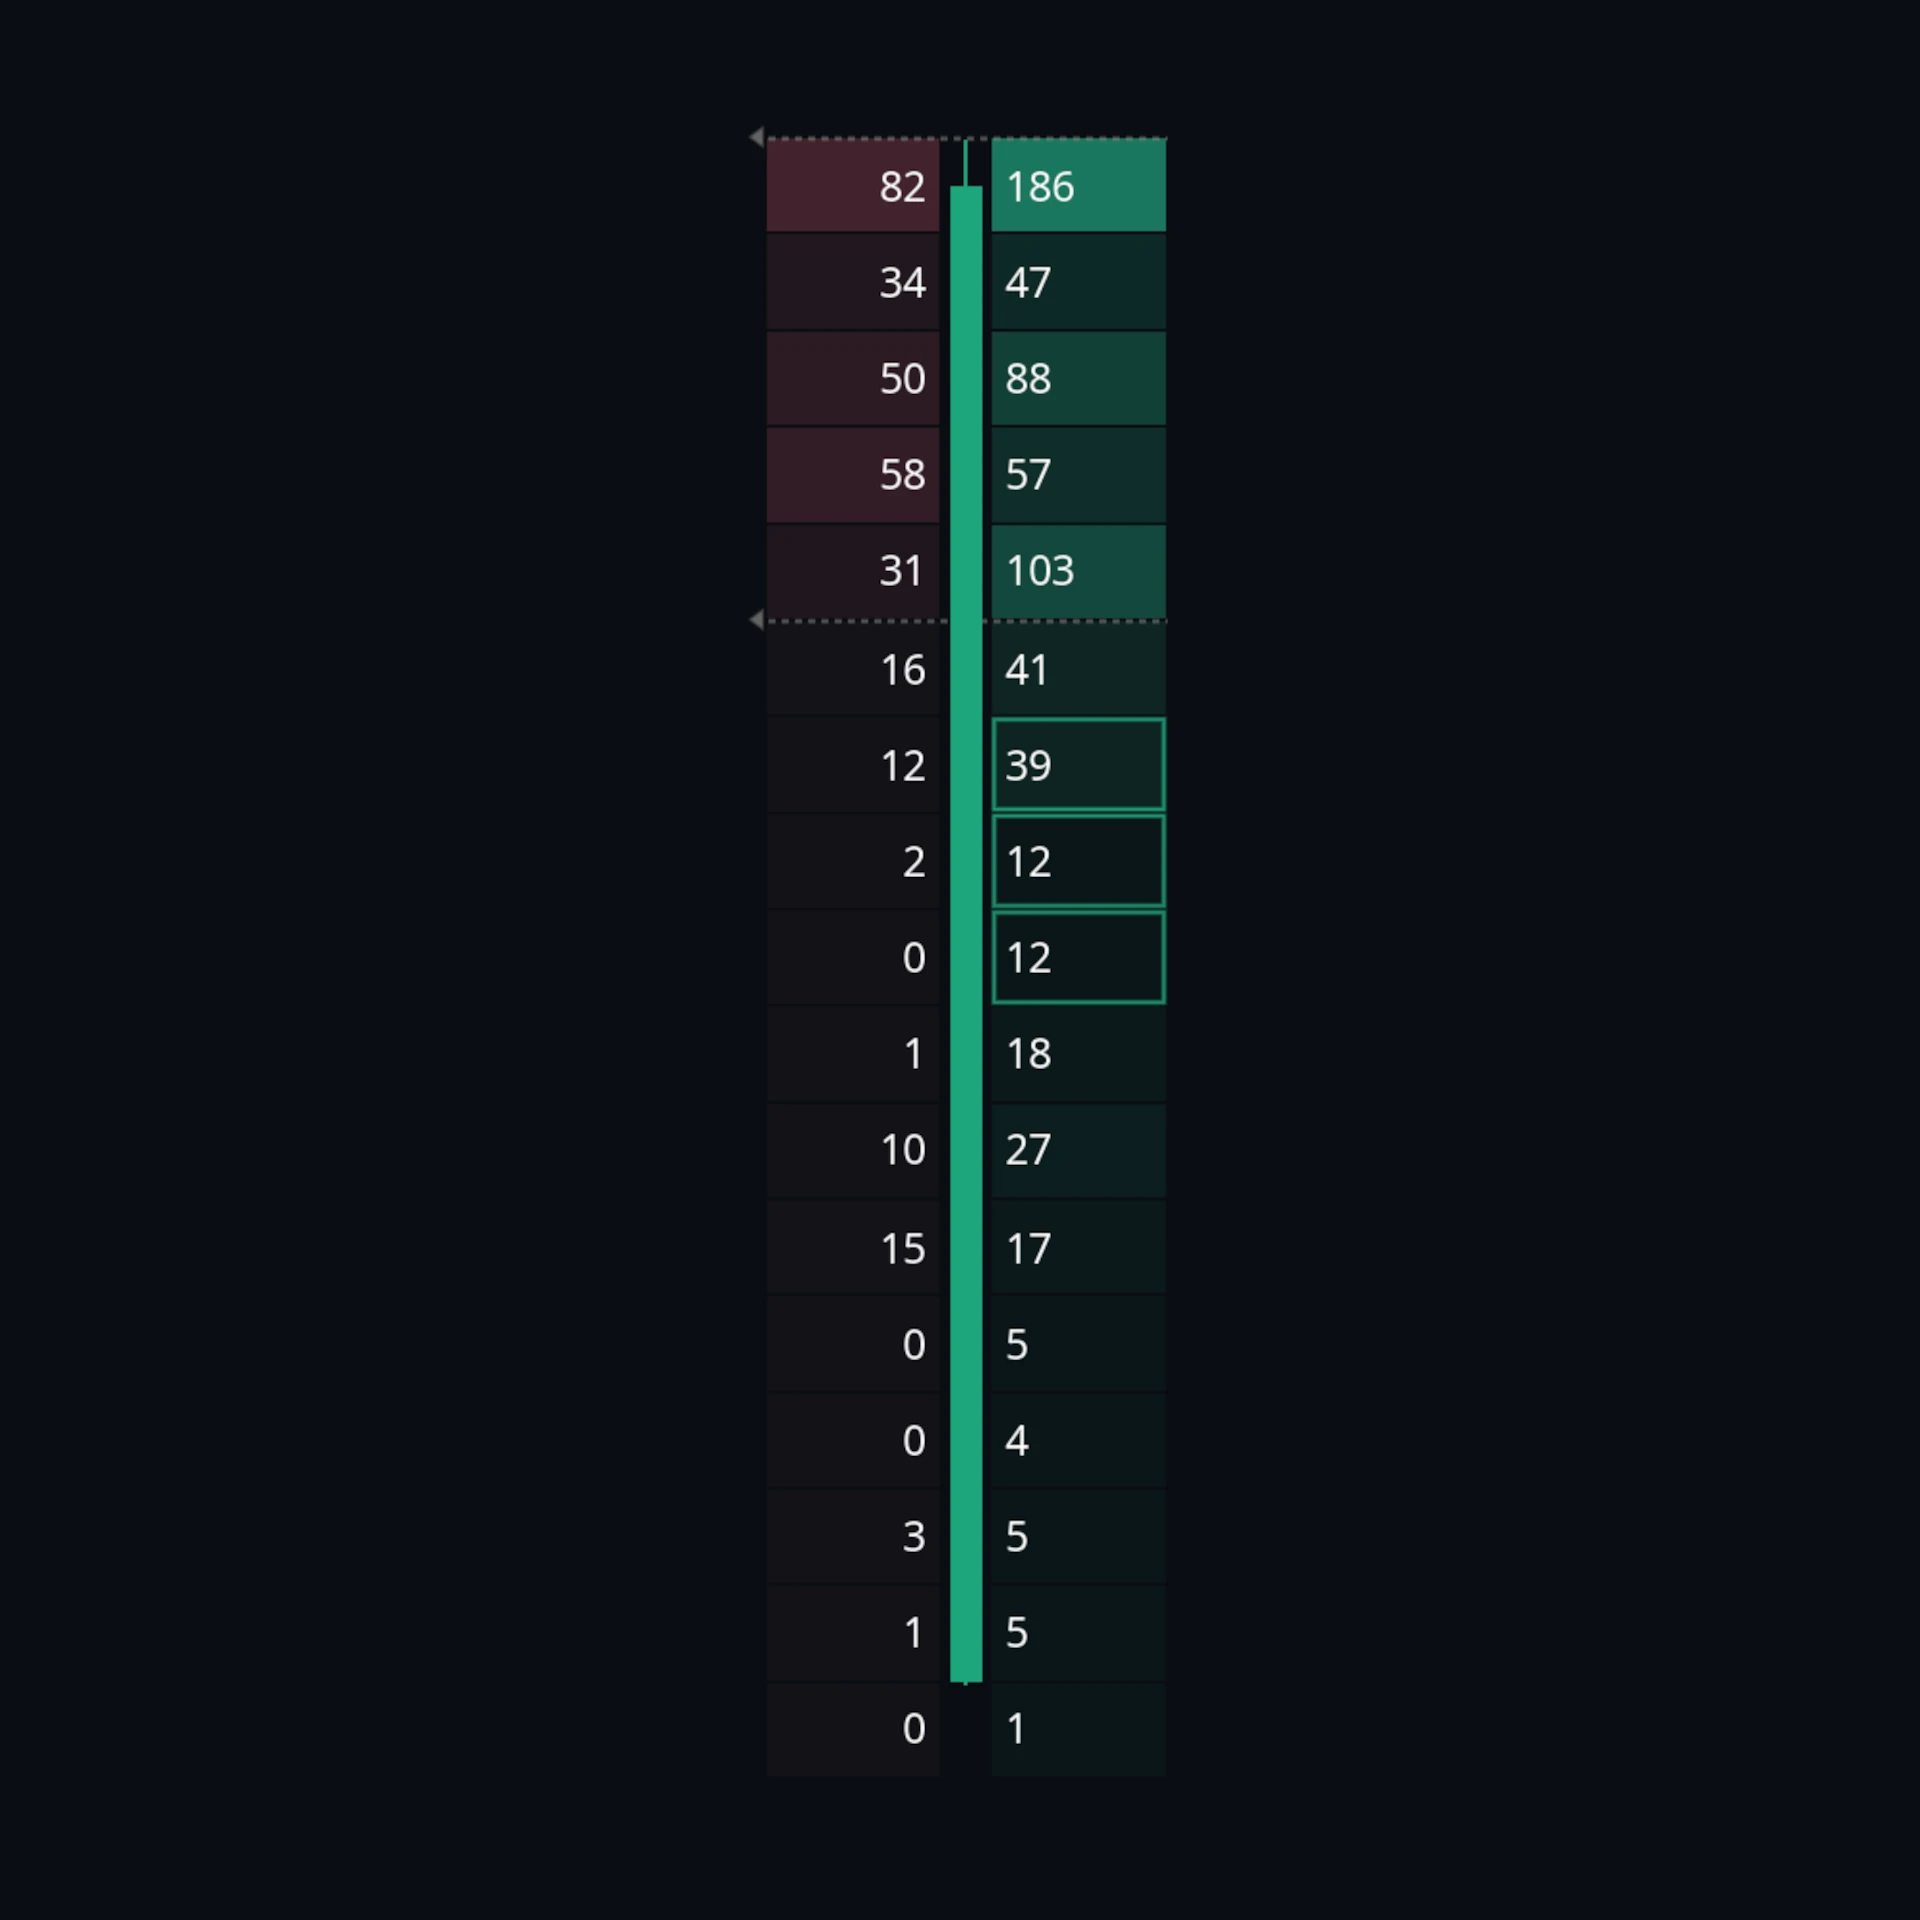
The reason is mechanical. If buyers ran through four consecutive prices without meaningful selling against them, those prices were never properly auctioned. The market skipped them. When price returns, that unfinished area frequently produces a reaction, because the trading that would normally have happened there is still outstanding.
That is why stacked imbalances are worth extending forward as levels. An imbalance that price has not returned to is a level with unfinished business at it; once price trades back through, the level has been filled and stops mattering.
What do the POC and value area mean on a footprint?
Both work exactly as they do on a volume profile, except computed per candle rather than per range.
The point of control is the single price within the bar where the most volume traded: the level that candle agreed on most. Tracked across consecutive candles it traces where agreement is moving, and a POC that has not been revisited stays relevant as a level.
The value area is the range of prices holding the bulk of that candle’s volume, 70% by convention. It marks which part of the bar was genuine two-way business and which part was price passing through.
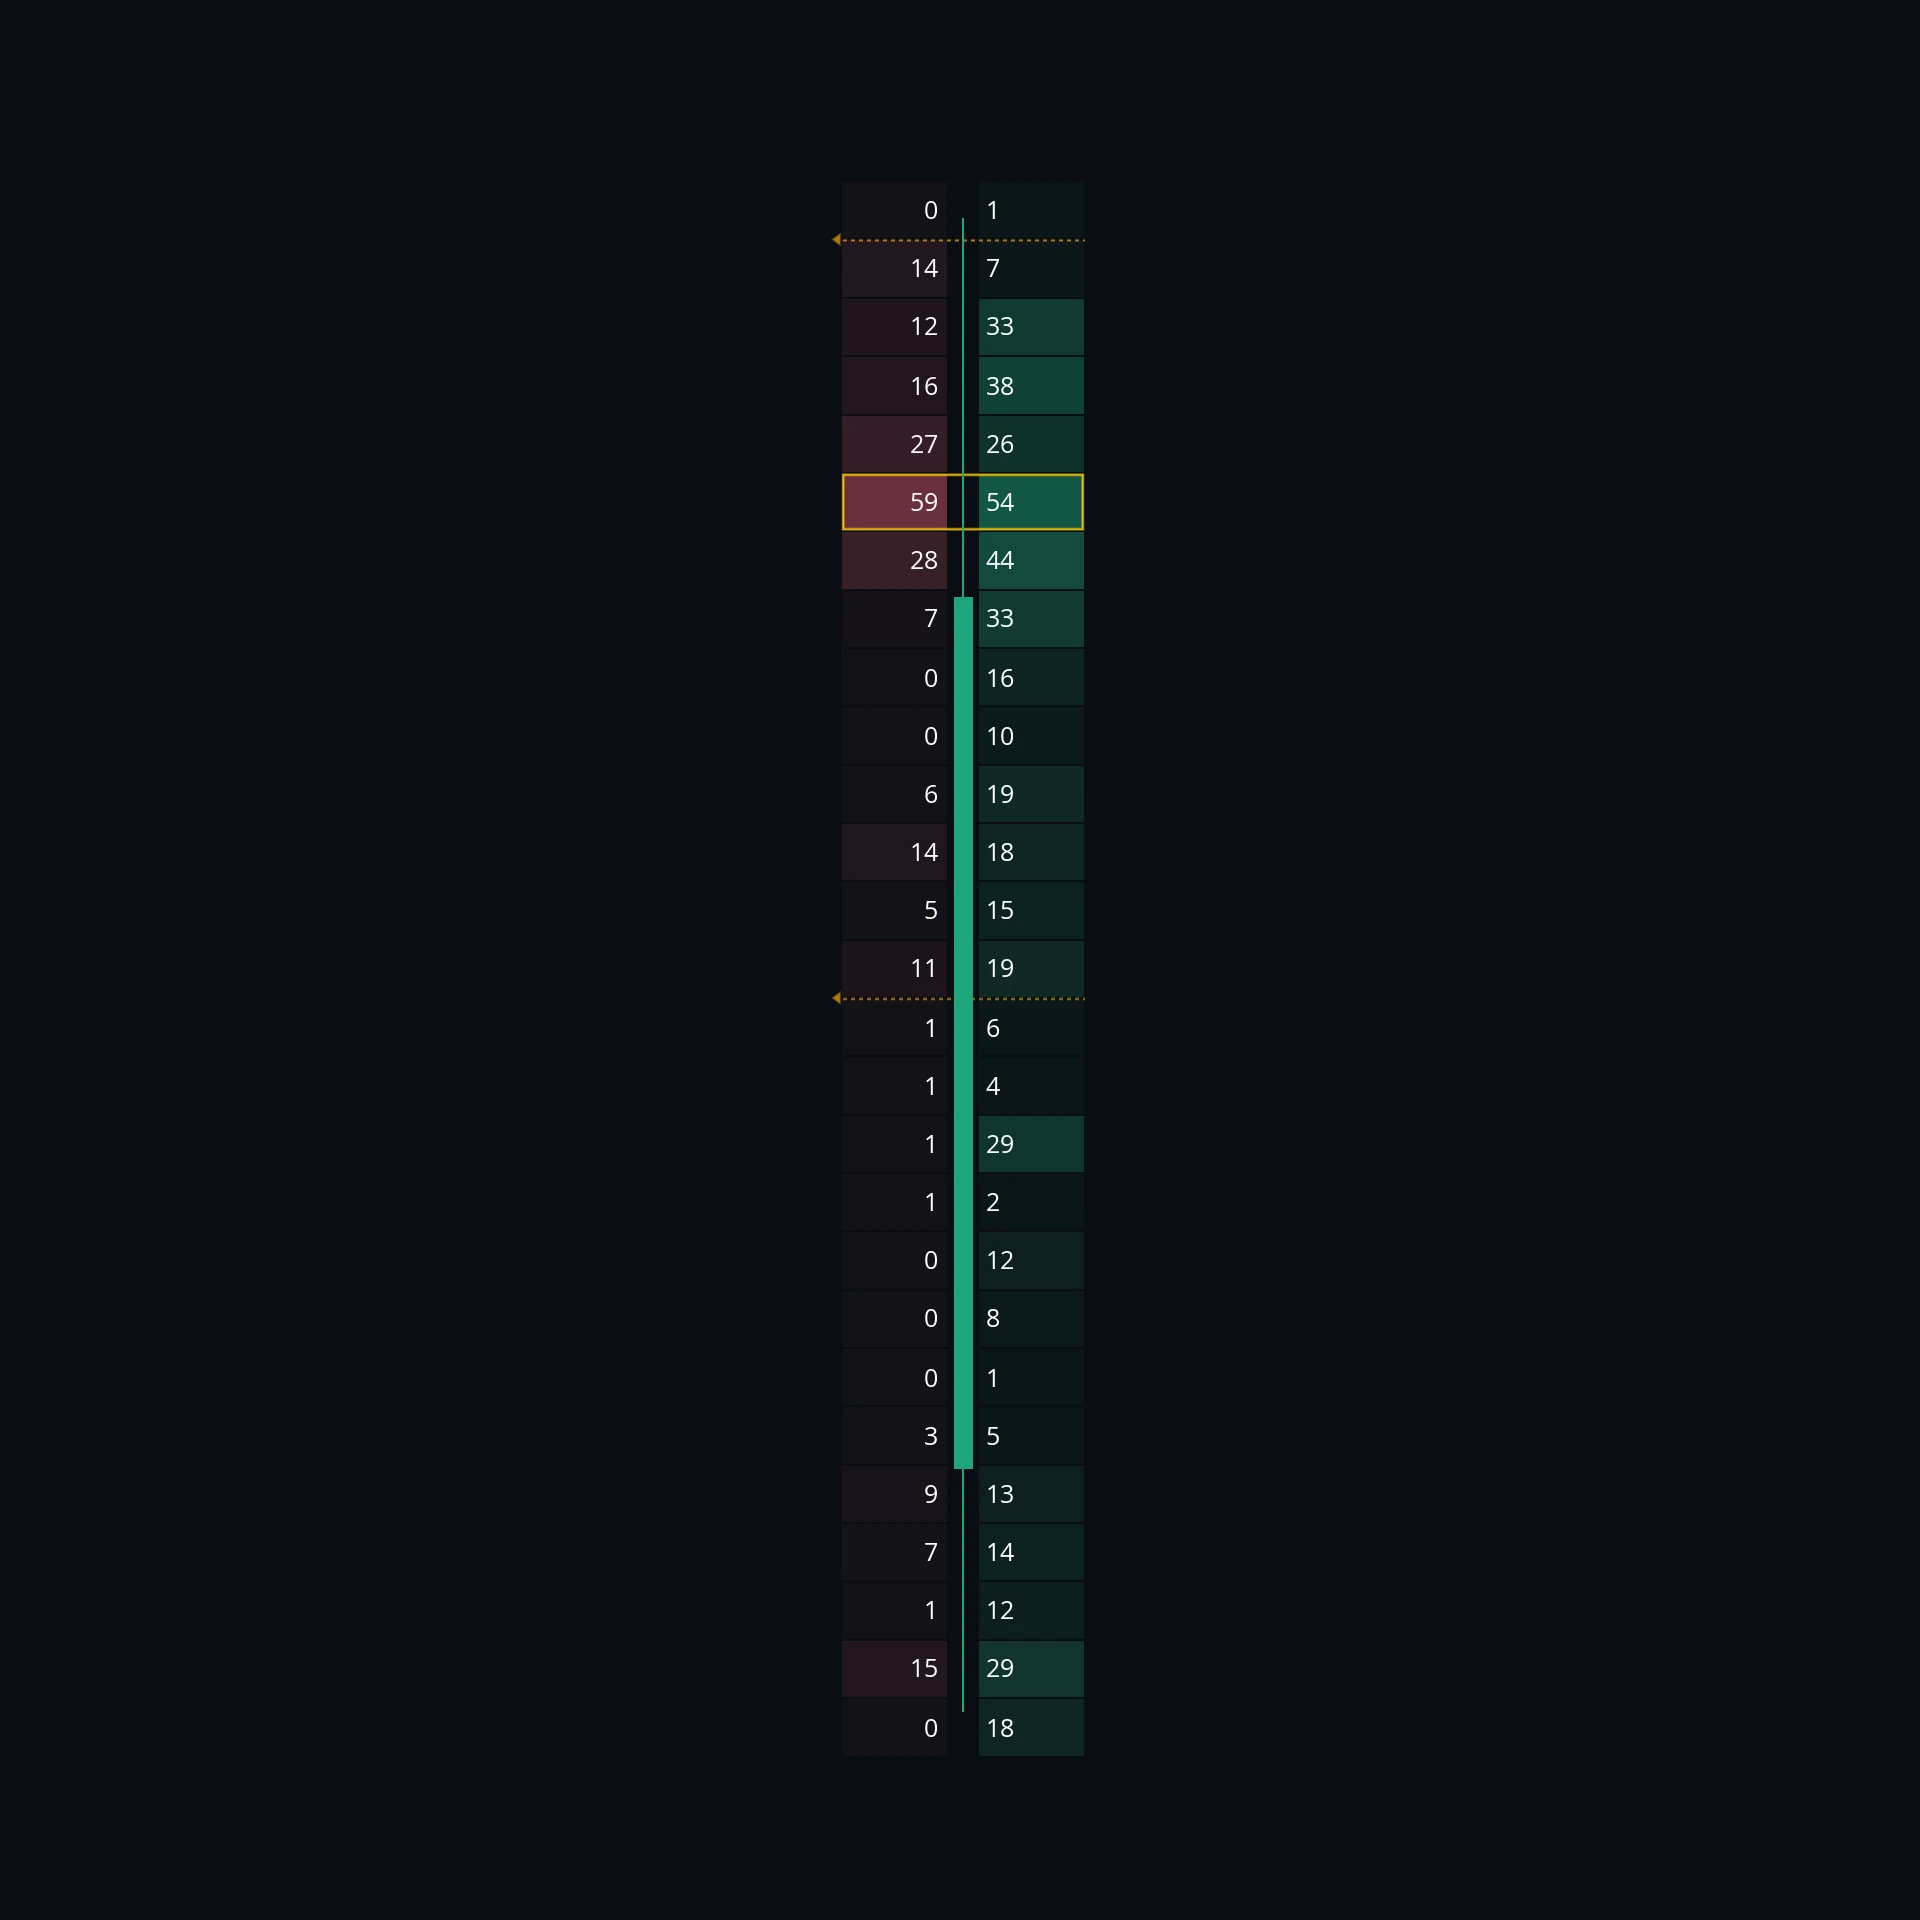
Both are far more useful read across several candles than within one. A run of candles whose points of control step steadily higher is a market moving its agreed price up, which is a cleaner statement of a trend than the closes are.
What are the limits of footprint charts?
They demand zoom. A footprint is unreadable on more than a few dozen candles. It is a tool for examining a specific area, not for scanning.
They are noisy at fine granularity. Row height changes the reading entirely. Too fine and every candle is a wall of small numbers; too coarse and the detail that justifies the chart type is aggregated away.
Aggressor classification is the exchange’s. Everything rests on the venue correctly reporting which side crossed the spread.
Imbalances are common. Marking every one produces a chart covered in flags. The information is in the stacked ones and in where they sit, not in the count.
It is one venue unless aggregated. A footprint from a single exchange describes that exchange’s participants.
Related: Volume delta · CVD · VPVR · Tape reading · Bar statistics
Using Footprint in MMT
MMT’s footprint has two display types, three data modes and independent control over what each cell prints, so the same chart can be configured to answer quite different questions. Imbalances, per-candle POC and value area, a side profile and a range summary can all be layered on.
How do you add a footprint?
There are two routes, and they do different things.
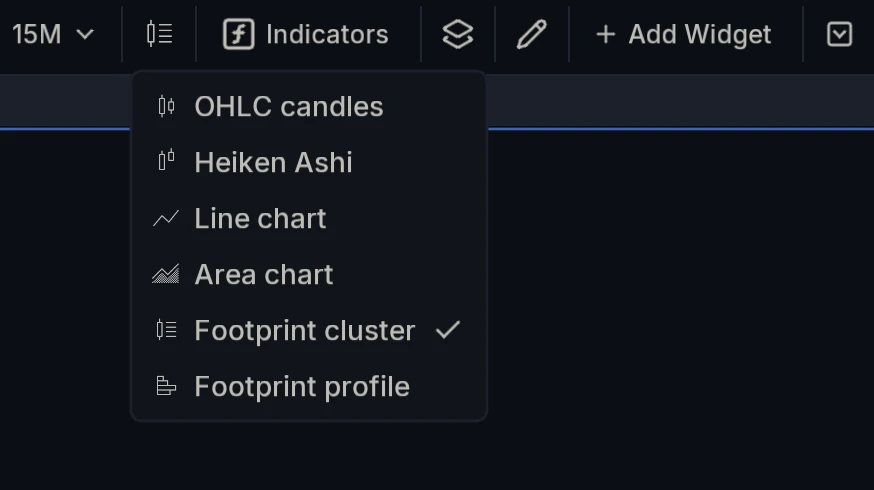
As a chart type. The chart type selector in the toolbar offers Footprint cluster and Footprint profile alongside OHLC candles, Heiken Ashi, Line and Area. Choosing one switches the chart widget itself, so the OHLC candles are drawn with footprints around them. This is the usual way in.
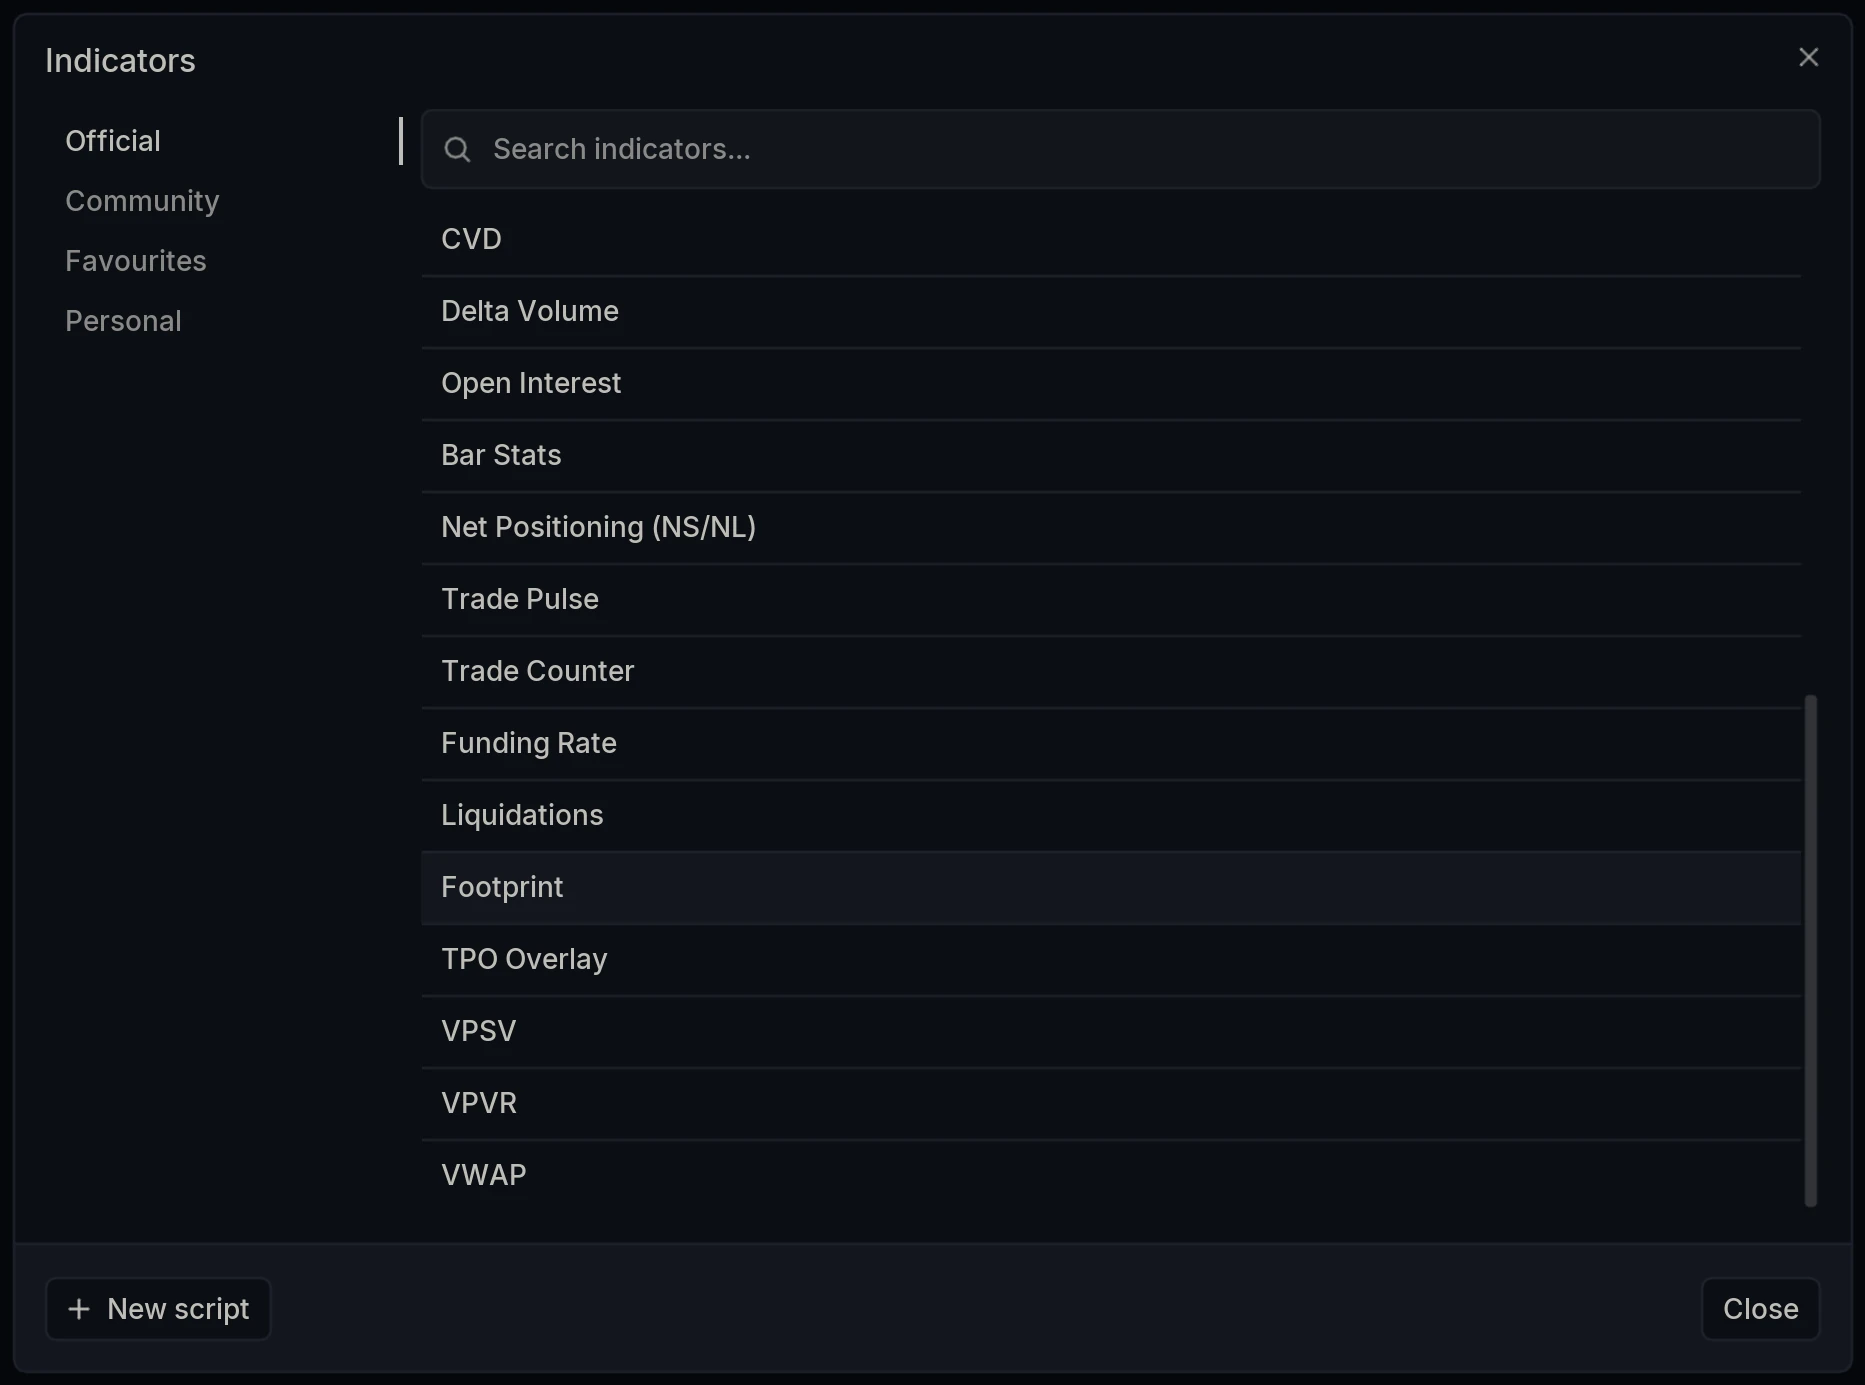
As an indicator. Open the Indicators dialog and select Footprint under Official, which adds it as a layer rather than changing the chart type.
Cluster or profile?
Display sets which of the two shapes the footprint takes.
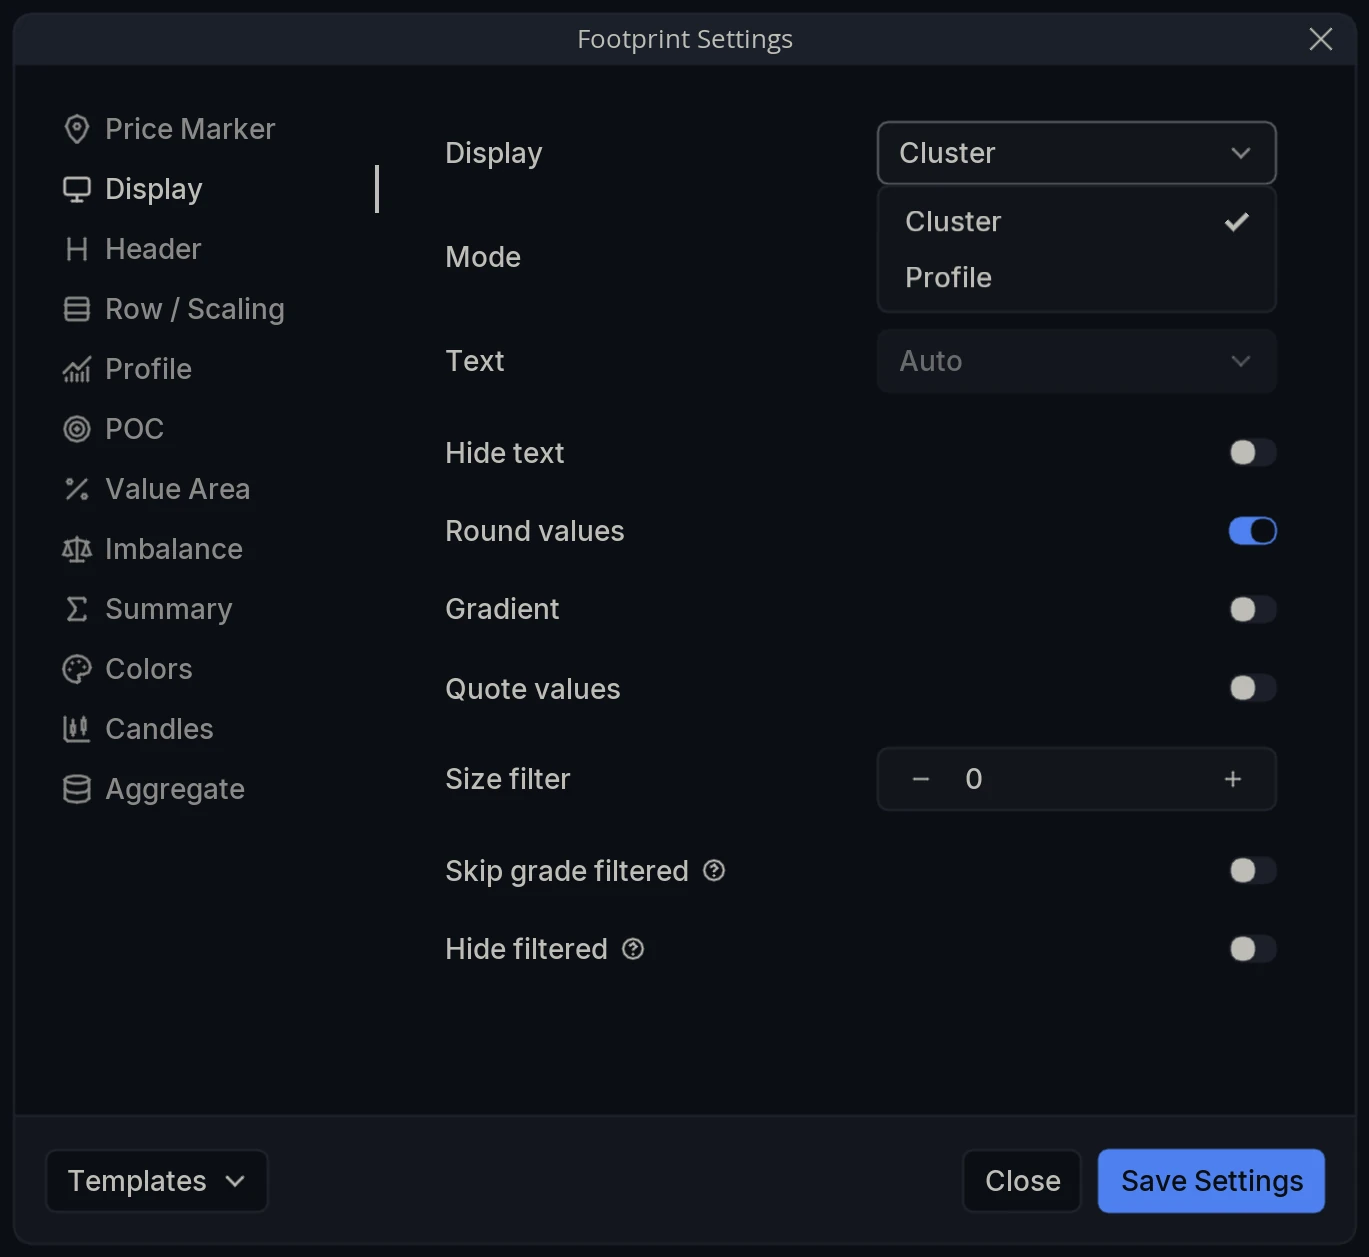
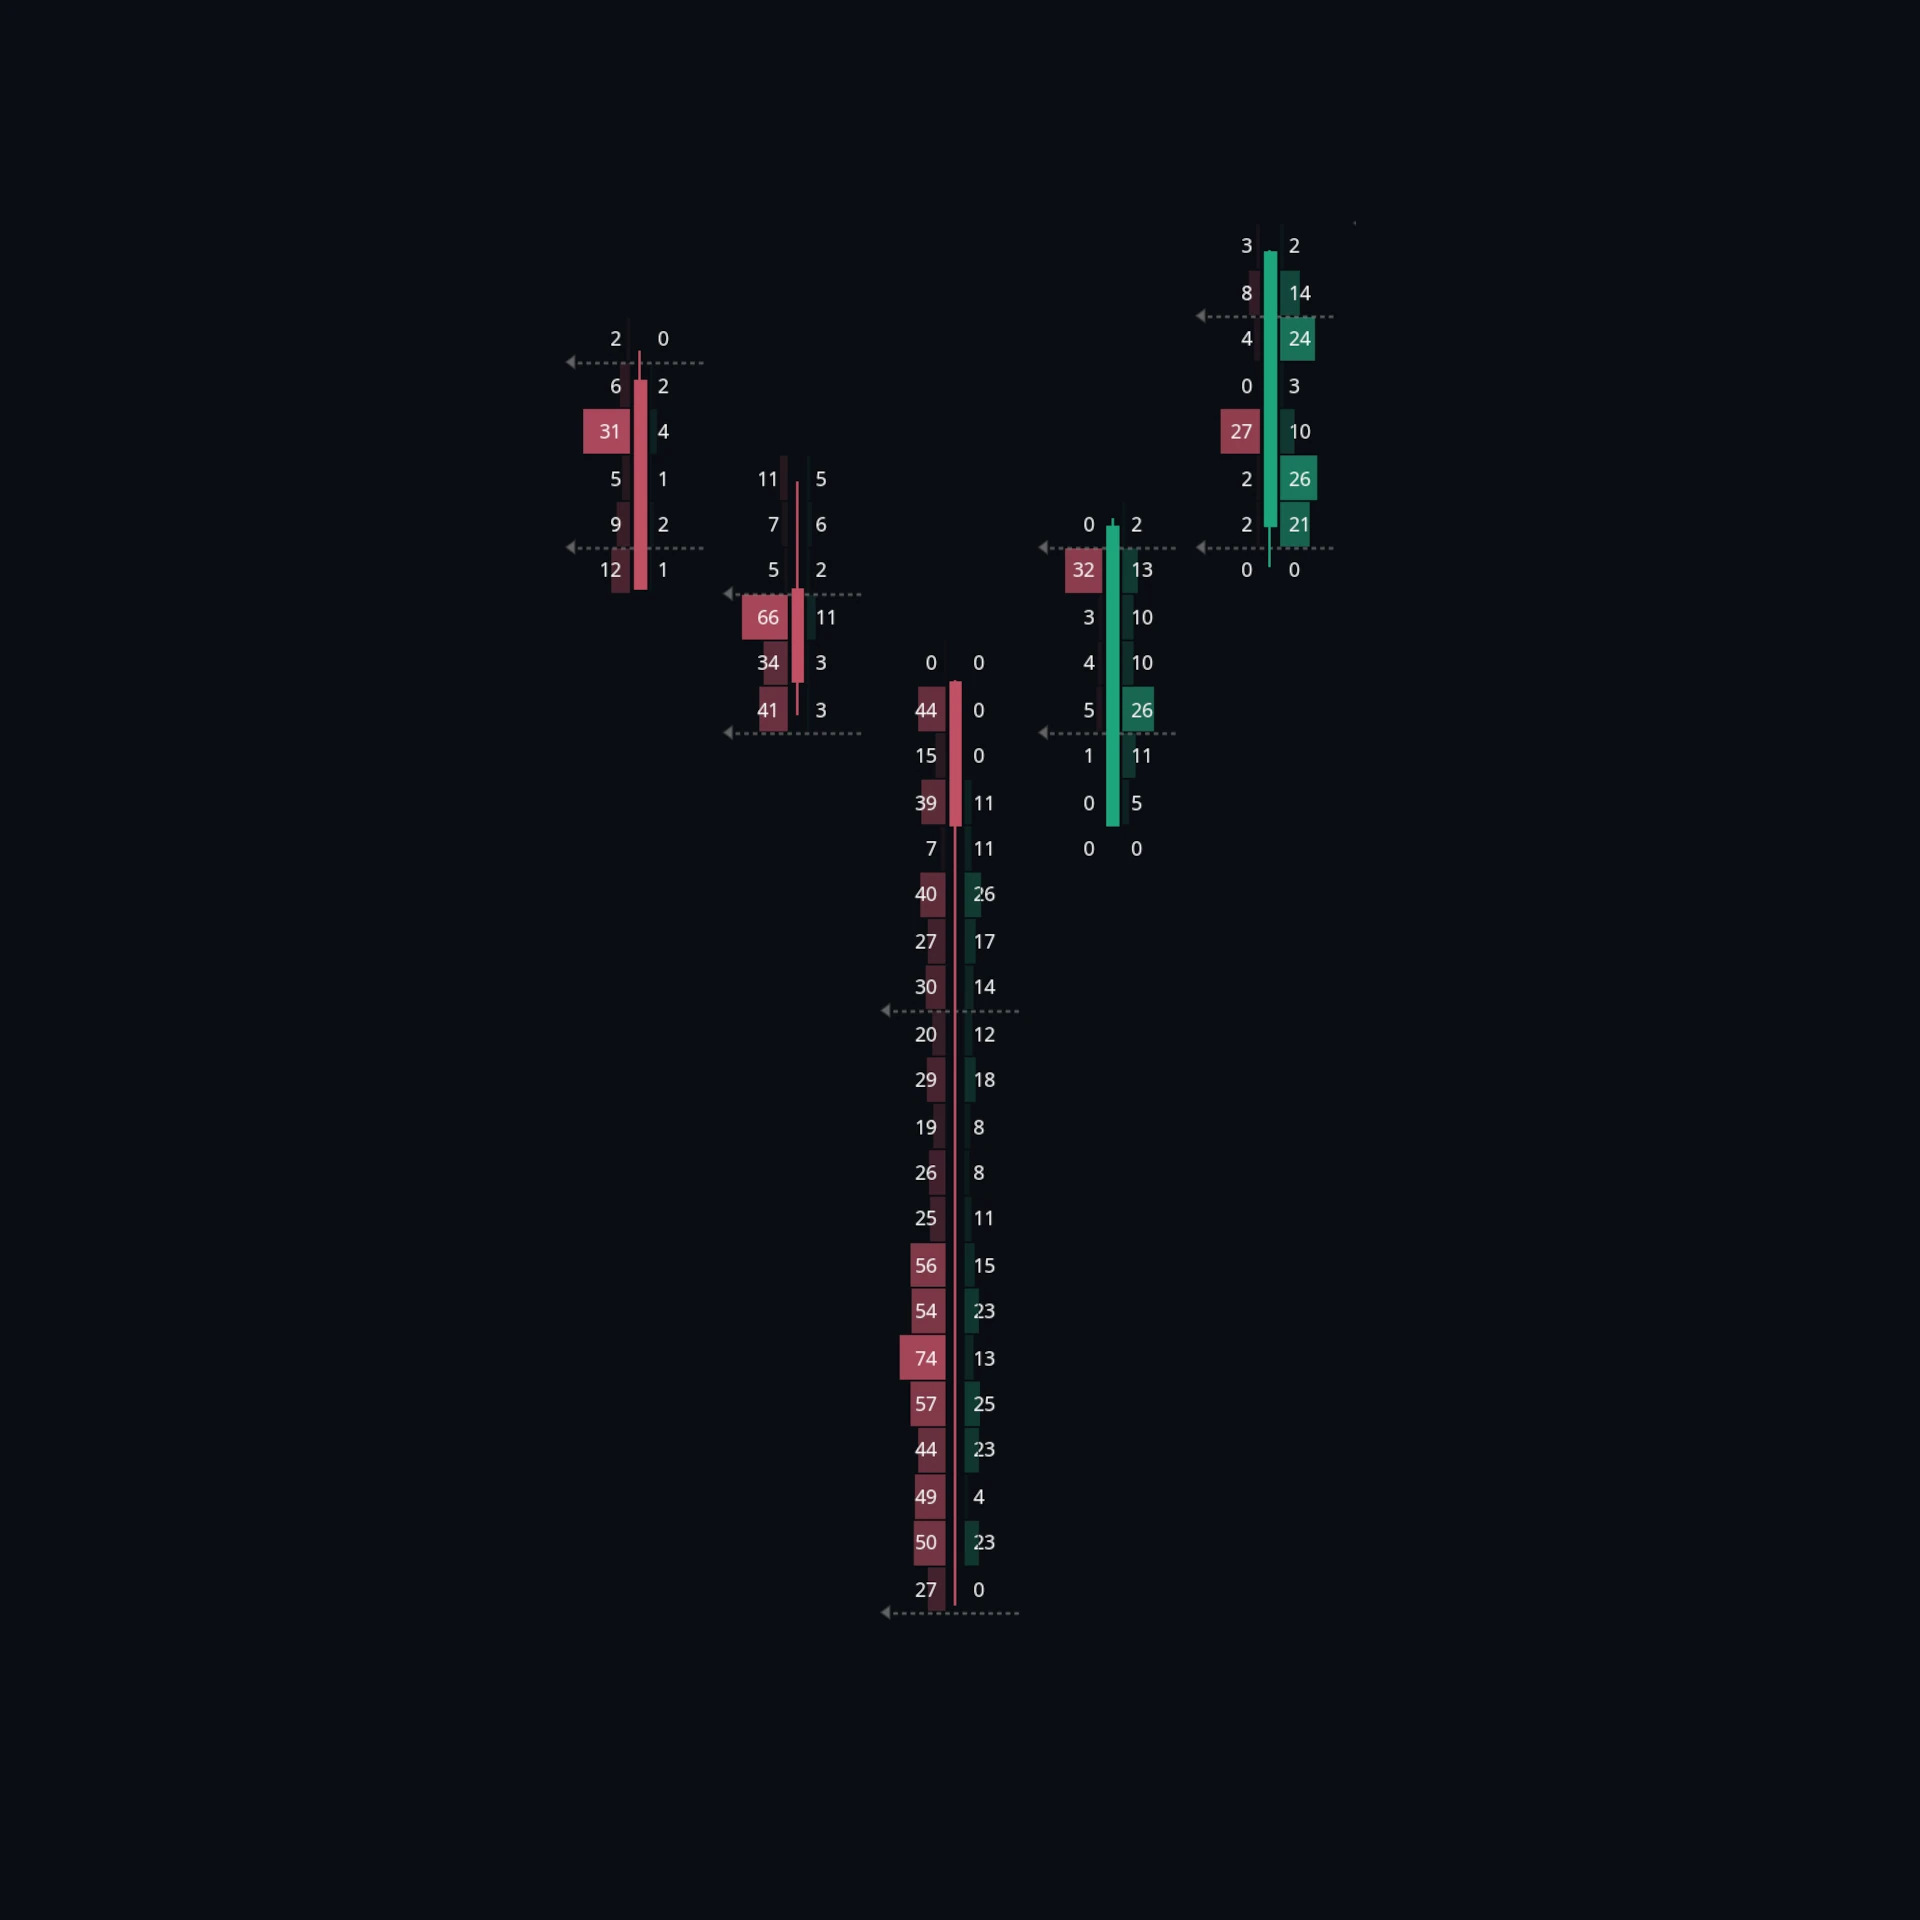
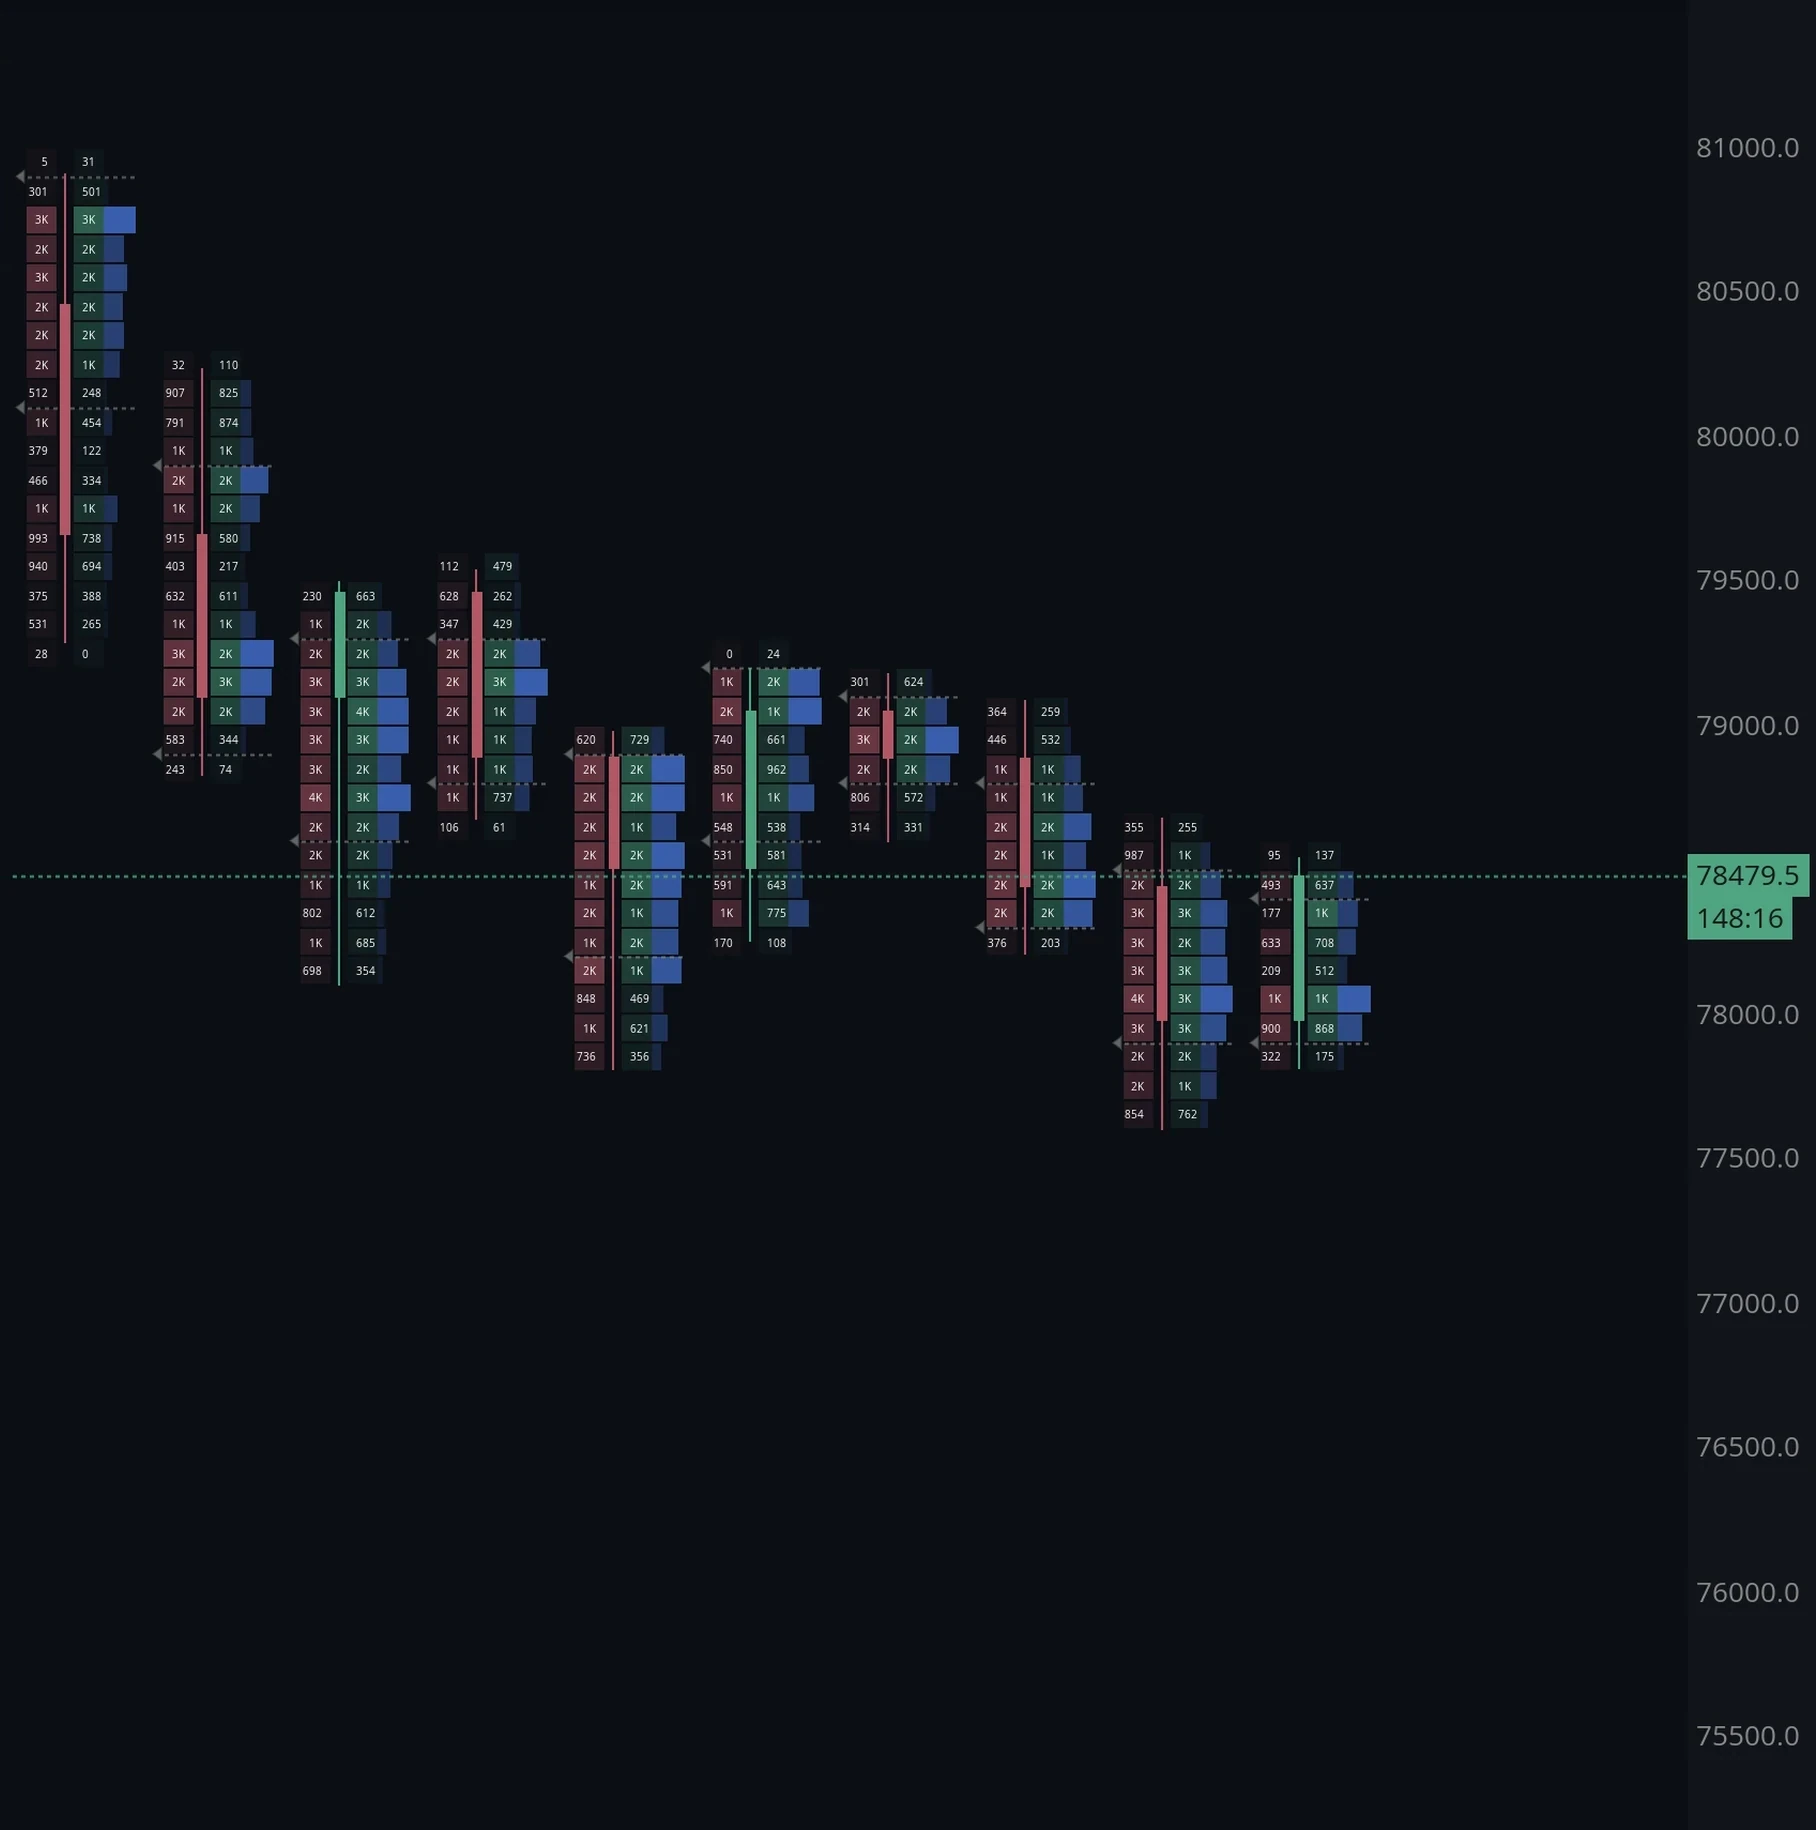
Cluster draws every price level as a filled cell of the same size, so the grid is even and the numbers are what you read. Profile draws each level as a bar whose length reflects its volume, like a volume profile turned on its side per candle, so the shape is what you read.
What do the three modes show?
Mode decides what data fills the footprint, and it applies to both display types.
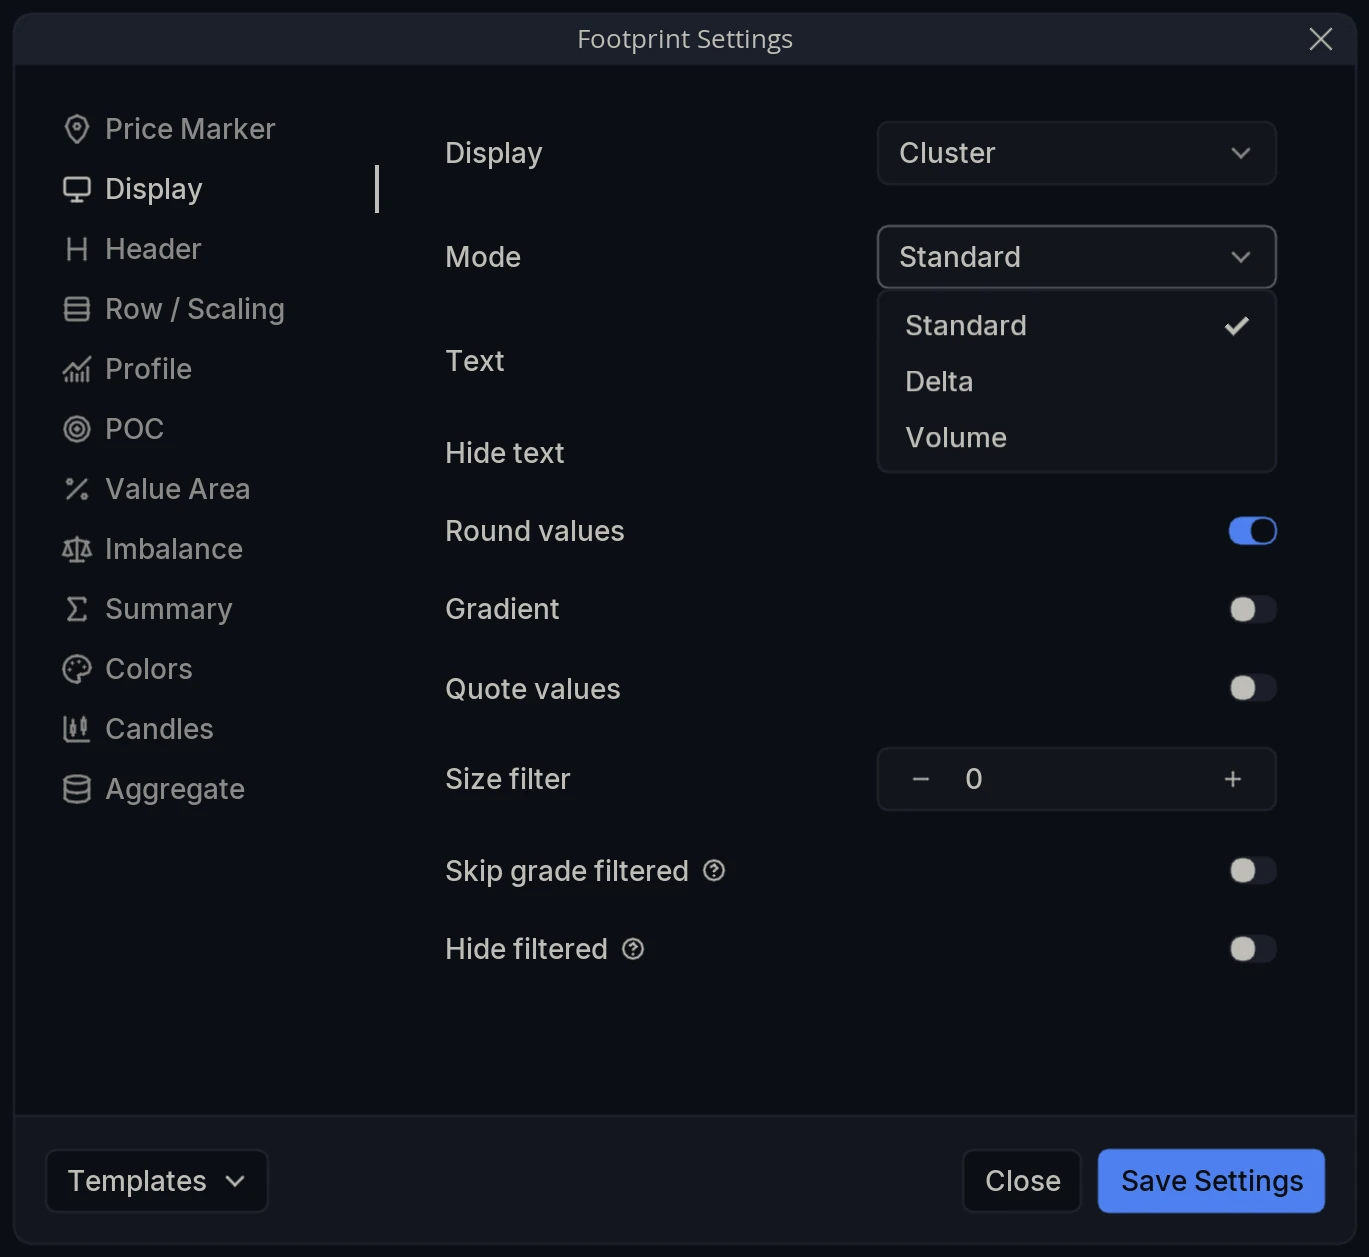
Standard is the classic bid against ask: sell volume and buy volume side by side at each price, two numbers per row.
Delta collapses that to one number per row, the net of the two, so each level shows which side won rather than what both did.
Volume also gives one number per row, the combined total that traded at that price regardless of side.
What does the Text setting do?
Text controls only what is printed inside the cells. It is independent of the coloring, which is what makes the layer properly customizable: the clusters can be colored by delta while the figures inside them show something else entirely.
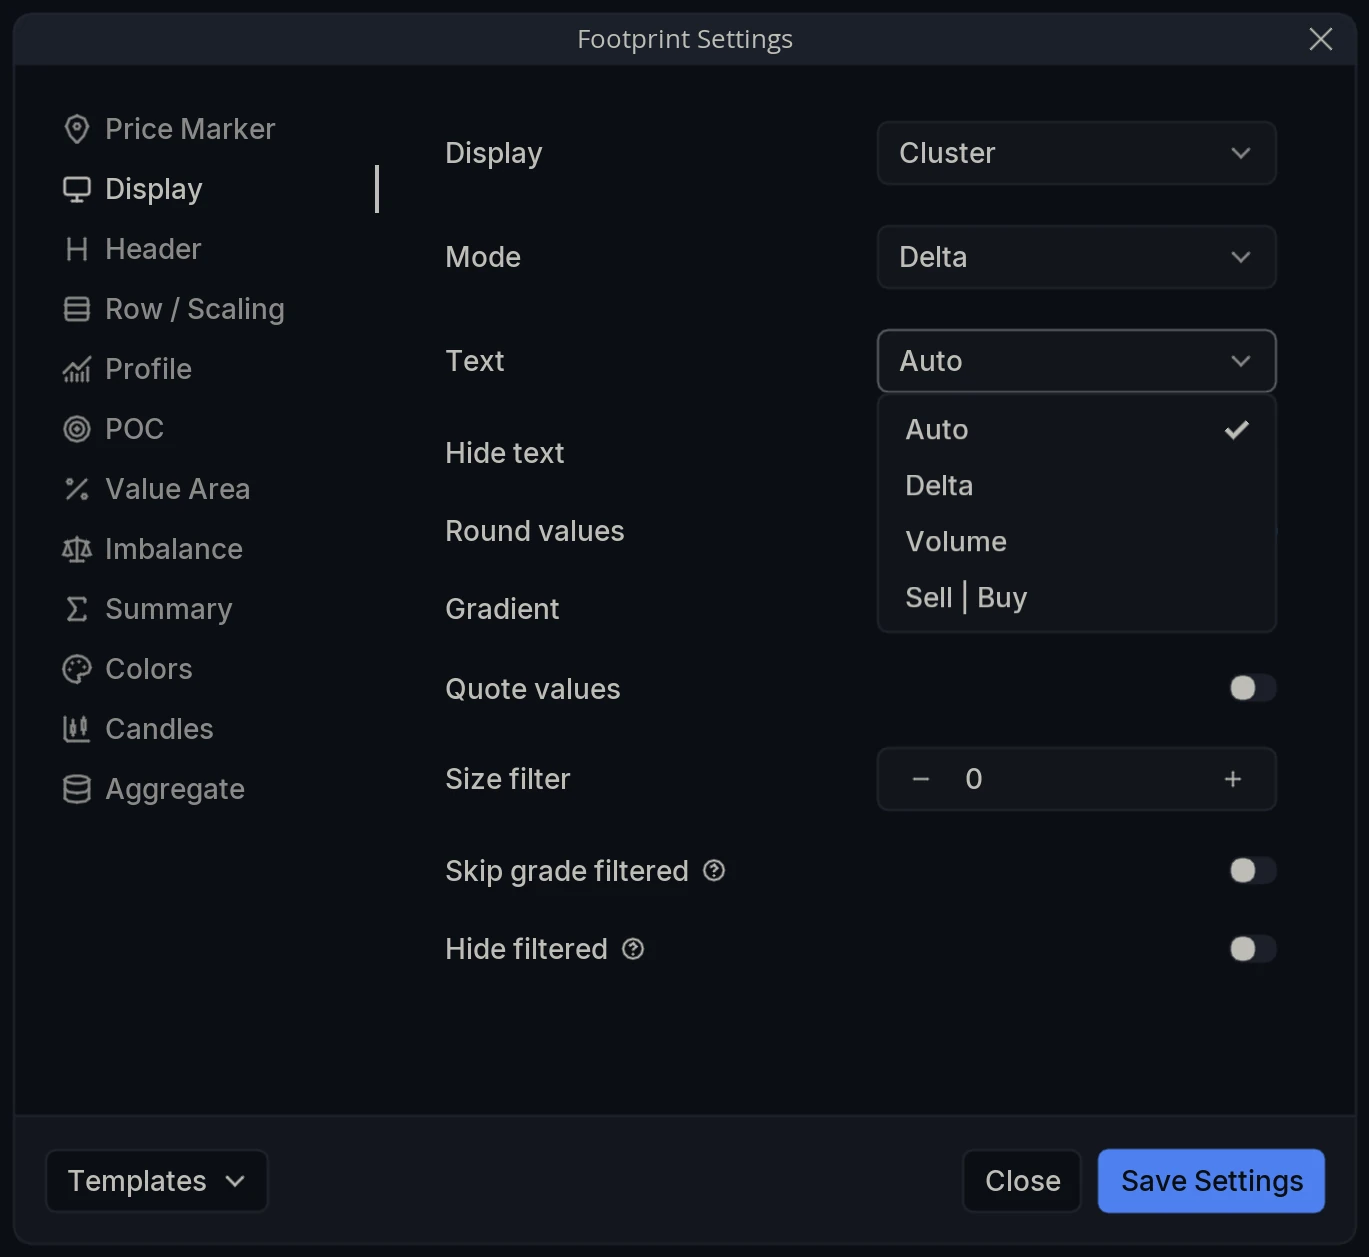
In Standard mode the only figures available are bid and ask volume. In Delta mode, Auto prints the delta, but you can instead print volume or the sell and buy figures inside delta-colored cells. In Volume mode, Auto prints volume.
How do imbalances work?
Enable imbalance turns the marking on. The settings beneath it decide what qualifies.
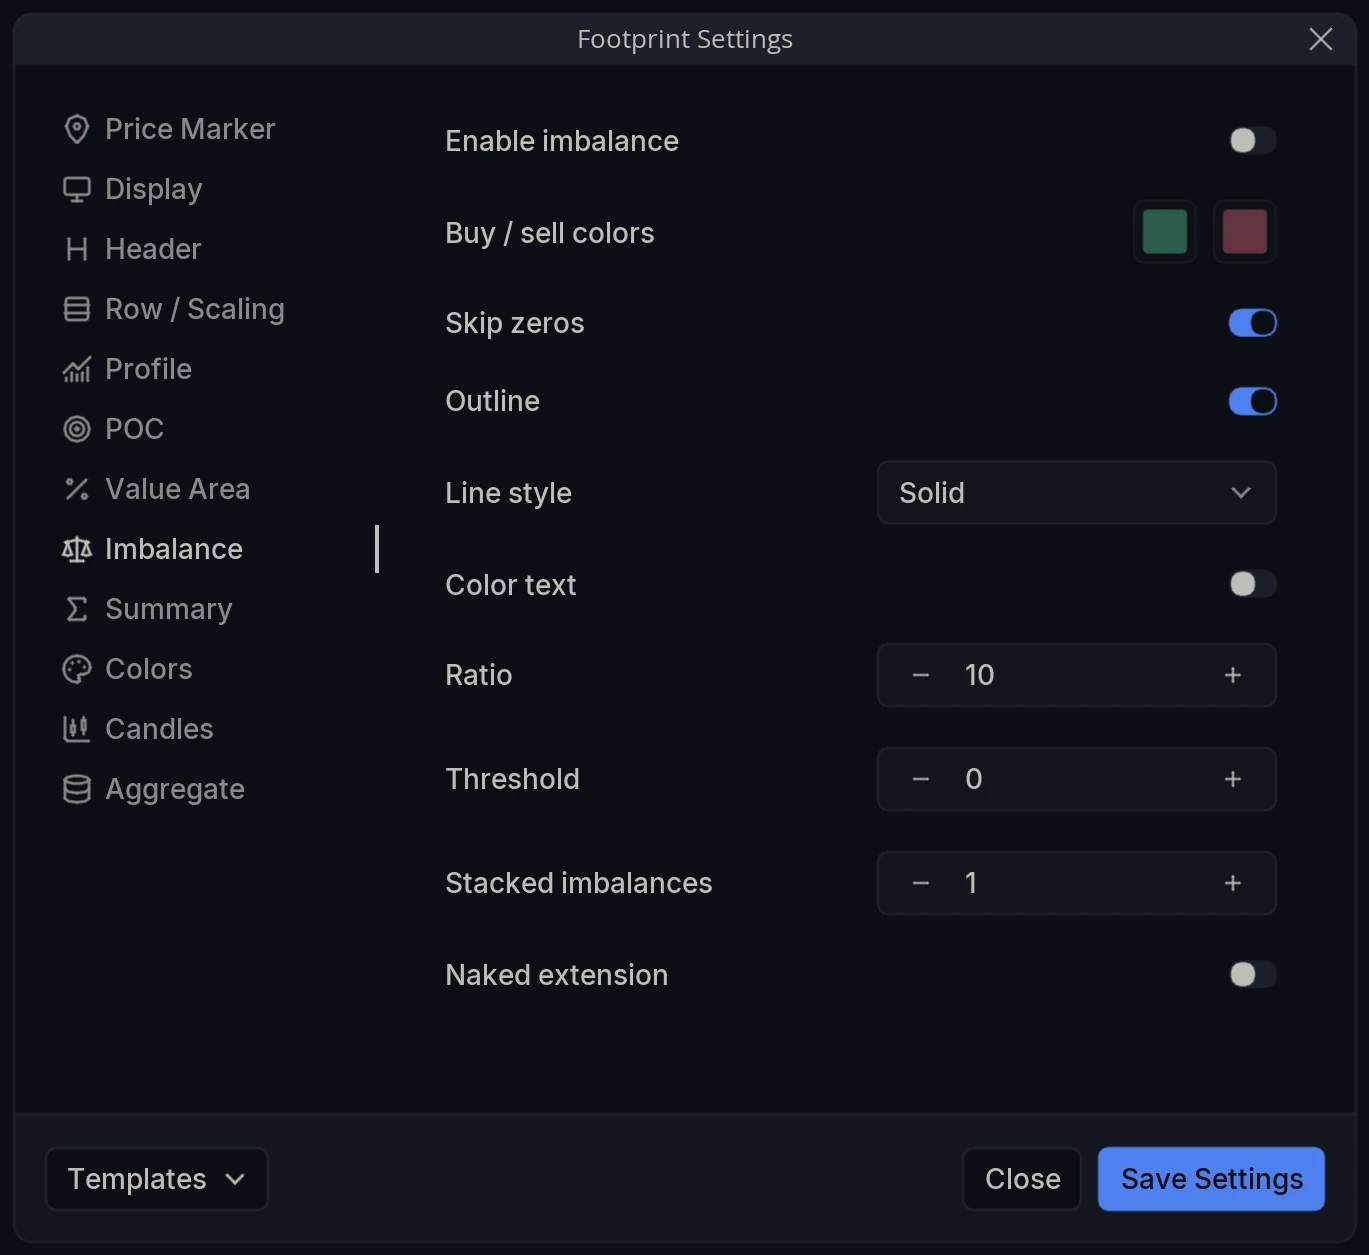
Ratio is how many times larger one side must be than its diagonal opposite. At 10, one side must have traded ten times the other.
Threshold is the minimum volume required before a cell can be flagged at all. Below it, the cell is ignored however lopsided it is. Ratio 10 with Threshold 0 means any volume qualifies as long as the ratio holds; raising the threshold filters out the small stuff.
Stacked imbalances sets how many consecutive imbalanced rows are needed before the run is marked, which is the setting that separates isolated flags from the pattern worth watching.
Naked extension carries an imbalance forward as a level until a candle reaches it, at which point the extension stops.
Skip zeros ignores rows where one side traded nothing. Outline, Line style and Buy / sell colors control how a flagged cell is drawn: the cell itself is always highlighted, and Color text extends that coloring to the figures inside it as well.
What is the summary column?
Show summary draws a single tall footprint at the right-hand edge of the chart that aggregates every footprint candle in the range, so you can read the composite alongside the individual bars.
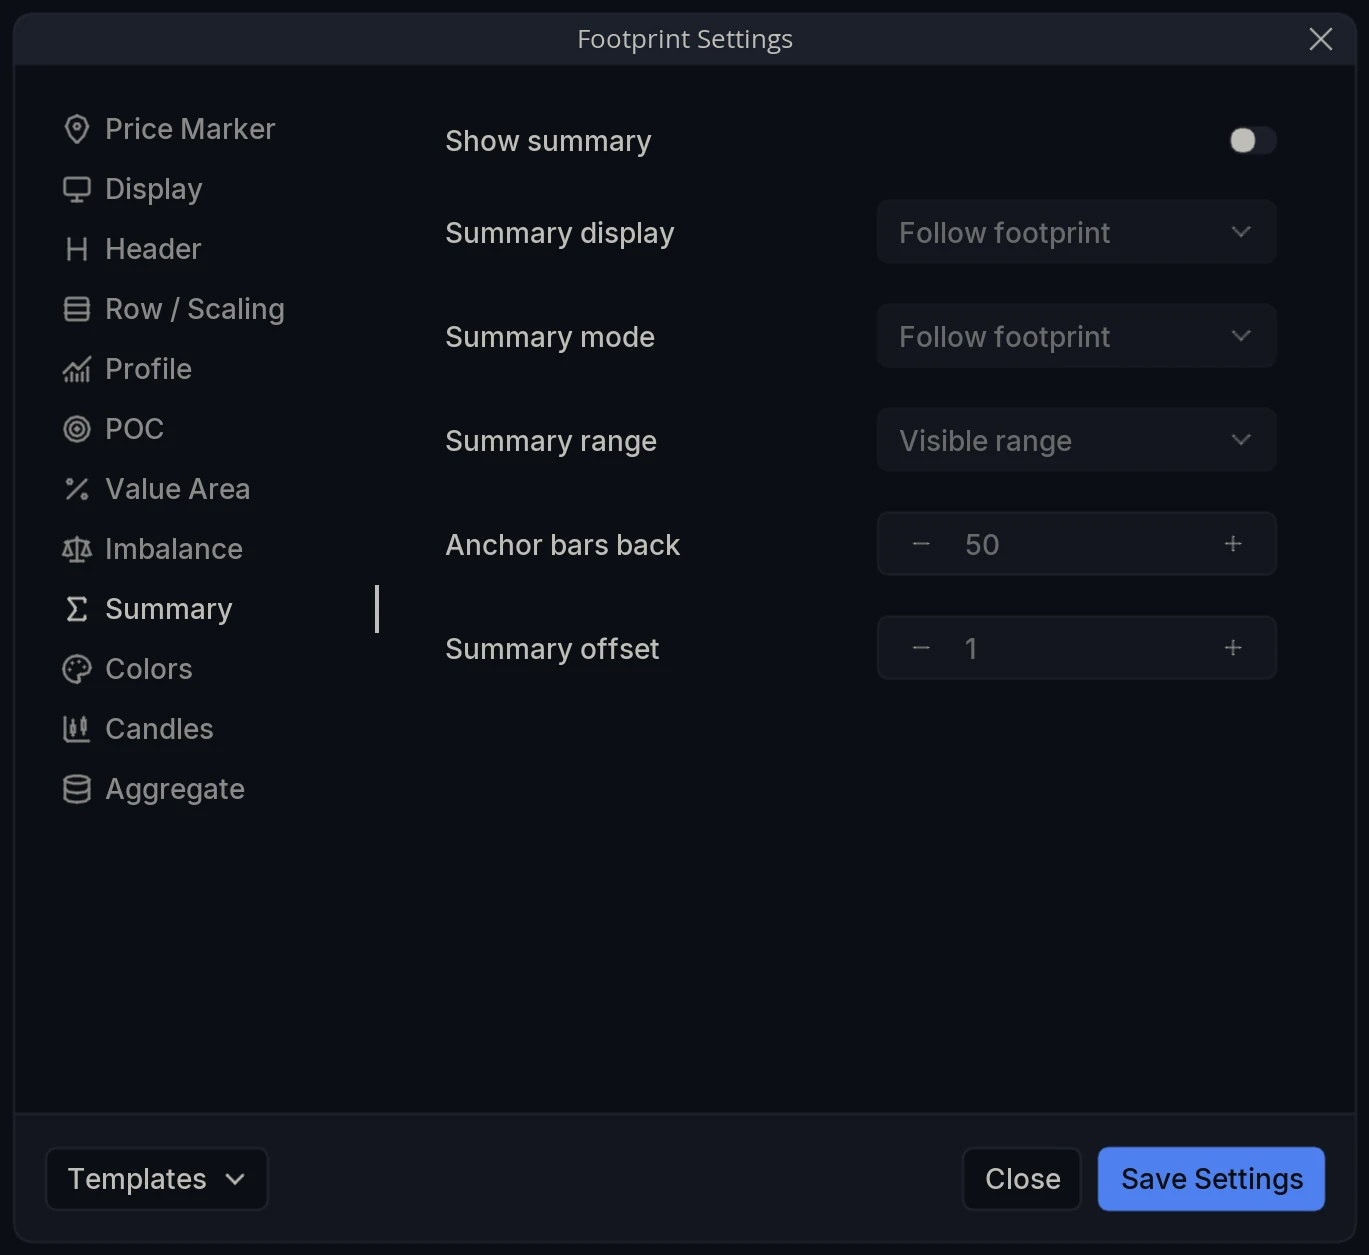
Summary range decides how much is included in it.
How do you add a side profile?
Render profile draws a profile beside each footprint. In Cluster display this adds a side profile to the cluster, so you get the even grid and the volume shape together.
Profile type sets what that profile measures: Volume or Delta.
How does the size filter work?
Size filter excludes trades below a given size from the footprint entirely, so the cells describe only the flow above that size. It is the setting to reach for when the question is what larger participants were doing rather than what everyone was doing.
Two toggles decide how the excluded volume is treated. As the tooltips in the panel put it, Skip grade filtered means filtered colors are not graded, so cells built from filtered volume keep their color but are left out of the shading scale. Hide filtered goes further: filtered footprint cells and text are not rendered, removing them from the chart altogether.
The two give you a choice between a footprint that still shows every price with the small trades de-emphasized, and one that shows only the prices where size actually traded.
How do you set the row height?
Row size offers Auto, Global or Custom, the same three choices the other row-based layers use. Ticks per row applies in Custom, and ATR length applies only in Auto, where row height is derived from volatility rather than a fixed figure.
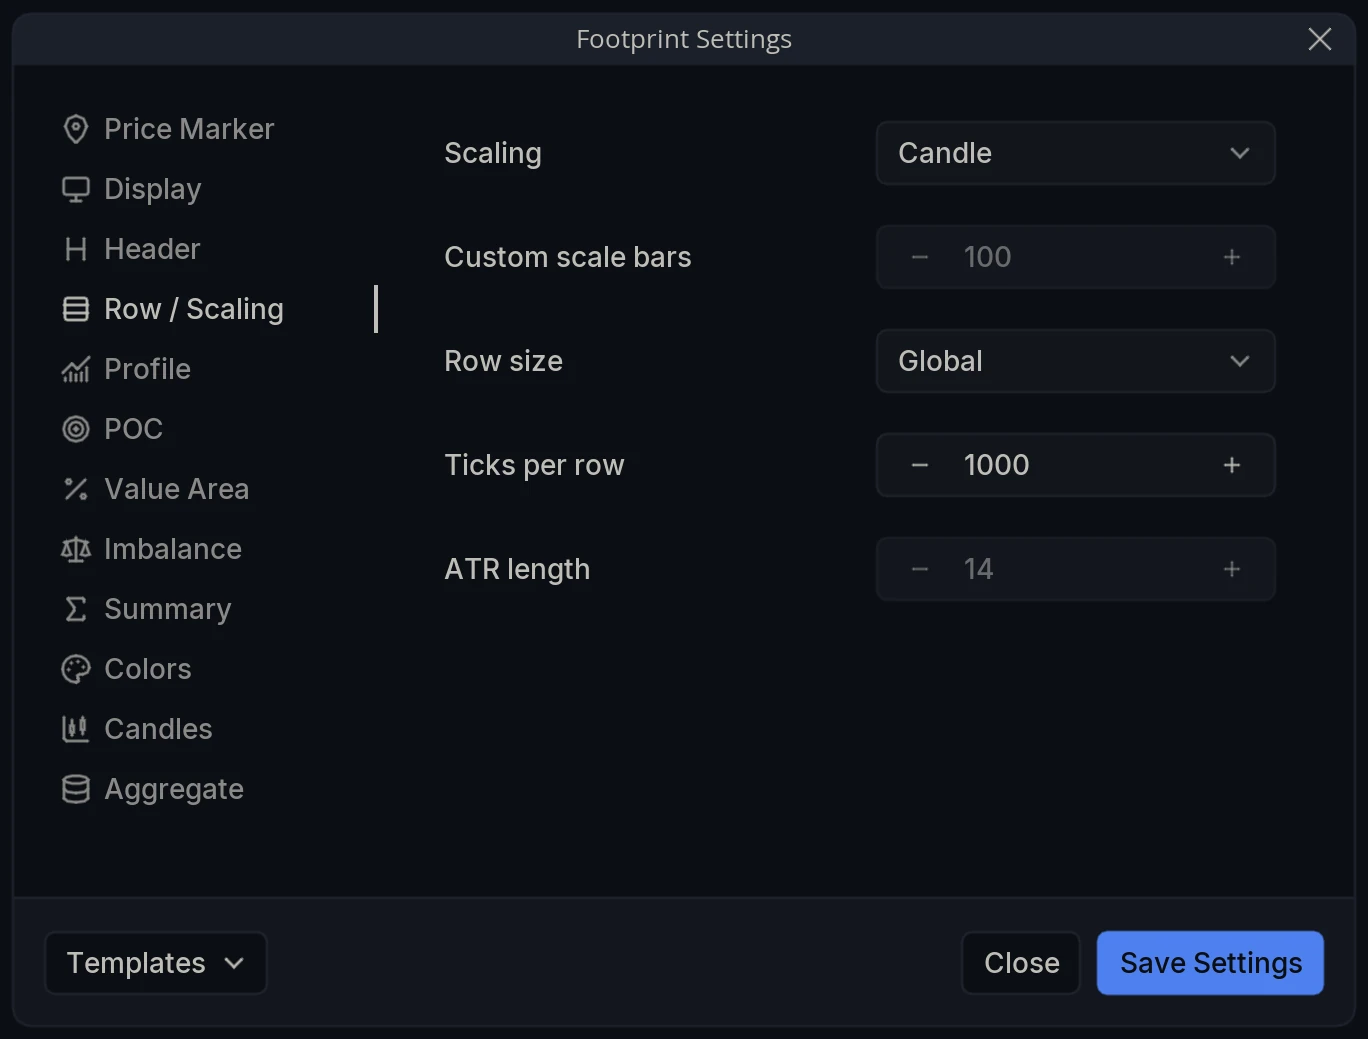
Row height matters more here than on any other layer. It decides how many rows each candle has, and therefore whether the footprint is readable at all.
Layer Settings
Open Footprint Settings via the cog wheel on the layer name. The panel has twelve tabs: Price Marker, Display, Header, Row / Scaling, Profile, POC, Value Area, Imbalance, Summary, Colors, Candles and Aggregate.
Price Marker
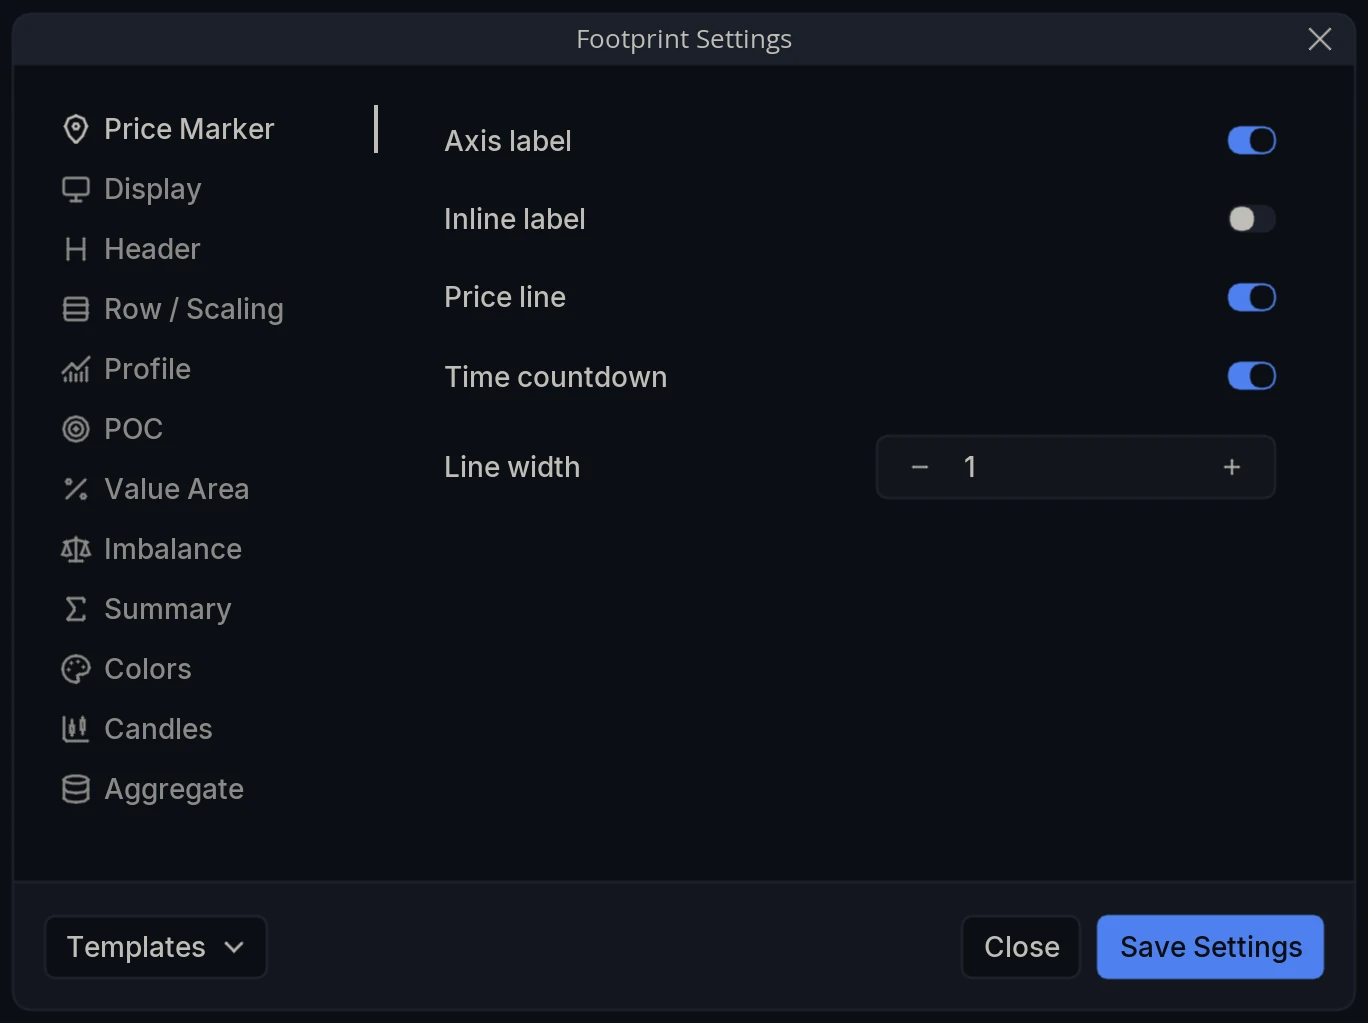
Axis label / Inline label / Price line / Time countdown / Line width - The standard price marker controls, as on every other layer.
Display
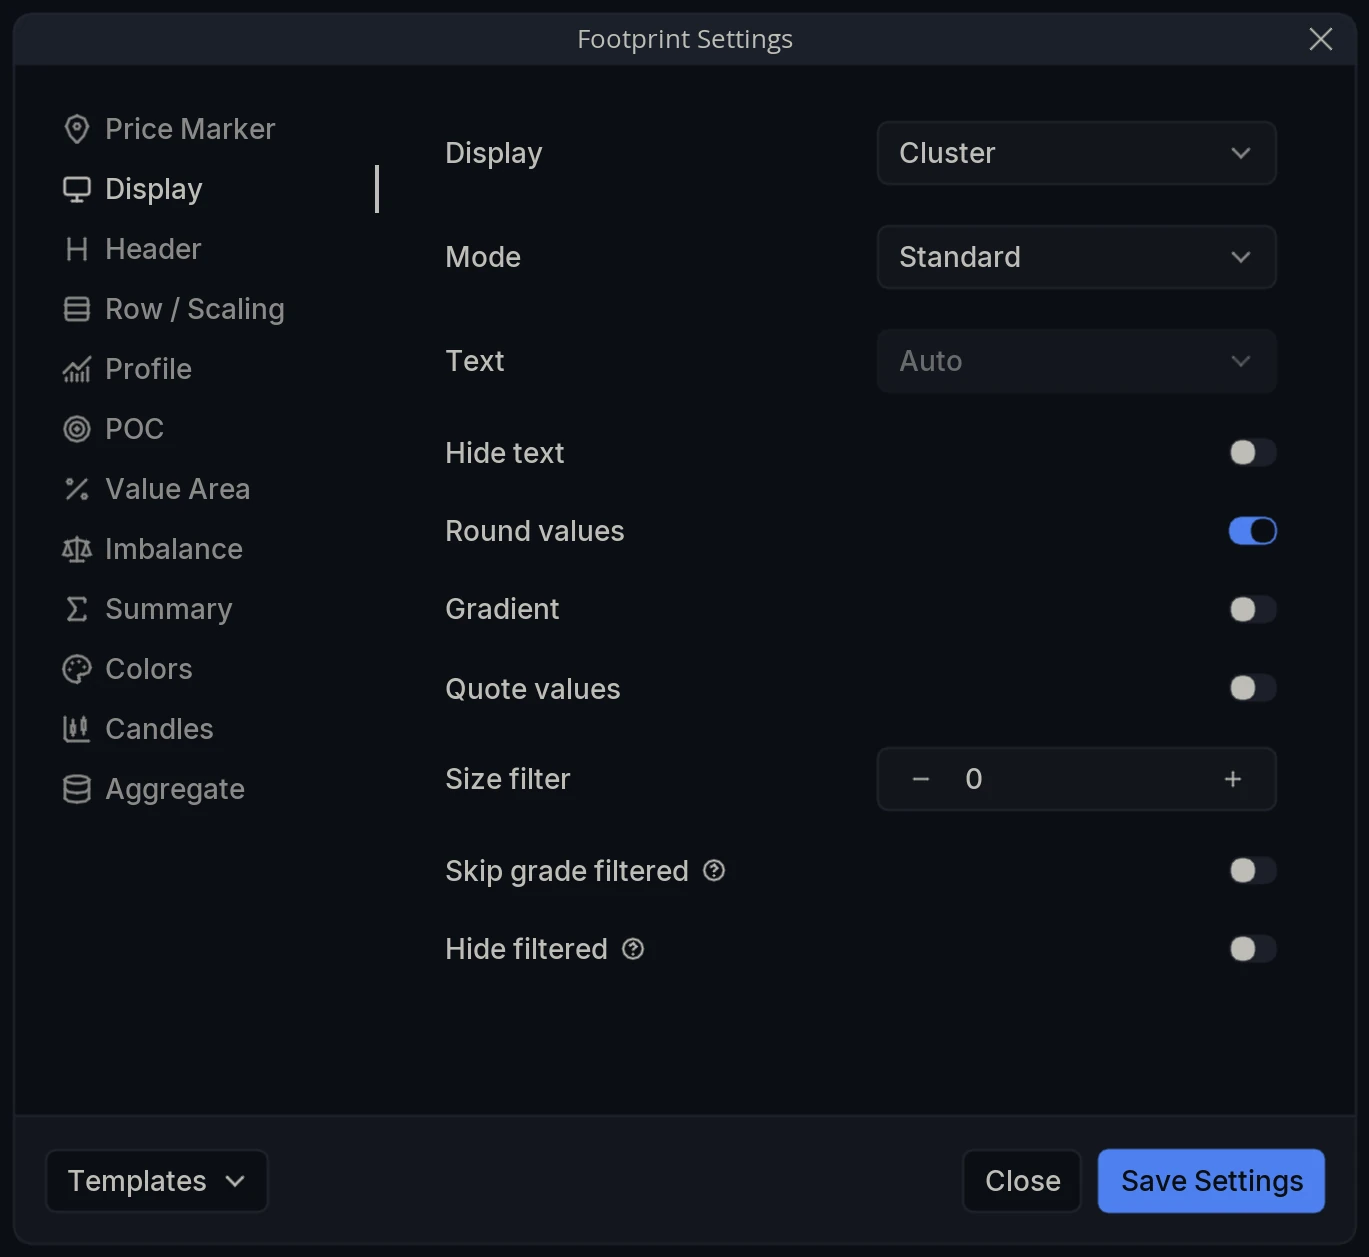
Display - The shape the footprint takes: Cluster or Profile.
Mode - What fills it: Standard, Delta or Volume.
Text - What is printed in each cell: Auto, Delta, Volume or Sell | Buy.
Hide text - Draw the footprint without figures, leaving only the coloring.
Round values - Round the printed figures.
Gradient - Shade cells by size.
Quote values - Report in the quote currency rather than the base asset.
Size filter - Exclude trades below this size from the footprint.
Skip grade filtered - Filtered colors are not graded, so excluded volume keeps its color but is left out of the shading scale.
Hide filtered - Filtered footprint cells and text are not rendered at all.
Header
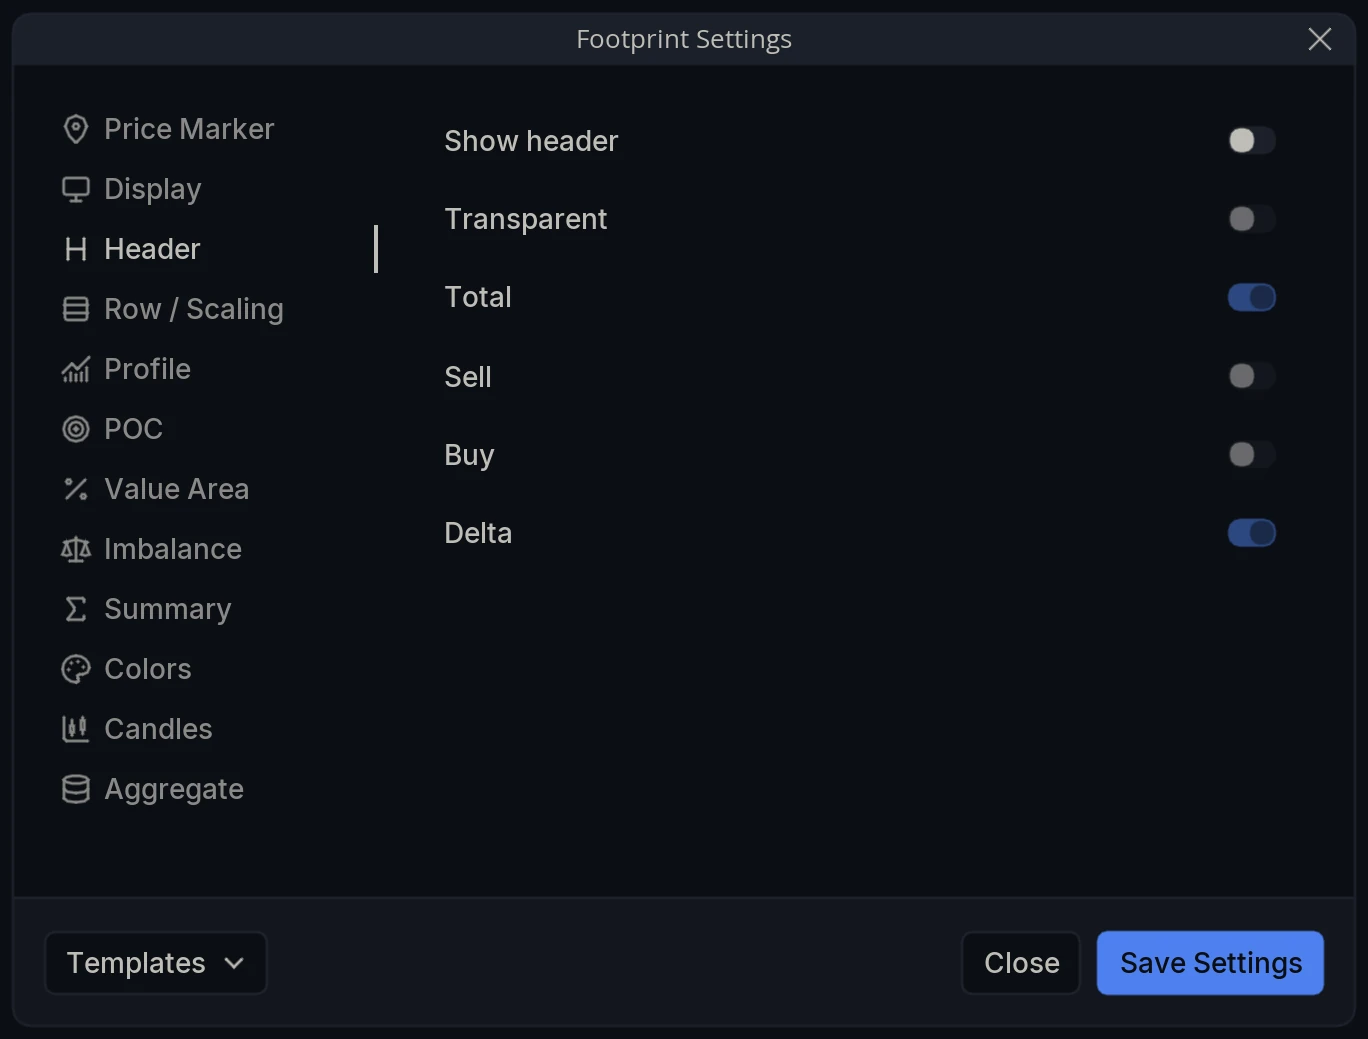
Show header - Draw a header above each footprint candle.
Transparent - Render it without a solid background.
Total / Sell / Buy / Delta - Which figures the header carries.
Row / Scaling
Scaling - The window cell shading is scaled against: Candle, Daily, Weekly, Visible range, Chart or Custom.
Custom scale bars - How many bars to scale against, active when Scaling is set to Custom.
Row size - How row height is decided: Auto, Global or Custom.
Ticks per row - Ticks each row covers, active in Custom.
ATR length - The ATR period used to derive row height, active in Auto only.
Profile
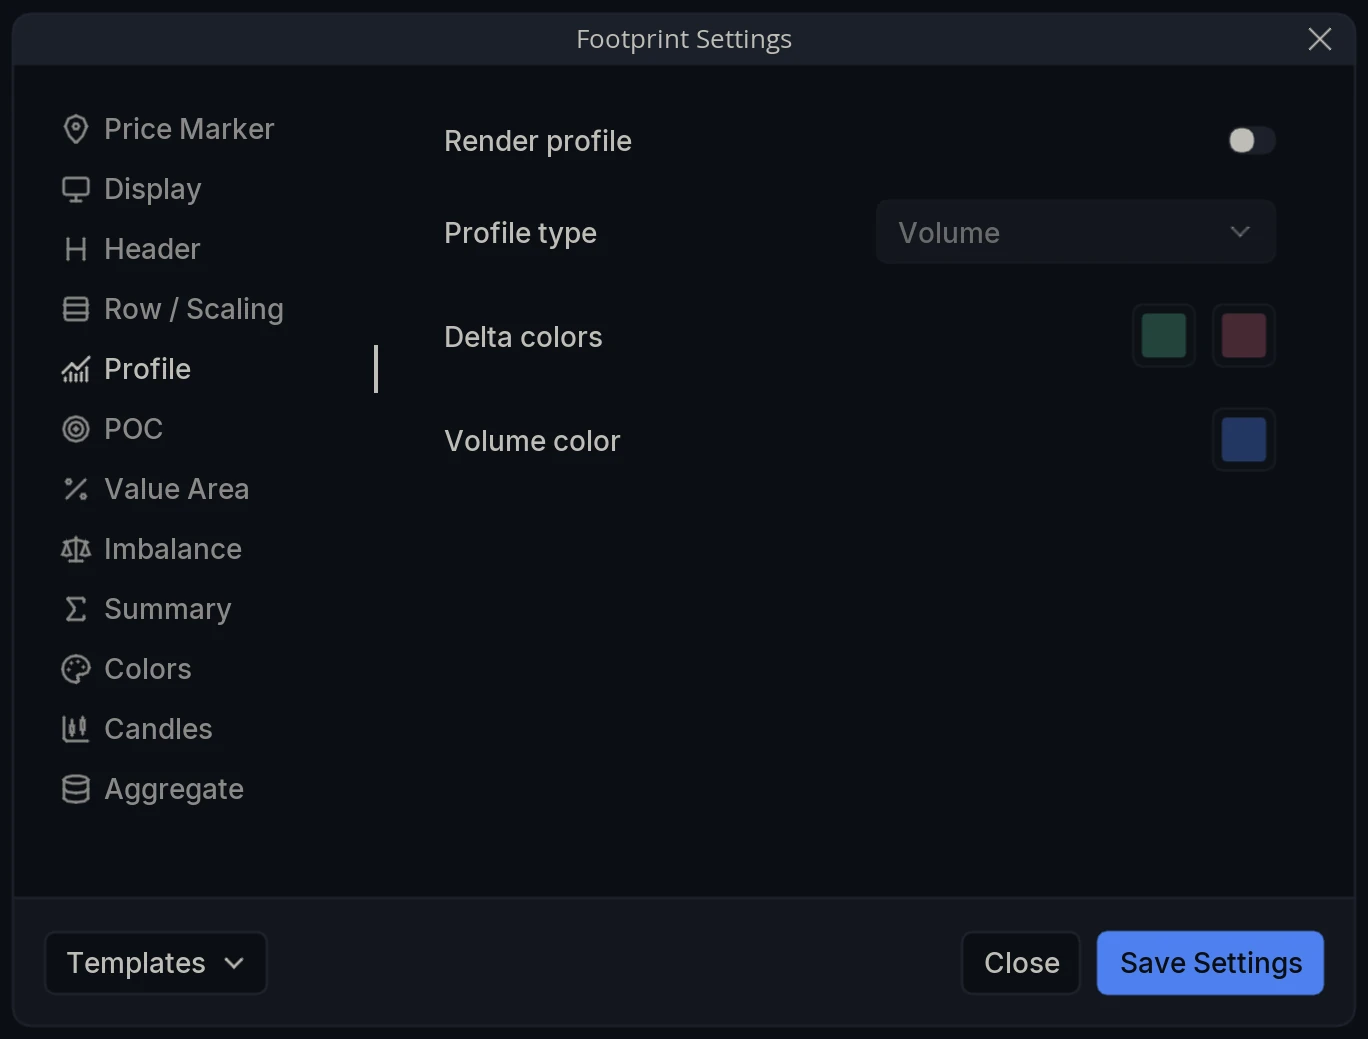
Render profile - Draw a profile beside each footprint.
Profile type - What it measures: Volume or Delta.
Delta colors - The pair used when Profile type is Delta.
Volume color - The color used when it is Volume.
POC
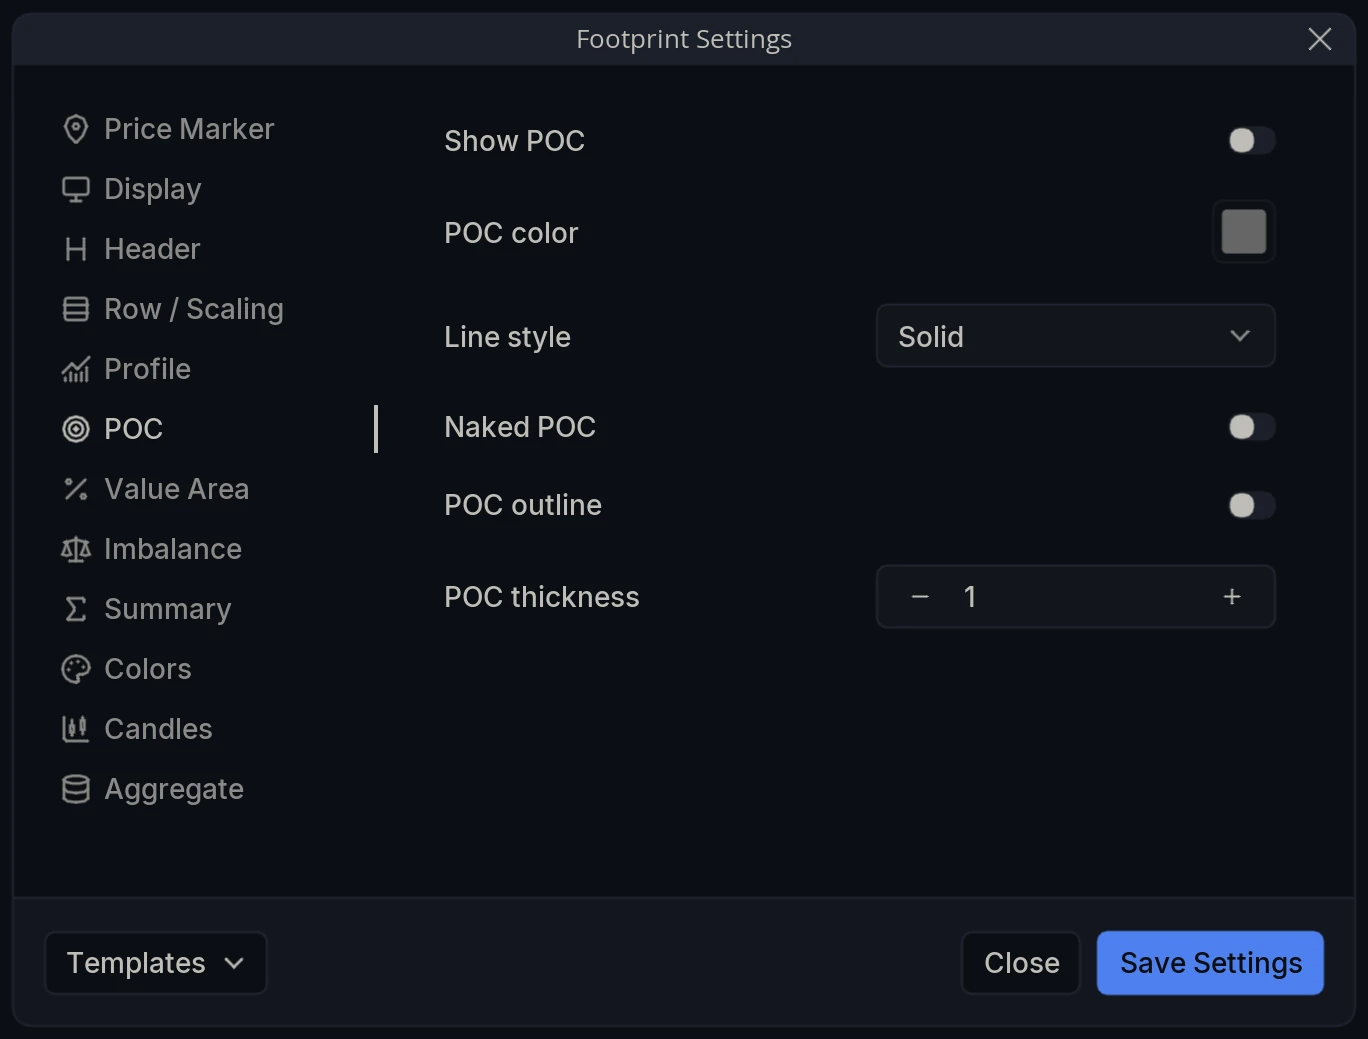
Show POC - Mark each candle’s point of control.
POC color / Line style / POC thickness - How that mark is drawn.
Naked POC - Extend an untested POC forward until price returns to it.
POC outline - Outline the POC cell rather than filling it.
Value Area
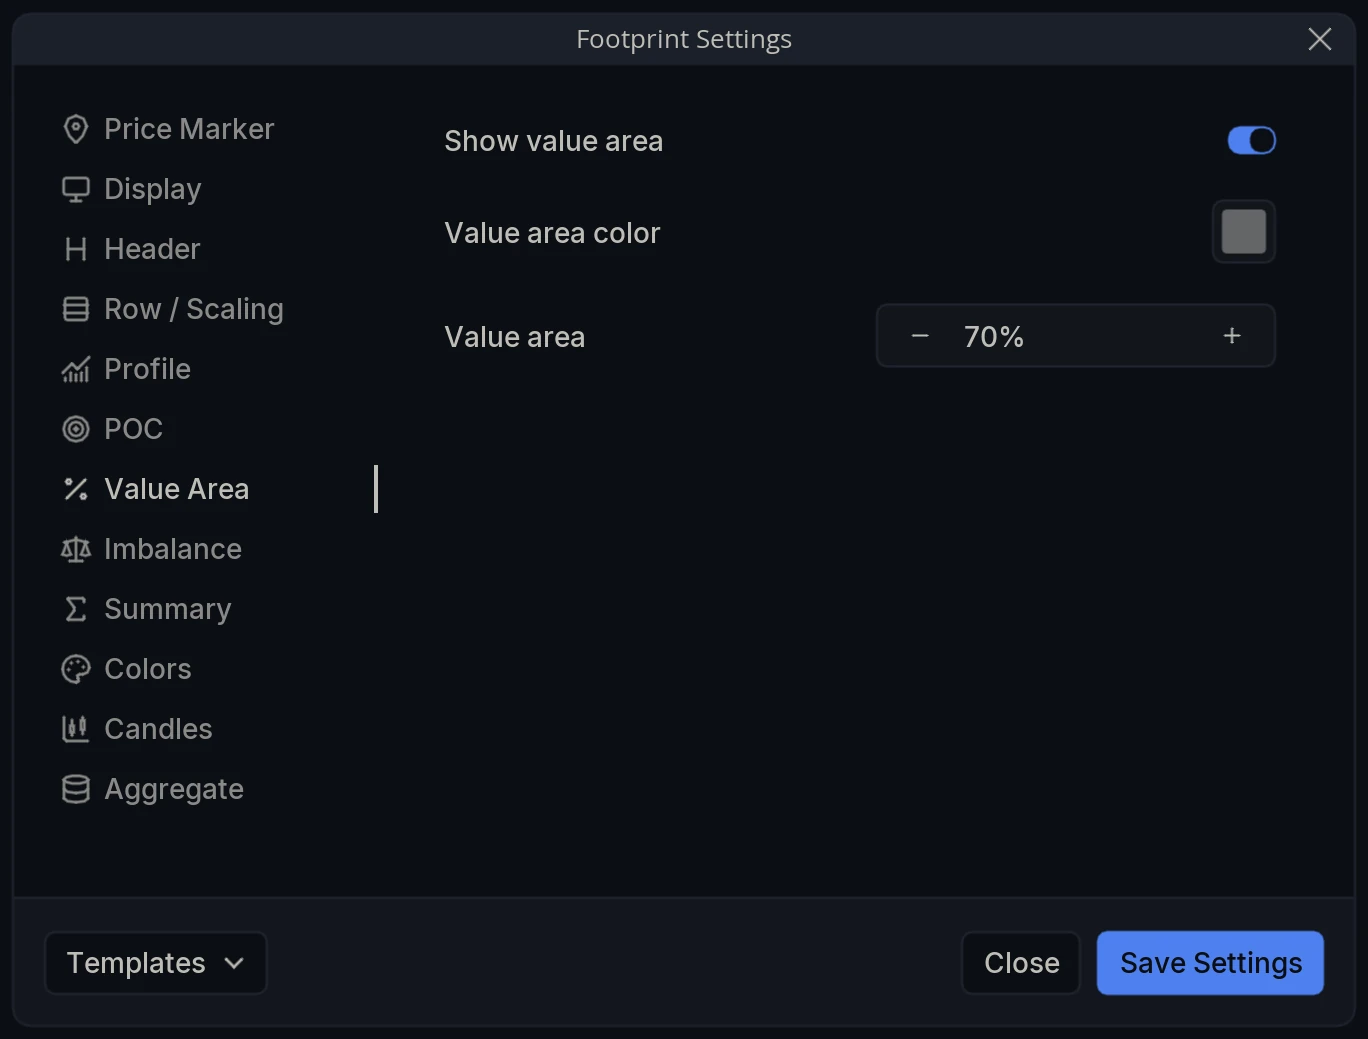
Show value area - Mark each candle’s value area.
Value area color - The color used.
Value area - The proportion of the candle’s volume it contains. 70% by default.
Imbalance
Enable imbalance - Mark imbalanced cells.
Buy / sell colors - The colors used for the two sides.
Skip zeros - Ignore rows where one side traded nothing.
Outline / Line style - Draw an outline around flagged cells, and its style.
Color text - Color the figures inside a flagged cell as well as the cell itself.
Ratio - How many times larger one side must be than its diagonal opposite. 10 by default.
Threshold - Minimum volume required before a cell can qualify. 0 by default, which applies no minimum.
Stacked imbalances - How many consecutive imbalanced rows are needed before the run is marked.
Naked extension - Carry an imbalance forward as a level until a candle reaches it.
Summary
Show summary - Draw the aggregated footprint column at the right-hand edge.
Summary display - How the summary is drawn: Follow footprint to match the main footprint, or Cluster or Profile independently of it.
Summary mode - What fills it: Follow footprint, or Standard, Delta or Volume independently.
Summary range - How much of the chart the summary aggregates.
Anchor bars back / Summary offset - Where the summary is anchored and how far it sits from the last candle.
Colors
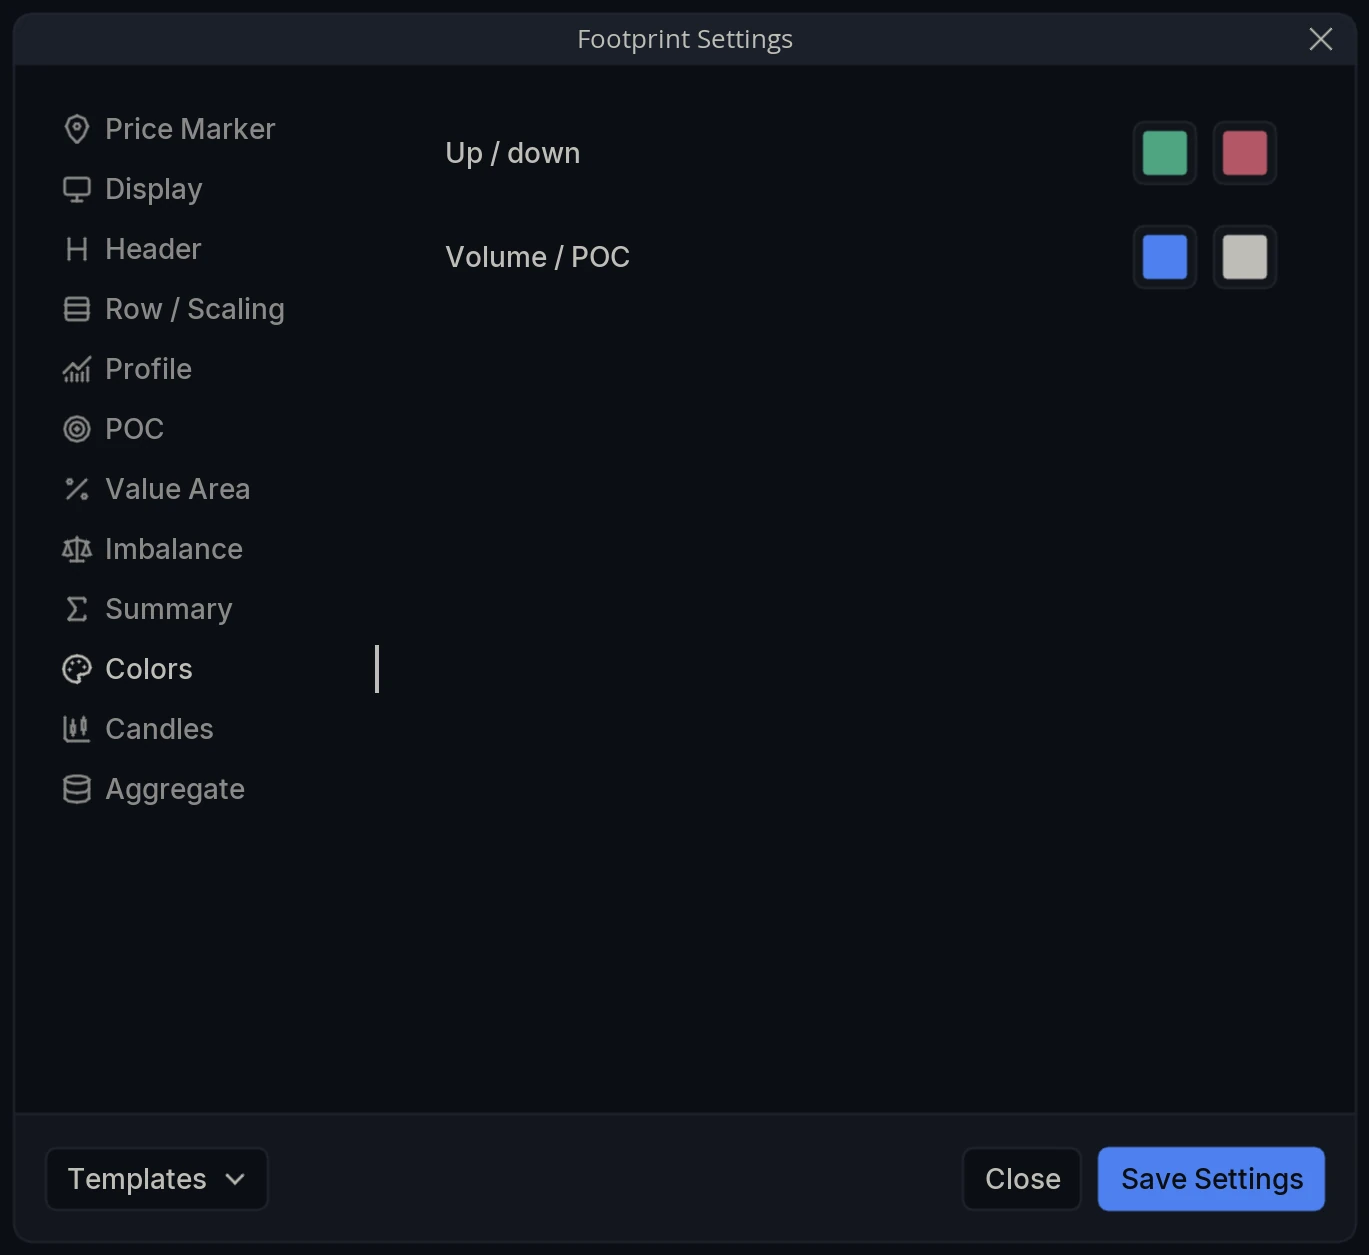
Up / down - The two colors used for the two sides.
Volume / POC - The colors used for volume cells and for the point of control.
Candles
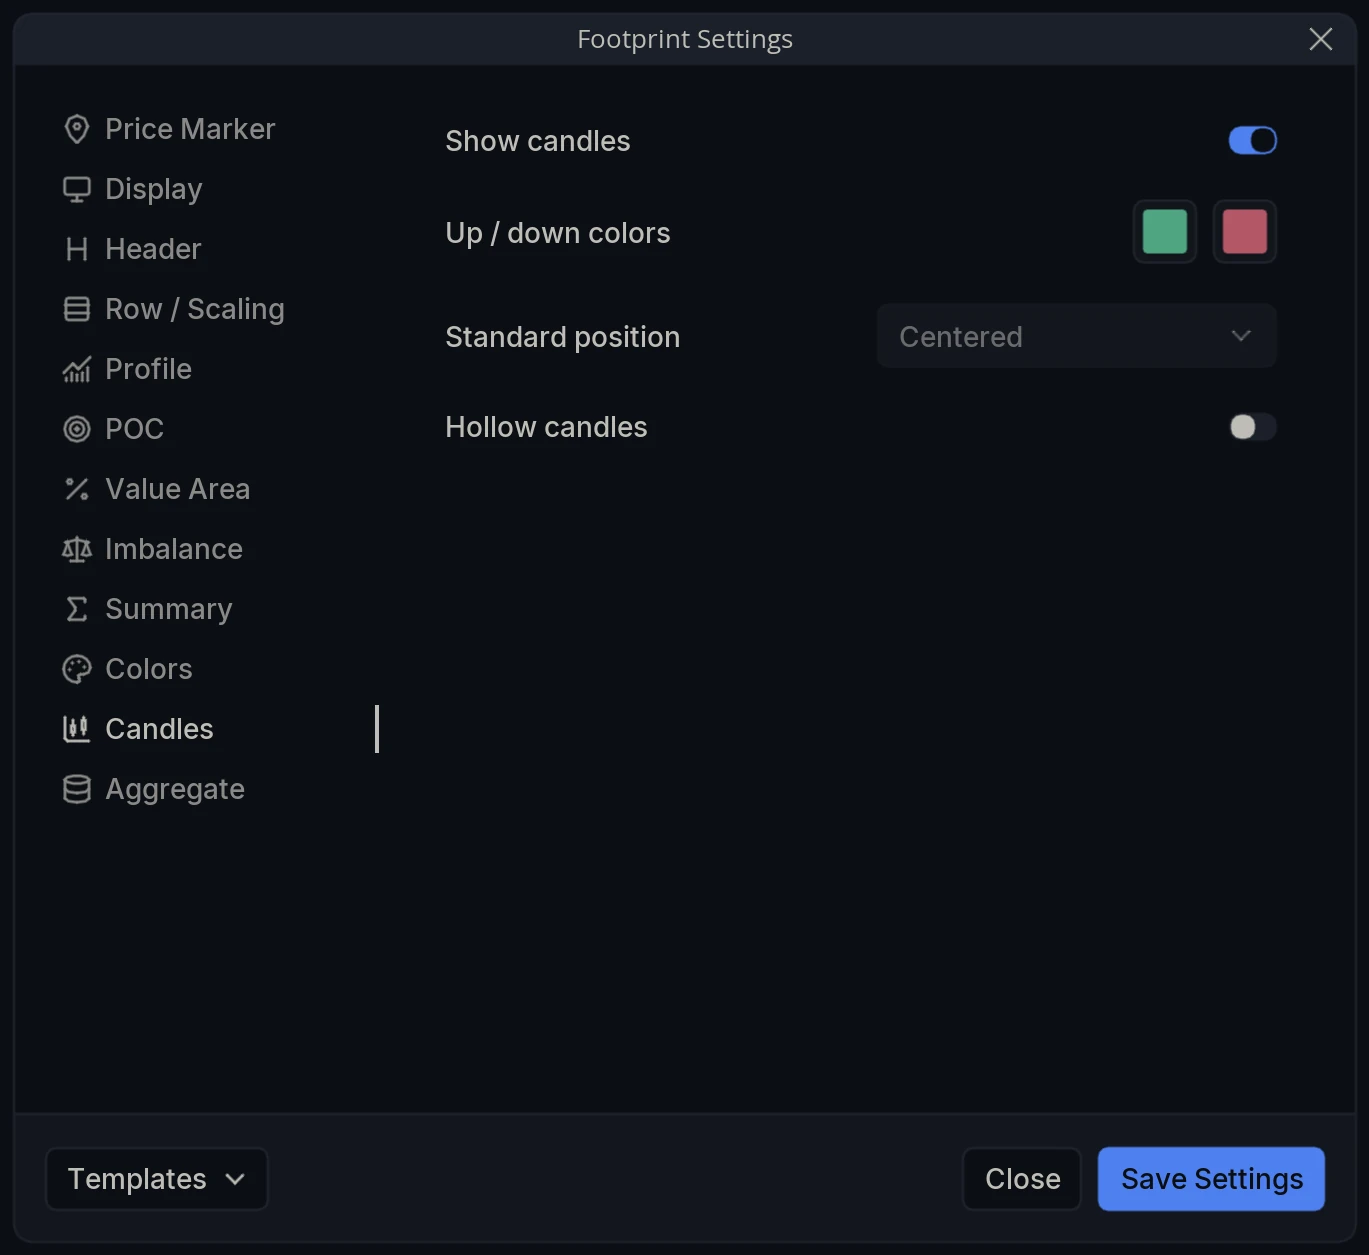
Show candles - Draw the OHLC candle alongside the footprint.
Up / down colors - Colors for those candles.
Standard position - Where the candle sits relative to the footprint: Centered, or Left to place the candle to the left of the cluster or profile.
Hollow candles - Draw the candles unfilled.
Aggregate
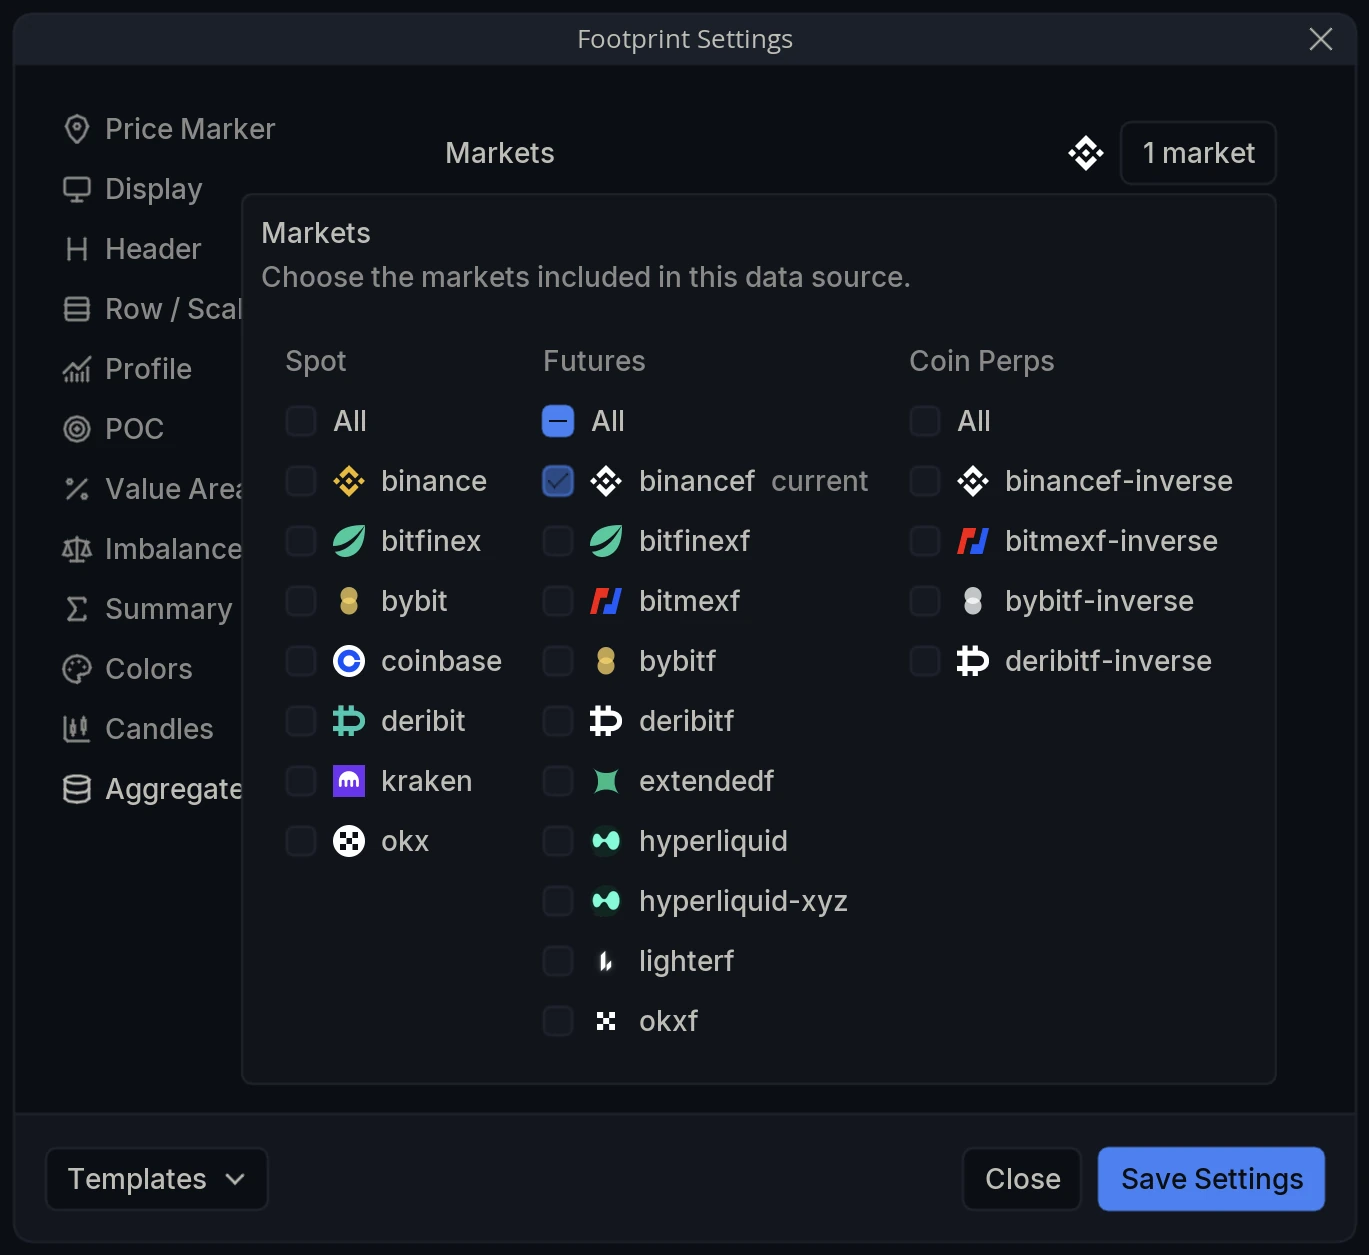
Markets - Choose the markets included. The selector is grouped into Spot, Futures and Coin Perps, with an All toggle per group; your chart’s own market is tagged current.