What is order book depth and imbalance?
By MichaelUpdated August 25, 2026
Order book depth is the quantity of limit orders resting at each price around the market. Imbalance is the difference between the two sides: how much is bid against how much is offered. A depth imbalance indicator tracks that difference over time, showing which side of the book is carrying more size.
How does order book depth work?
An order book holds every unfilled limit order for a market. Bids sit below the current price from buyers willing to pay less, asks sit above it from sellers willing to accept more, and the gap between the best of each is the spread.
Depth is the total size waiting at those prices. It is passive rather than aggressive: nobody resting an order is moving the market, they are stating what they will do if price comes to them. That makes depth a measure of intent rather than of activity, which is what separates it from volume.
Imbalance is what you get by comparing the two sides. Add up the bids within a chosen distance of price, add up the asks within the same distance, and the difference tells you which side is heavier. More bid depth than ask depth means buyers have more standing interest below the market than sellers have above it. Because a book changes continuously, that comparison is far more useful tracked over time than read once.
How do you read an order book imbalance?
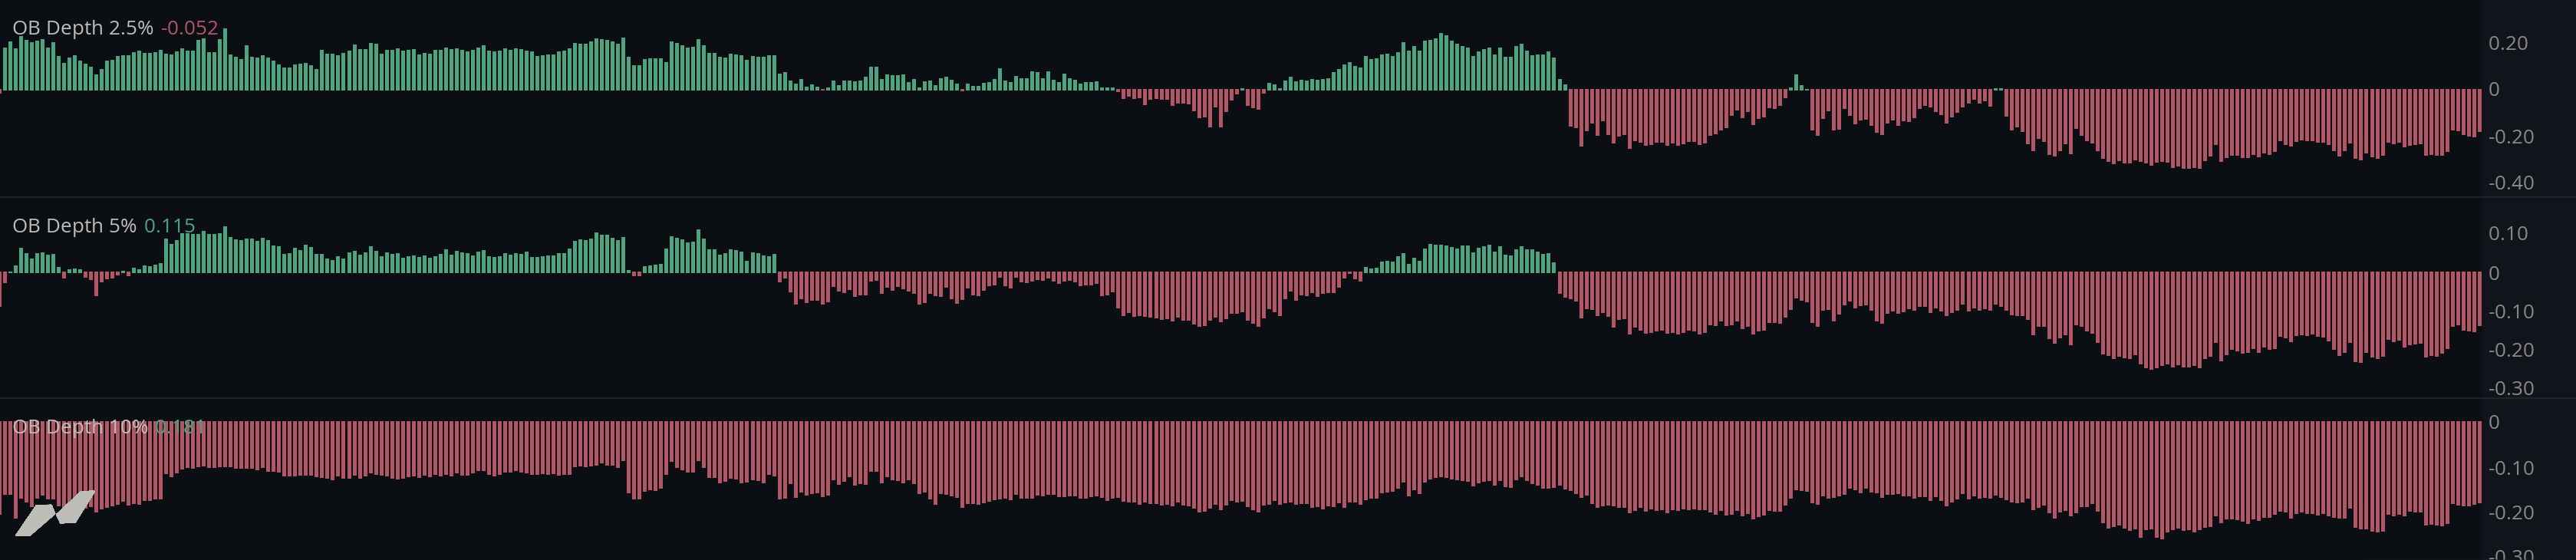
The plot is a histogram drawn around a zero baseline. Bars above zero mean bid depth exceeds ask depth: more size is waiting to buy than to sell. Bars below zero mean the reverse. The further a bar sits from the baseline, the more lopsided the book is at that moment.
Read the shape rather than the individual bar. A single reading is a snapshot of a book that can change in a second. A sustained stretch above the baseline is the useful observation: the buy side has been consistently heavier for a period of time, not for an instant.
The strongest reading is the turn. A histogram that has been negative for hours and flips positive marks a genuine change in where standing interest sits, and that shift often happens before price responds to it, because the orders have to be there before they can be filled.
The other reading worth taking is disagreement with price. A market grinding lower while depth imbalance stays firmly positive is falling into accumulating bids, which is a different situation from a market falling with the book emptying out beneath it.
Why does the price depth matter?
Depth only means something in relation to a distance from price. Every book contains orders that will never realistically be reached, and counting them tells you nothing.
A tight band, a fraction of a percent either side, describes the immediate book: the orders that stand a real chance of being filled in the next few minutes. It is responsive and it reacts quickly, but it is also the part of the book that is easiest to place and pull, so it is noisier.
A wide band of several percent describes positioning rather than immediate intent. Orders that far away are not there for the next tick, they are there for a move, and they are less likely to be pulled the moment the market twitches. The trade-off is that the reading is slower and will not tell you much about what happens next.
Neither is the correct setting. They answer different questions, and the useful habit is to know which one you are asking.
What are the limits of order book depth?
Resting orders are not promises. A limit order can be canceled at any moment, and plenty are. Depth describes what is currently stated, not what will actually happen if price arrives.
Spoofing exists. Size placed with no intention of being filled, purely to influence how the book looks, is illegal in regulated markets and common in unregulated ones. A large wall that disappears as price approaches it was never really there.
It is venue-specific. Each exchange publishes only its own book. Depth on one venue can look nothing like depth on another for the same asset, which is why aggregating across exchanges gives a far steadier reading than any single feed.
It says nothing about who executed. Depth is the passive side of the market. To see the aggressive side, which orders actually crossed the spread, you need CVD or volume. The two together are far more informative than either alone.
How is depth imbalance different from a heatmap?
Both are built from the same order book data and they answer different questions.
An order book heatmap shows depth against price: where in the book size is stacked, level by level, so individual walls and the areas price has to chew through are visible. It is the tool for finding a specific level.
A depth imbalance histogram collapses that detail into one figure per candle and shows it against time. You lose the level detail and gain a clean history of which side has been heavier, which is what makes trends and turns in positioning easy to see.
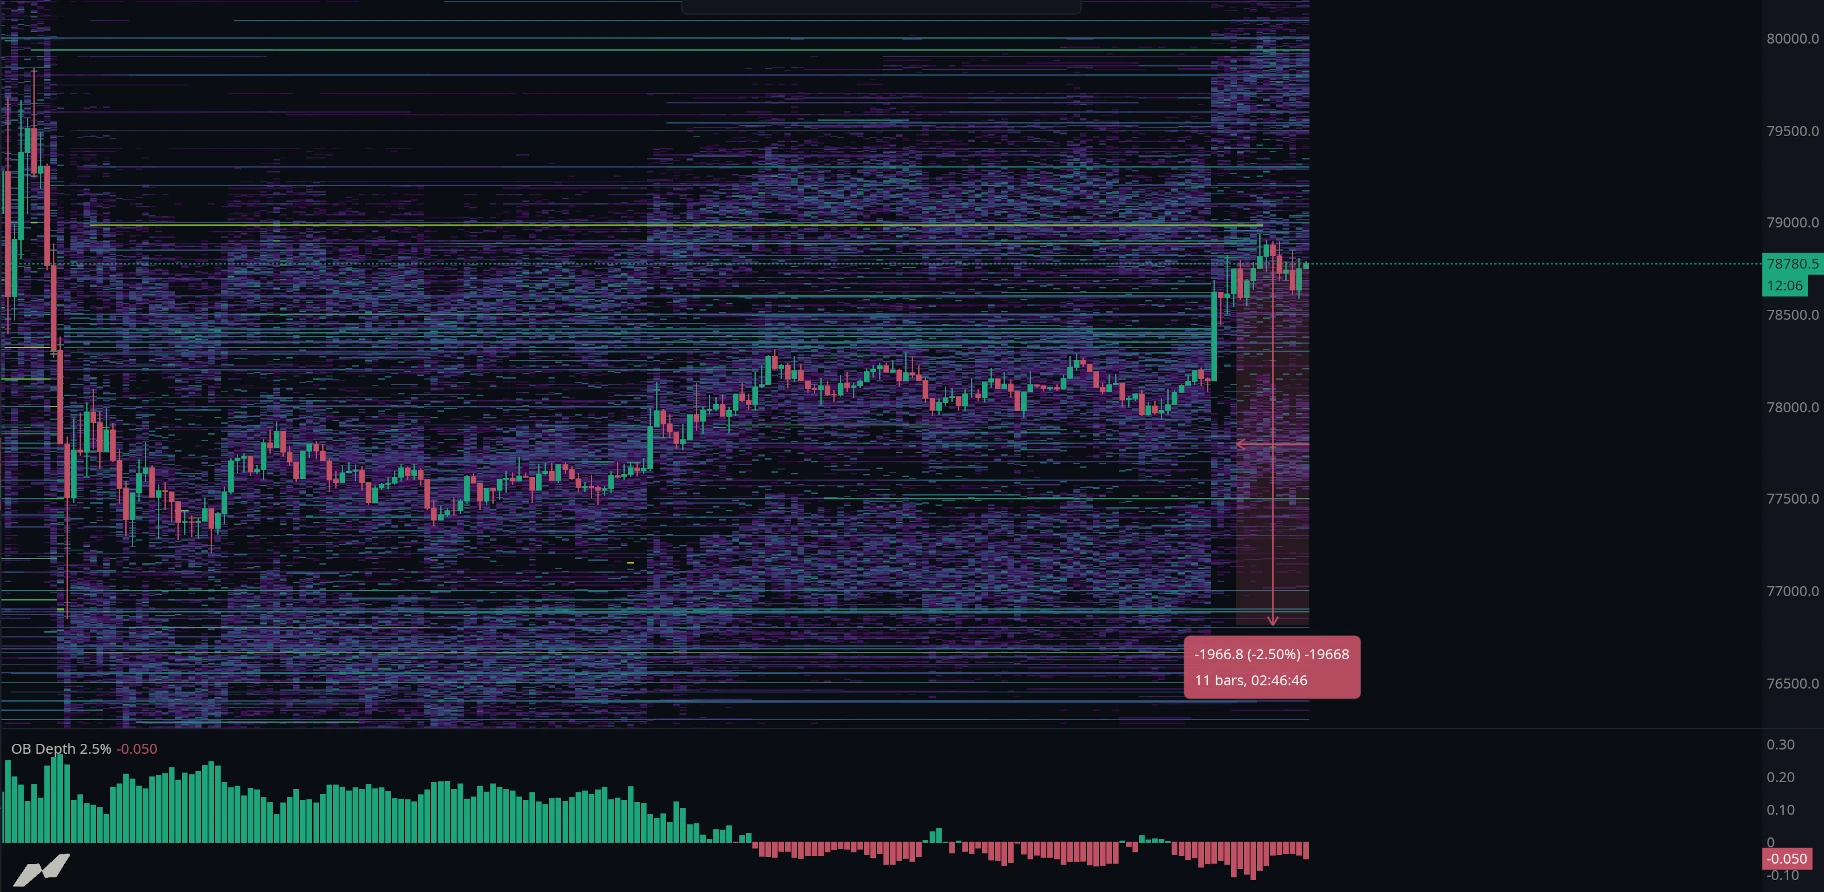
Used together, the histogram tells you the balance has shifted and the heatmap tells you where.
Related: Order book heatmap · OB Profile · CVD (Cumulative Volume Delta) · Volume
When should you use order book depth?
Depth imbalance is context, not a trigger. It is at its most useful when you already have a level or an idea and want to know whether the passive side of the market supports it.
It suits judging whether a move has standing interest behind it, watching for shifts in positioning ahead of a price reaction, and confirming an area you have marked from another tool. It also works well as a filter: a long into rising price with depth imbalance falling away is a weaker proposition than the same long with the bid side building.
It is least useful in fast, thin conditions, where the book is being placed and pulled quickly enough that the reading changes faster than you can act on it.
Using OB Depth in MMT
MMT’s OB Depth layer measures resting bid depth against resting ask depth within a chosen distance of price, and plots the difference as a histogram in its own panel below the price chart. Readings are stored per candle, so the panel builds a history you can scroll back through rather than describing only the book as it stands now. Depth can be pooled across exchanges from the Aggregate tab.
How do you add OB Depth to a chart?
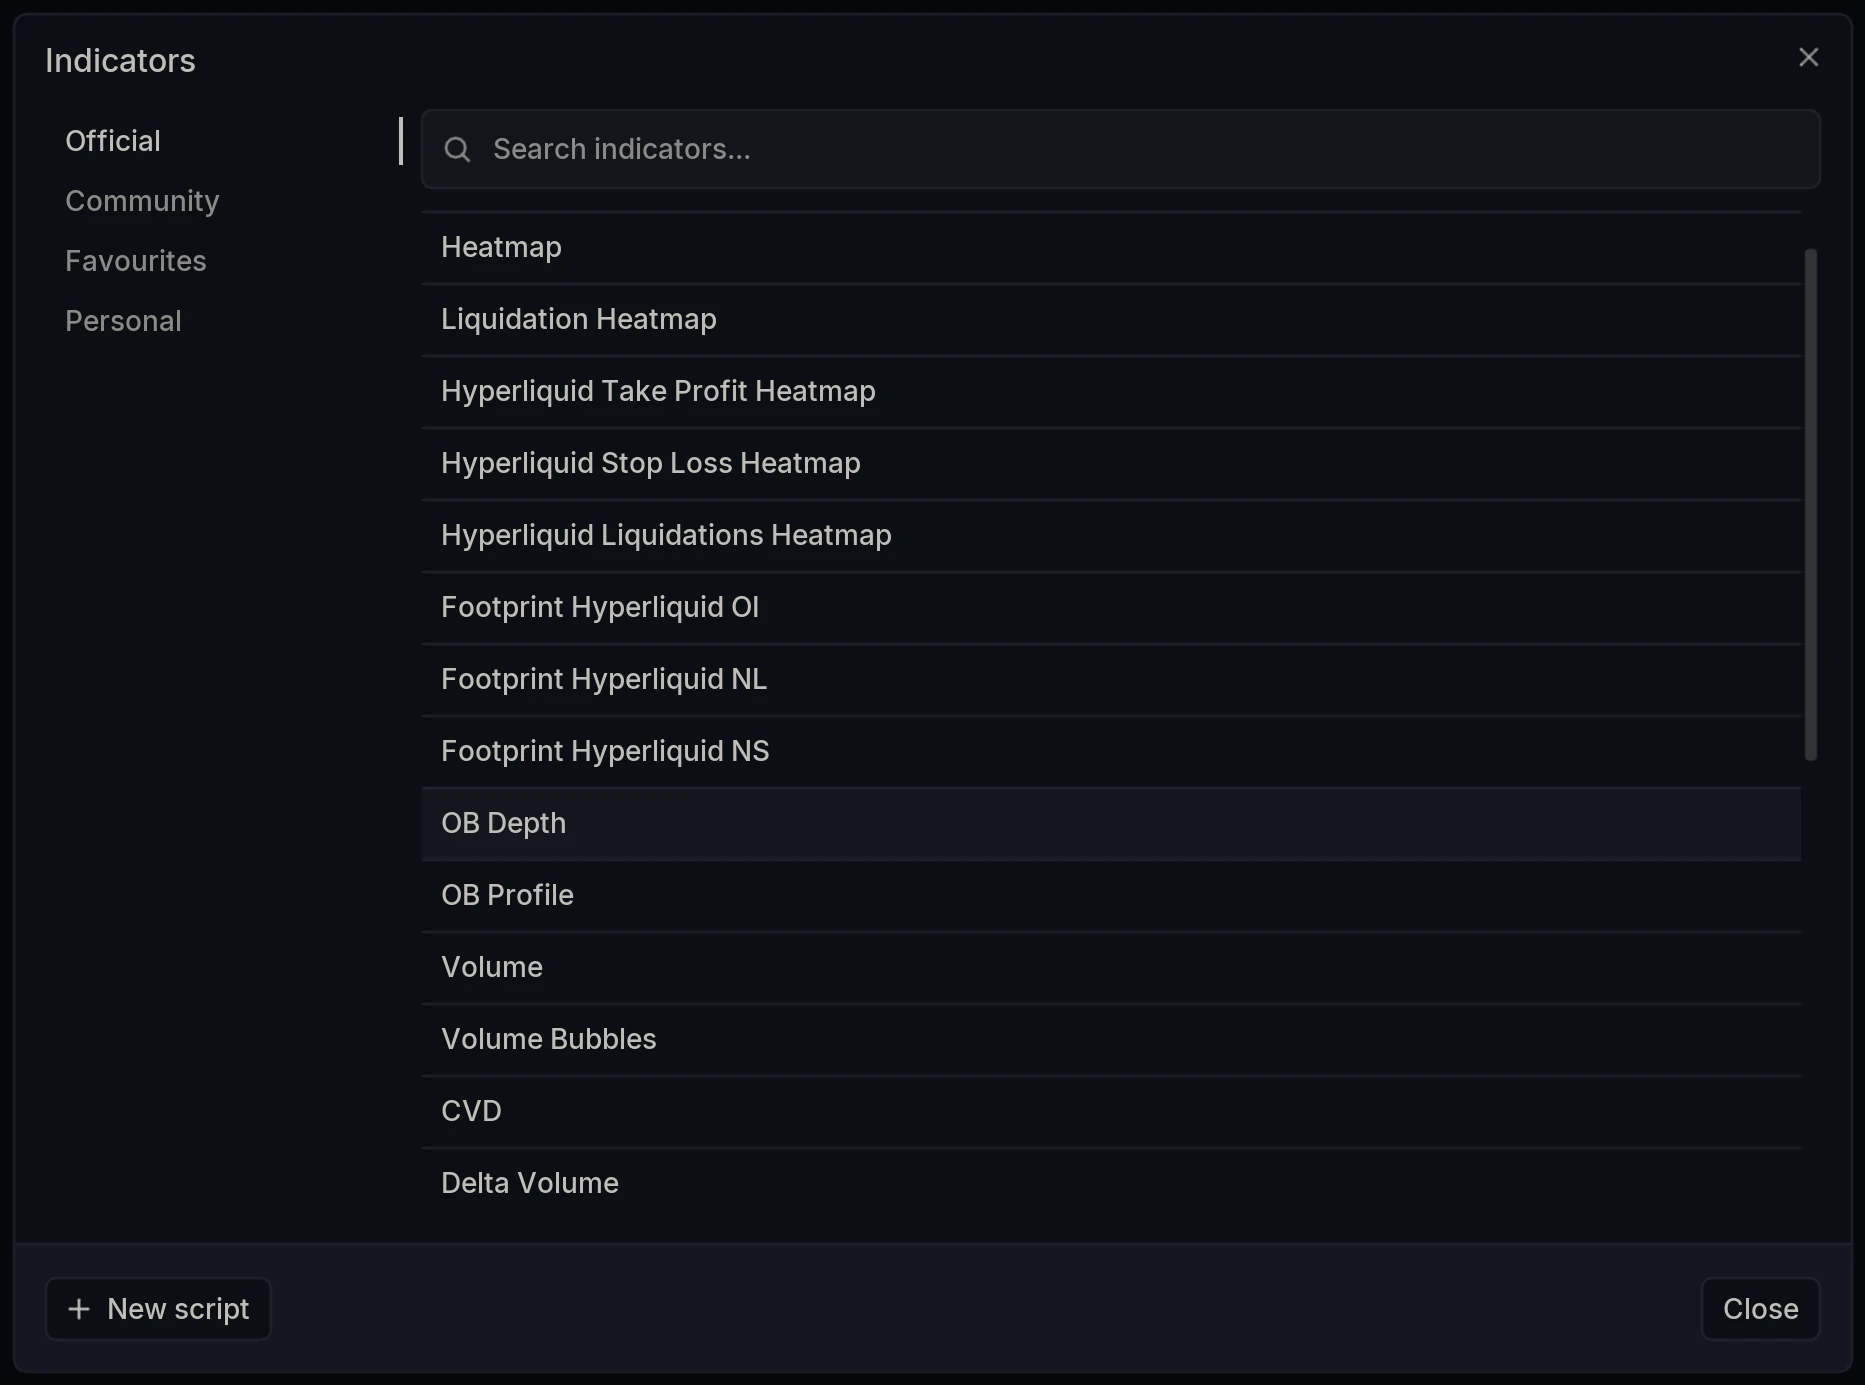
Open the Indicators dialog and select OB Depth under Official.
What does the Percentile setting do?
Percentile sets how far either side of the current price the layer counts resting orders, symmetrically on both sides. At 0.1% only the orders closest to the market are included; at 10% the calculation reaches deep into the book on both sides.
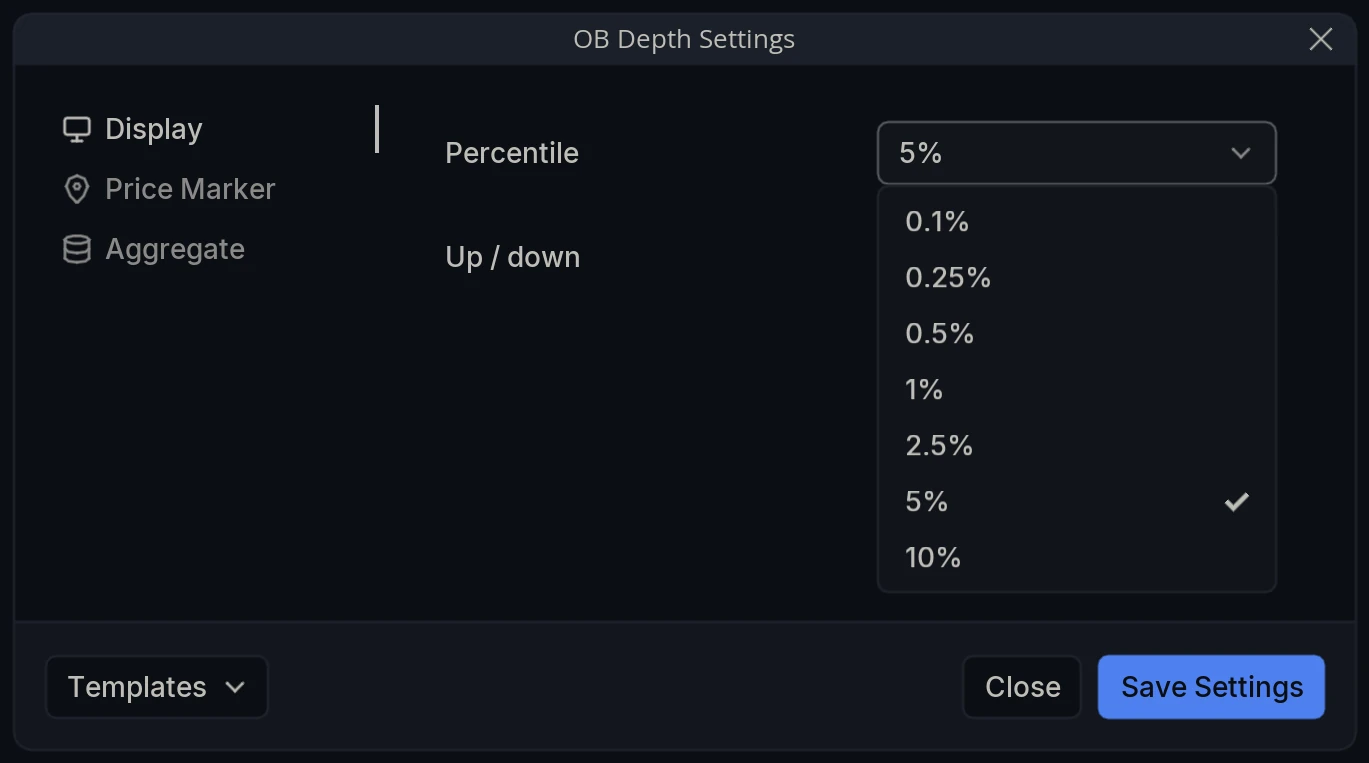
The layer name on the chart carries the setting, so a panel reading OB Depth 5% is counting everything within 5% of price. The default is 5%, which is wide enough to describe positioning rather than the churn at the top of the book.
How does OB Depth relate to OB Profile?
OB Depth answers when: which side of the book has been heavier, tracked over time in a panel below price. OB Profile answers where: it draws resting depth against price on the right-hand side of the chart, next to the heatmap, so the heavy areas of the book stand out level by level.
Layer Settings
Open OB Depth Settings via the cog wheel on the layer name. The panel has three tabs: Display, Price Marker and Aggregate.
Display
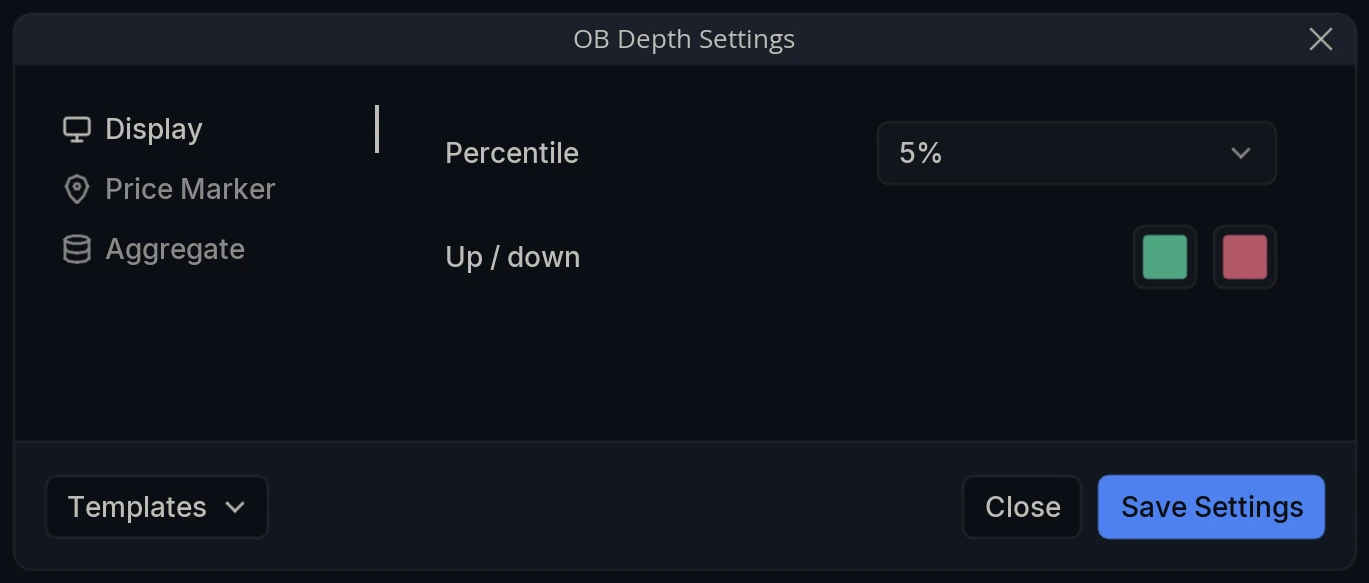
Percentile - How far either side of price resting orders are counted: 0.1%, 0.25%, 0.5%, 1%, 2.5%, 5% or 10%. 5% by default.
Up / down - The two colors used for the two sides. The up color marks readings where bid depth exceeds ask depth; the down color marks readings where ask depth exceeds bid depth.
Price Marker
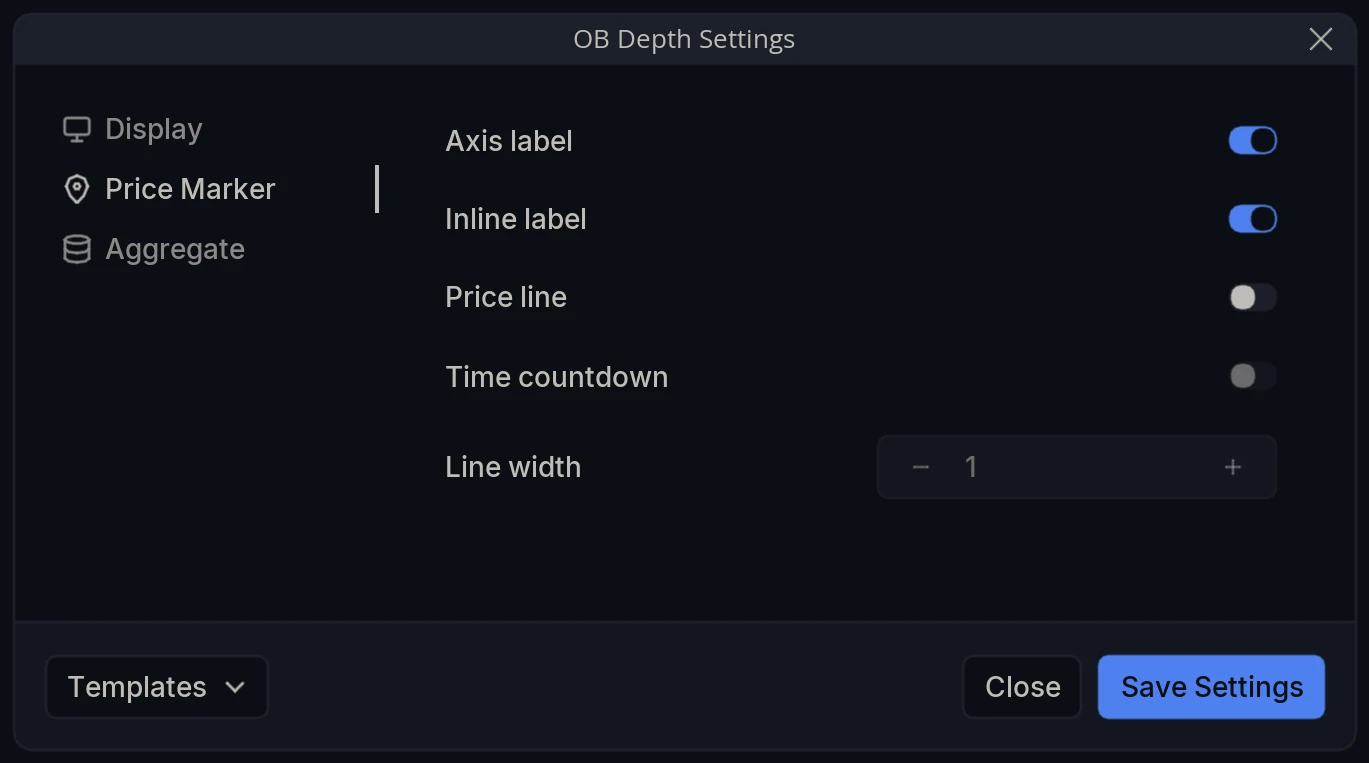
Axis label - Show the current value as a label on the panel’s axis.
Inline label - Show that value on the panel itself rather than on the axis.
Price line - Draw a horizontal line across the panel at the current value.
Time countdown - Show the time remaining until the current candle closes.
Line width - Thickness of that line.
Aggregate
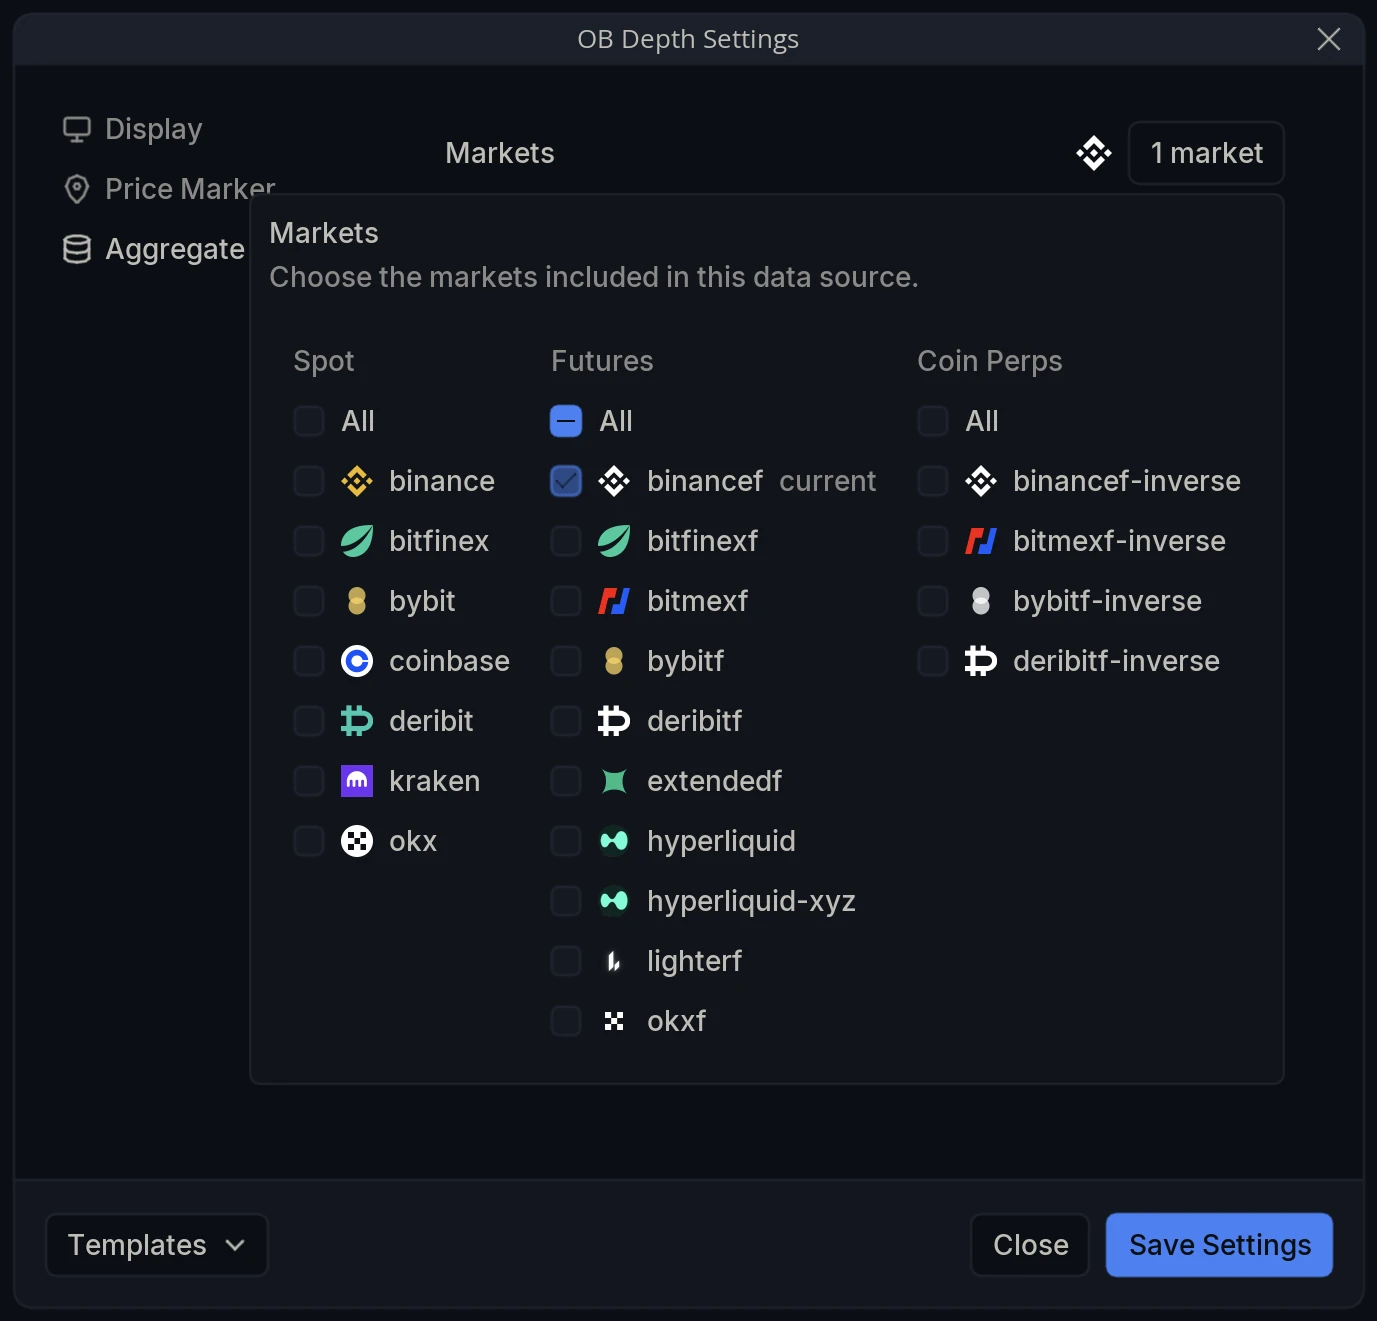
Markets - Choose the markets whose books are included. The selector is grouped into Spot, Futures and Coin Perps, with an All toggle per group; your chart’s own market is tagged current.
Aggregating is worth doing here. A single venue’s book can be lopsided simply because the size is sitting elsewhere, so pooling exchanges gives a much better answer to the question of where standing interest actually is.