What is net positioning?
By MichaelUpdated August 25, 2026
Net positioning tracks how much of a market's trading actually created or closed positions rather than passing existing ones between traders. It separates new longs and new shorts from position transfer, producing two running series that show which side has been building exposure and which has been unwinding it.
How does net positioning work?
Volume cannot tell you whether a position was created. Neither can volume delta on its own. A bar can trade heavily with buyers doing all the chasing and still leave the market with exactly as many open positions as it started with, because every one of those buys was matched against someone closing rather than someone opening.
Open interest knows the difference. It counts contracts outstanding, so it rises only when a position is created and falls only when one is closed. What it cannot tell you is direction: it counts contracts, and every contract is somebody’s long and somebody else’s short.
Net positioning combines the two. Each bar, the aggressive flow says which side was doing the taking and the change in open interest says whether positions were created or destroyed. Read together they identify what actually happened:
| Open interest | Aggressive flow | What happened | How the bar is drawn |
|---|---|---|---|
| Rising | Buy side | New longs opening | Long color, solid |
| Rising | Sell side | New shorts opening | Short color, solid |
| Falling | Sell side | Longs closing | Long color, faded |
| Falling | Buy side | Shorts closing or covering | Short color, faded |
Those four cases collapse into two things you can see at once. The color says which side the bar belongs to, and the fill says whether the position was opened or closed: opening bars are drawn solid, closing bars in the same color but faded back. A run of solid long bars is longs being built; the same color faded is longs being unwound.
That is worth getting used to, because it removes a step. Without it you would have to read the direction of the series to work out whether a bar added exposure or removed it. With it, opening and closing look different at a glance, and a market where fresh positions are going on looks nothing like one where old positions are coming off.
The discipline behind all four is that only the part of a bar’s flow that open interest confirms is counted. Trade heavily while open interest barely moves and most of that trading was positions changing hands, so it contributes nothing. If open interest does not move at all, the bar records no positioning change whatever its volume.
That filter is the whole value of the measurement. It throws away the churn and keeps only the trading that changed how much exposure exists, which is a far smaller and far more meaningful number than the volume figure it came from.
How do you spot new longs and new shorts?
The two series accumulate those per-bar changes, so their direction is the reading.
Longs building is the long series climbing: open interest rising on buy-side aggression, bar after bar. Fresh money taking the long side. Longs unwinding is the same series falling, as those positions are closed out.
Shorts building is the short series extending: open interest rising on sell-side aggression, which is new sellers committing rather than buyers leaving. Shorts covering is that series retracing as they buy back.
The distinction that matters most is between building and unwinding, because they produce identical price action for opposite reasons. A market rising while longs build is being bought by people taking on risk. A market rising while shorts cover is being bought by people getting out of risk, and when they have finished, the buying stops with them. Price alone cannot separate those two. Net positioning can.

Running both series together is the most informative view, because the interesting moments are usually when they move independently: one side committing hard while the other sits still says considerably more than either series alone.
What are the limits of net positioning?
It is relative to your window, not absolute. Both series begin at zero at the start of the loaded range, so they measure accumulated change across what you are looking at rather than the market’s total positioning. Scroll to a different range and the baseline moves with it. Read the shape and the direction, never the raw level as a market-wide figure.
It needs open interest. The measurement is built on open interest confirming the flow, so it exists only on derivatives. There is nothing to confirm against on spot markets.
It inherits its inputs’ weaknesses. Aggressor classification is the exchange’s, and open interest is reported per venue with its own conventions, so both underlying limitations carry through.
It says nothing about who. New longs are new longs whether they belong to a hedger, a market maker offsetting elsewhere, or a directional bet.
Related: Open interest · Volume delta · CVD (Cumulative Volume Delta) · Liquidations
Using Net Positioning in MMT
MMT’s Net Positioning (NS/NL) layer plots the two series in a panel below the price chart. Four modes cover the delta between them or either side alone, positioning changes can be labeled directly on the bars, and absorption can be flagged automatically.
How do you add Net Positioning to a chart?
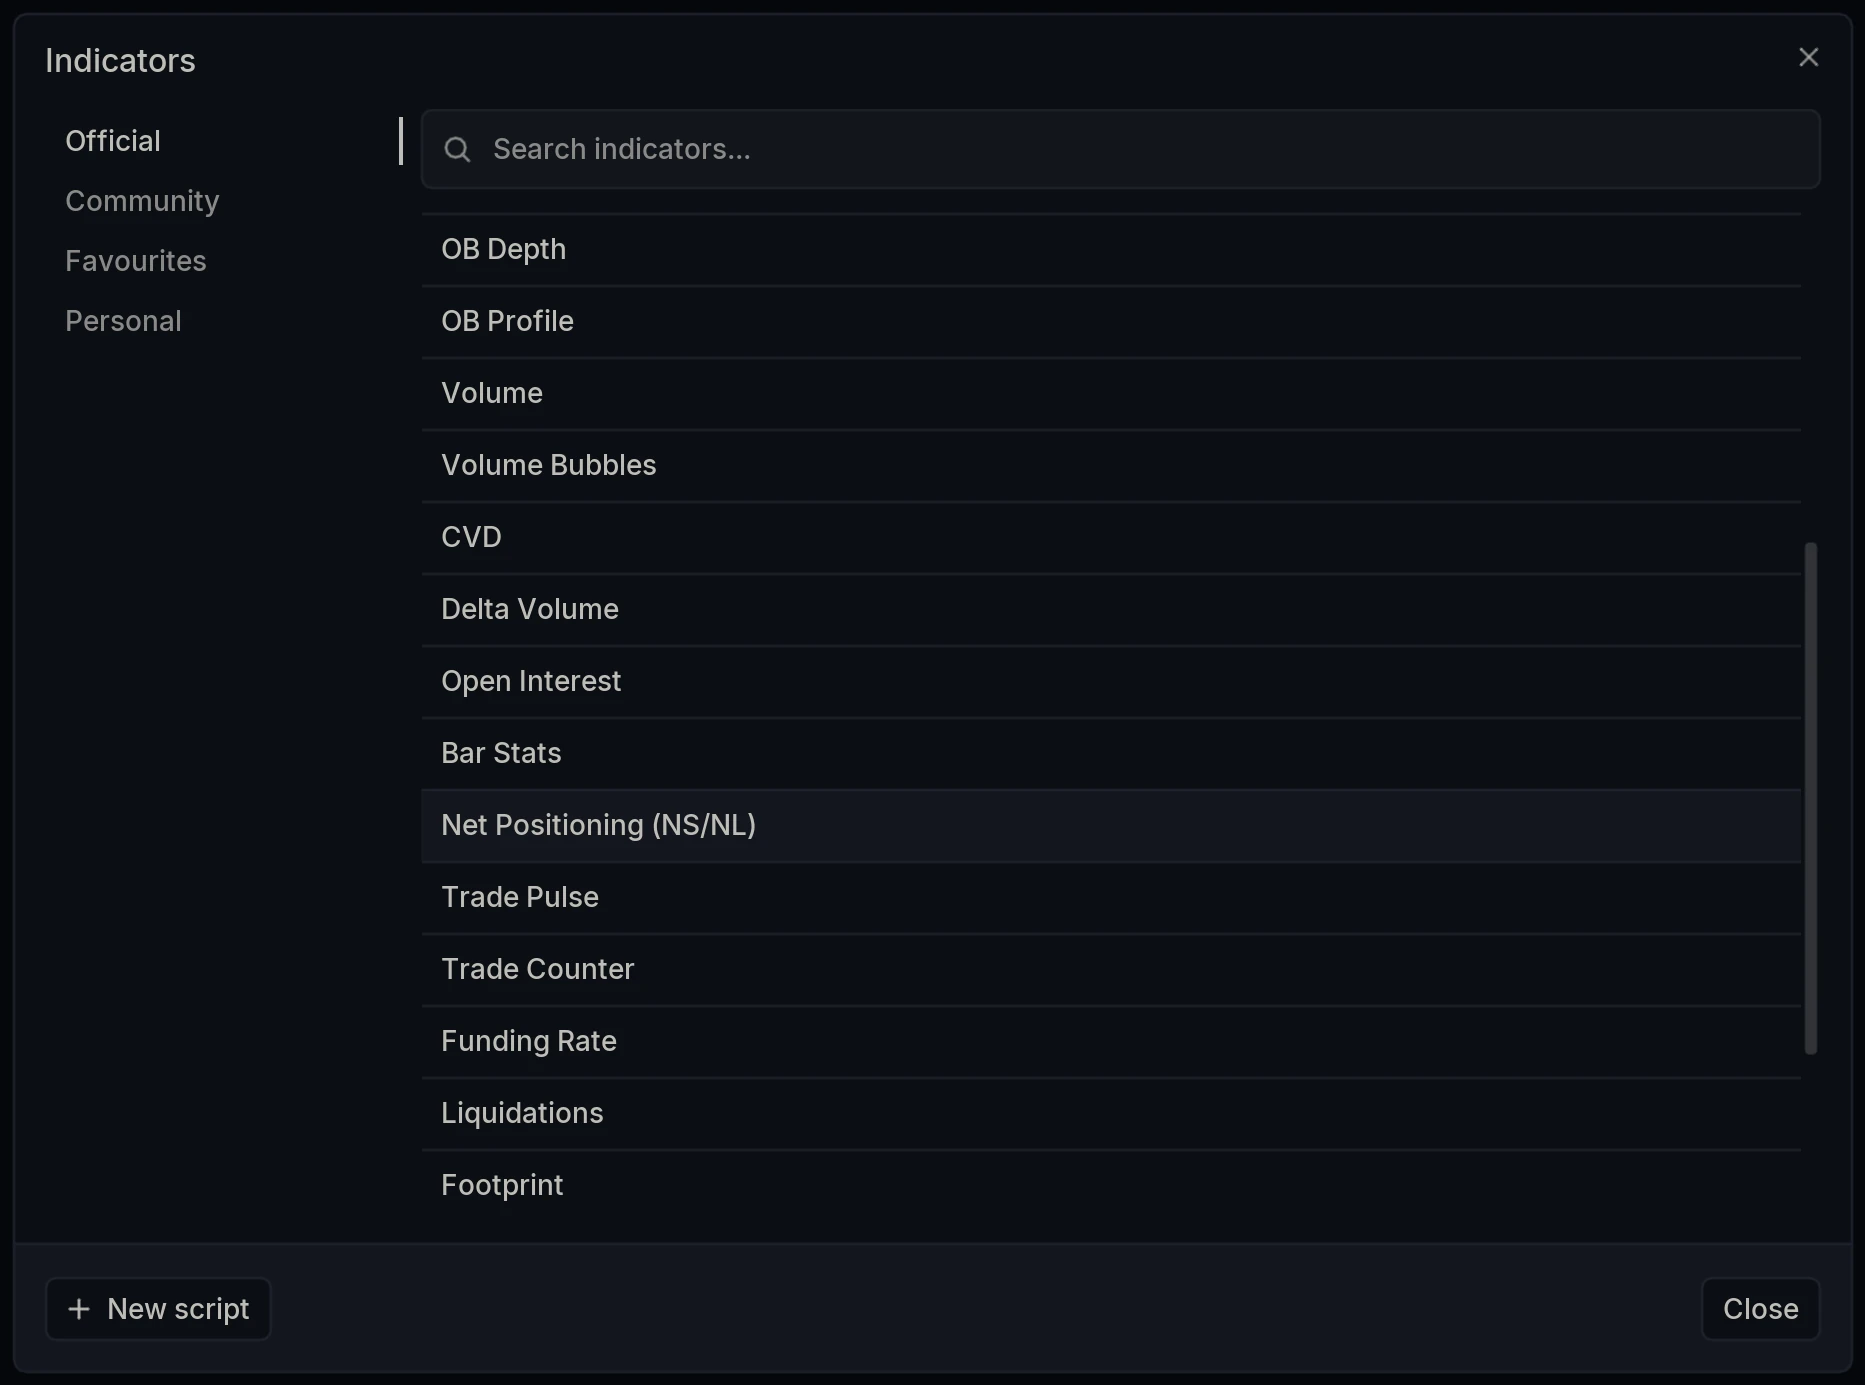
Open the Indicators dialog and select Net Positioning (NS/NL) under Official.
What are the four modes?
Mode selects what the panel plots.
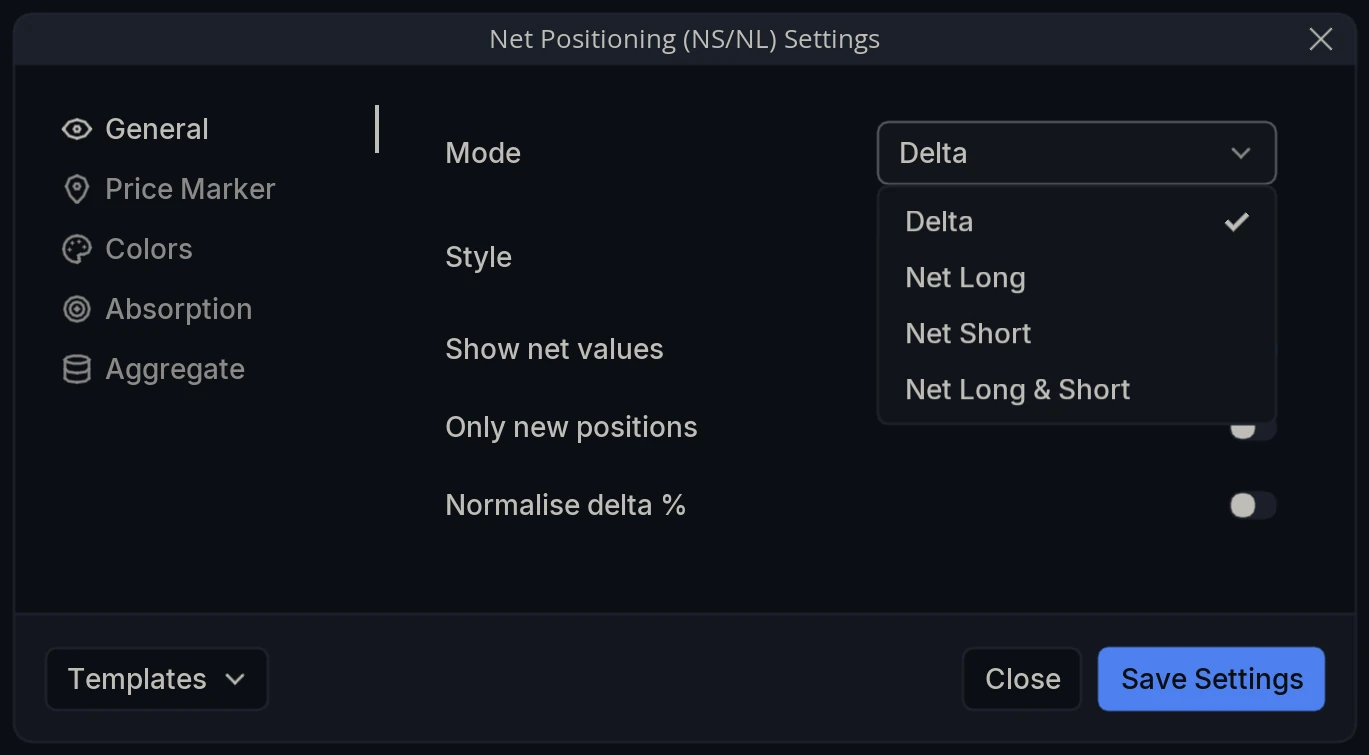
Delta is the difference between the two sides per bar, drawn as a histogram around zero. Bars above the line are periods where longs grew faster than shorts, bars below it the reverse. This is the quickest read on which side gained ground in a given bar.

Net Long plots the long series alone.

Net Short plots the short series alone.

Net Long & Short runs both together, which is the view most worth leaving on.
The three line modes can be drawn as a Line or as Candlesticks, set by Style. Candlesticks are worth the extra ink: each bar carries a real open, high, low and close, because the same classification runs against the open interest range inside the bar rather than only its net change. A long wick is positioning that was built and given back within the period, which a line flattens away entirely.
How do you label the bars?
Show net values prints each bar’s positioning change directly above or below it, so the figures can be read rather than estimated from bar height.
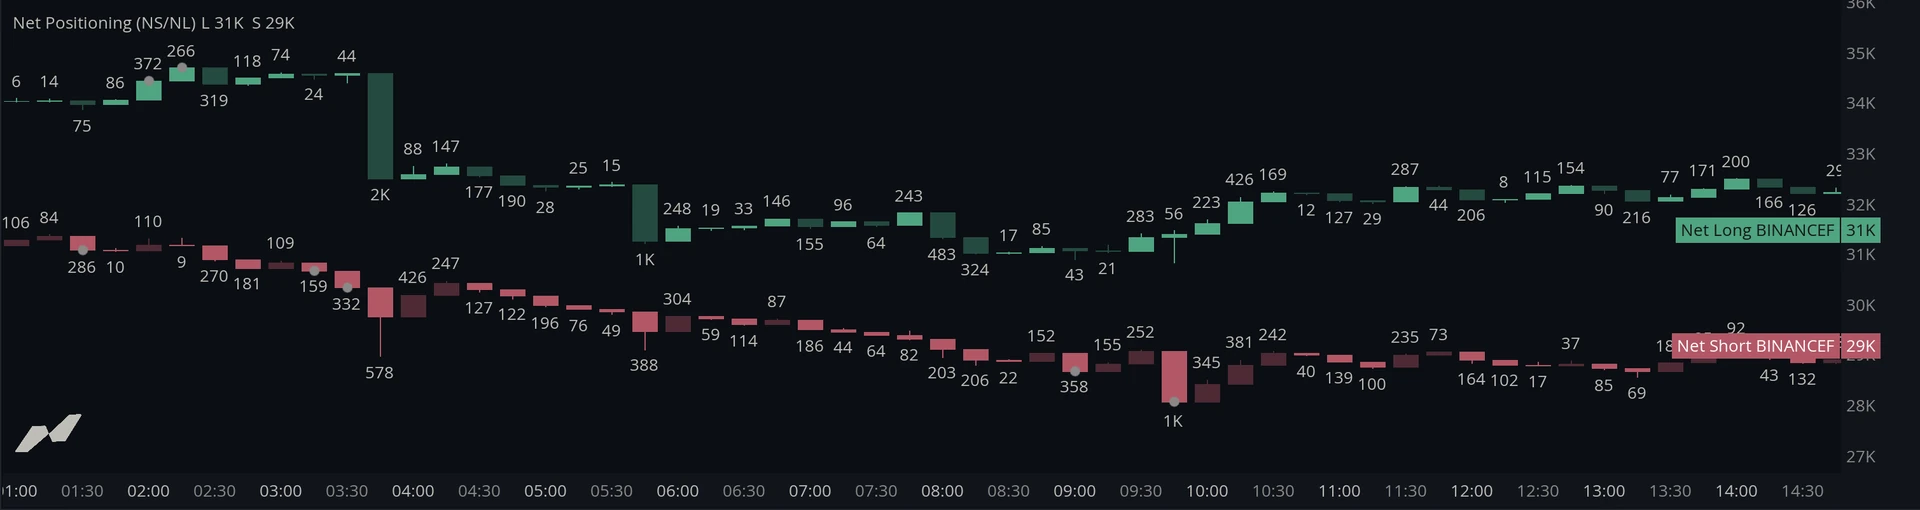
It is worth turning on when the question is how much rather than which way, and worth turning off on a busy chart, since a label per bar per series adds up quickly.
What does absorption flag?
Absorption is heavy new positioning that failed to move price.
A bar qualifies when three conditions hold at once:
-
Open interest increased, so the positioning is genuinely new rather than contracts changing hands.
-
The amount of new positioning was large measured against the previous bars.
-
Price moved less than it normally does for that much positioning.
Together those describe a specific event. A lot of fresh exposure went on and the market barely responded, which means someone on the other side had enough resting size to take all of it without giving ground.

Each flagged bar is marked with a small circle, so they can be found without reading every bar. They are worth locating on the price chart above, because a level that swallows heavy positioning without moving is a level somebody is defending, and those tend to sit at the edges of ranges and ahead of reversals.
Sensitivity runs from 10 to 90, and the higher the setting the more bars are flagged. Start low to see only the clearest cases and raise it if the plot looks emptier than the market felt.
Layer Settings
Open Net Positioning (NS/NL) Settings via the cog wheel on the layer name. The panel has five tabs: General, Price Marker, Colors, Absorption and Aggregate.
General
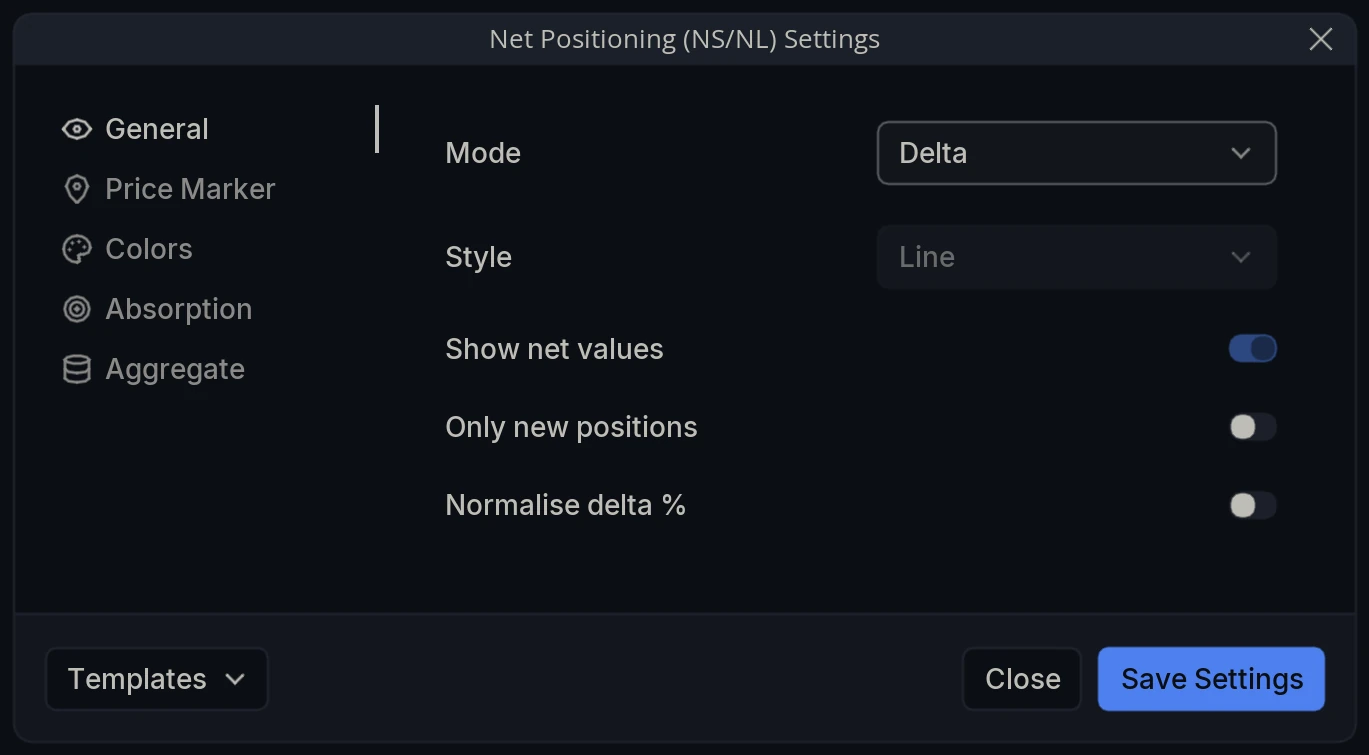
Mode - What the panel plots: Delta, Net Long, Net Short or Net Long & Short.
Style - How the series are drawn: Line or Candlesticks. Available in Net Long, Net Short and Net Long & Short; inactive in Delta, which is always a histogram.
Show net values - Print each bar’s positioning change above or below the bar.
Only new positions - Hide the closing bars, leaving only positions being opened. Applies to Delta mode only.
Normalise delta % - Express the delta as a percentage rather than an absolute figure, so it stays comparable as the market grows.
Price Marker
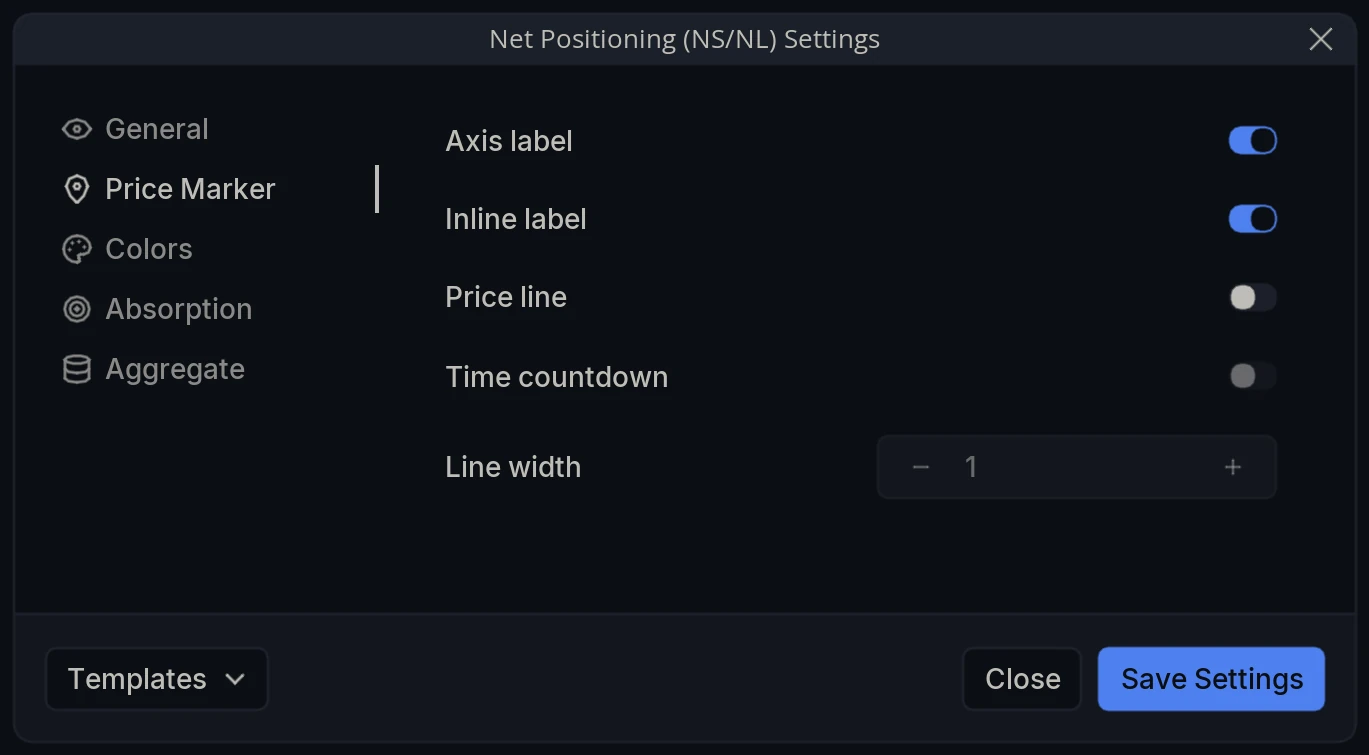
Axis label - Show the current value as a label on the panel’s axis.
Inline label - Show that value on the panel itself rather than on the axis.
Price line - Draw a horizontal line across the panel at the current value.
Time countdown - Show the time remaining until the current candle closes.
Line width - Thickness of that line.
Colors
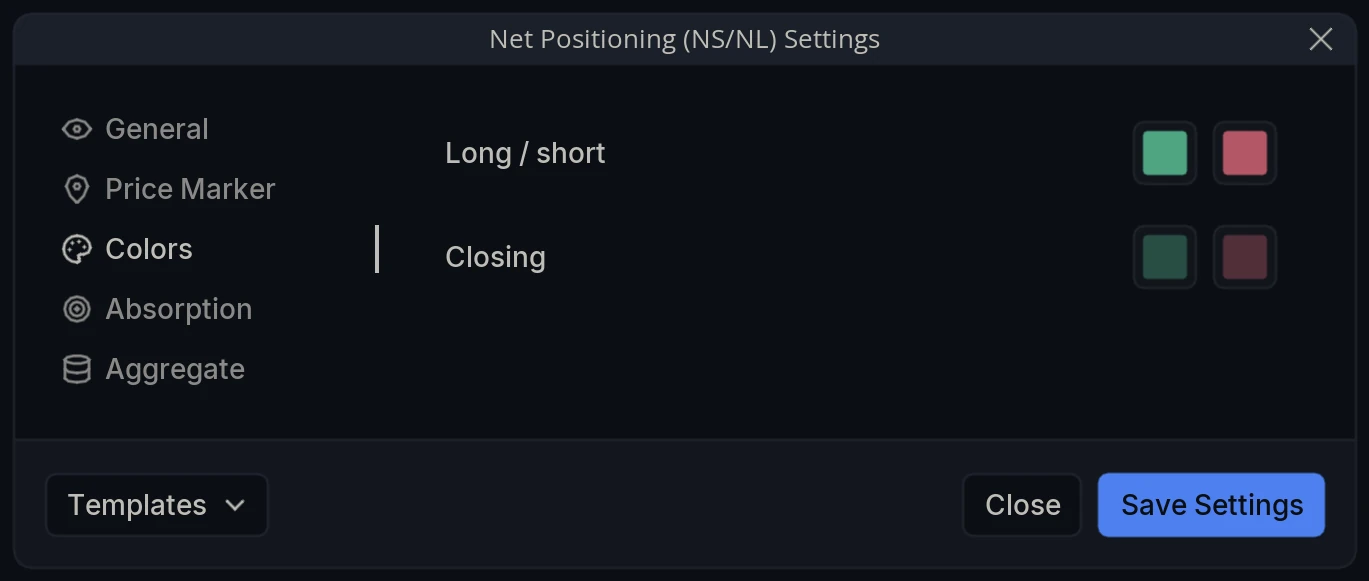
Long / short - The two colors used for positions being opened, one per side.
Closing - The darker pair used for positions being closed, so opening and closing activity are distinguishable at a glance rather than by reading direction.
Absorption
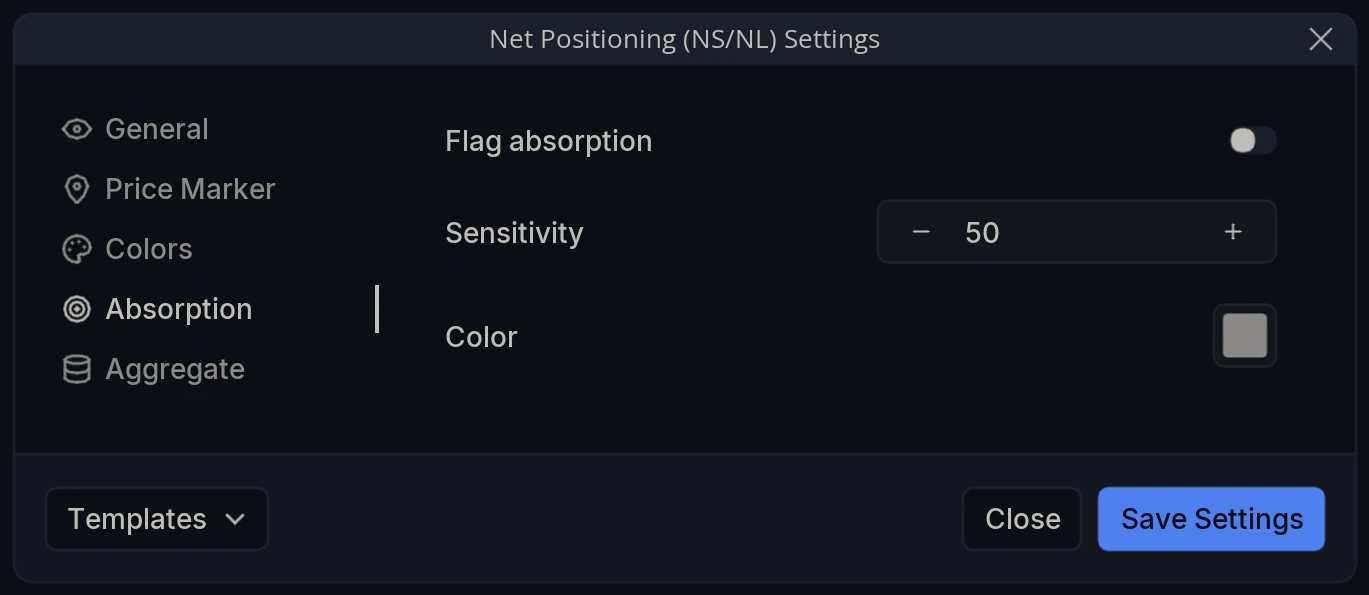
Flag absorption - Mark bars with a circle where open interest rose, the new positioning was large against the previous bars, and price moved less than it normally does for that much positioning.
Sensitivity - How readily a bar qualifies, from 10 to 90. Higher values flag more bars.
Color - The color of those markers.
Aggregate
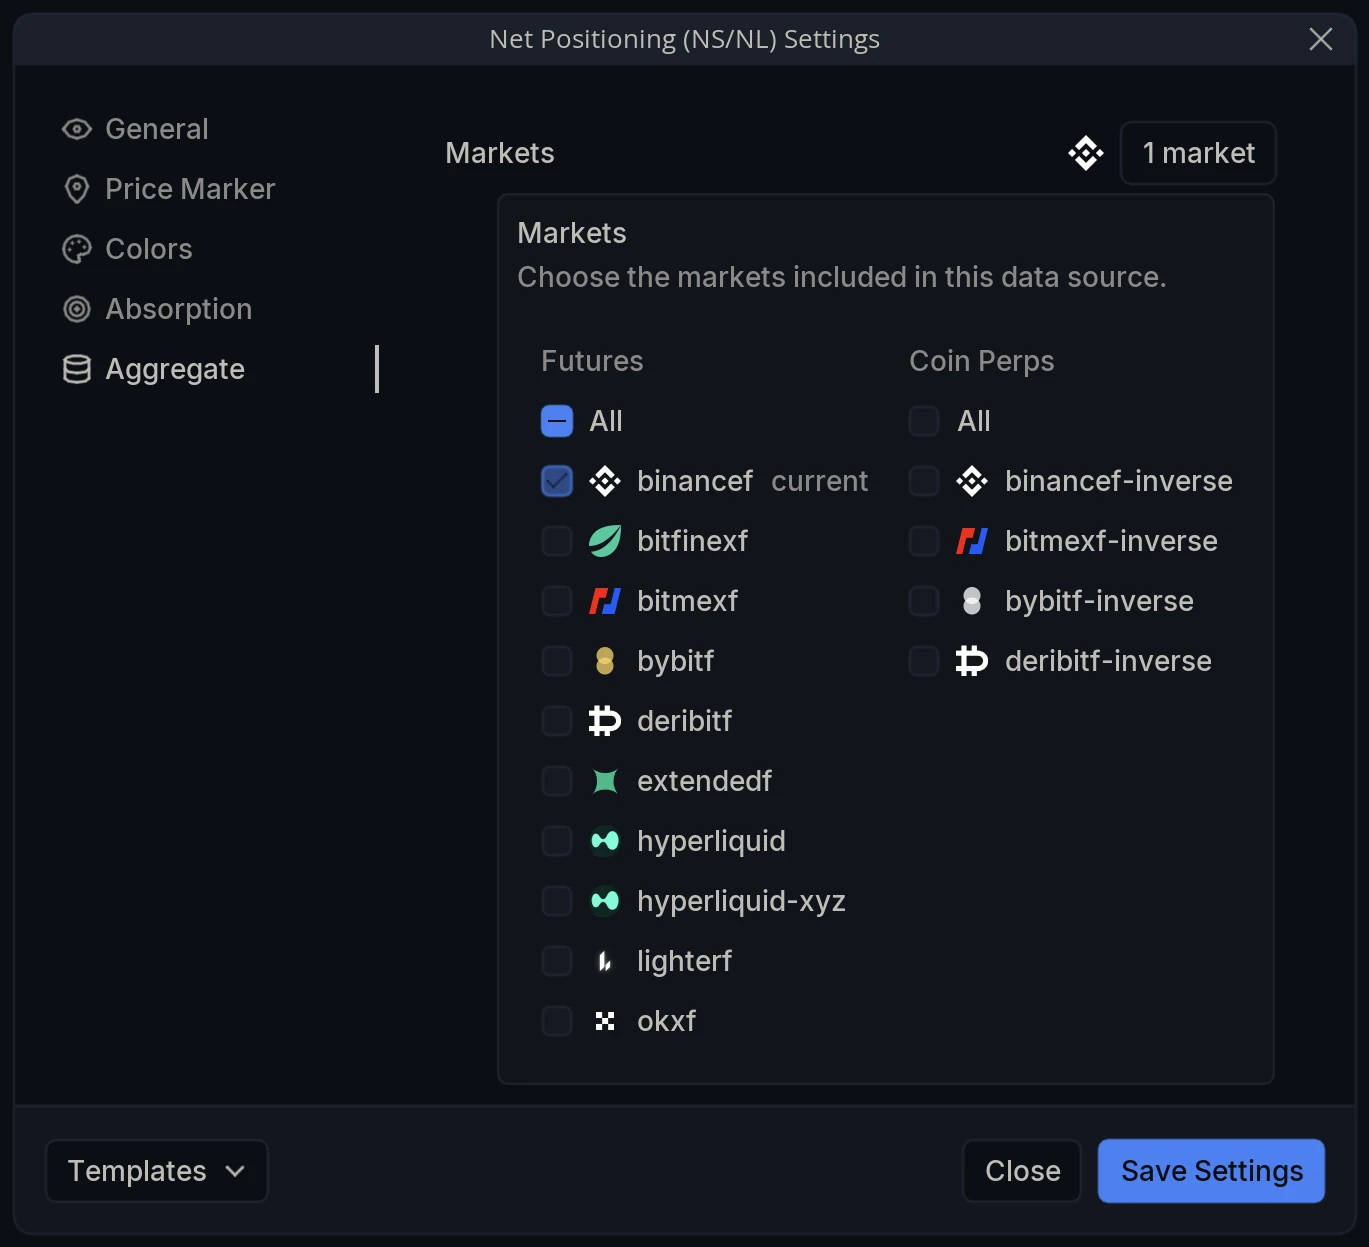
Markets - Choose the markets included in the calculation. The selector offers Futures and Coin Perps only, with no Spot column, because the measurement depends on open interest and spot markets have none. Your chart’s own market is tagged current.