What is VWAP (Volume Weighted Average Price)?
By MichaelUpdated August 25, 2026
VWAP (Volume Weighted Average Price) is the average price a market has traded at over a period, weighted by volume. Prices where more volume traded count for more, so the line tracks where the bulk of business was actually done rather than the midpoint of the range.
How does VWAP work?
A simple average treats every price equally. If a market spends one candle at 100 on almost no volume and ten candles at 90 on heavy volume, a simple average is pulled toward 100 more than the trading justifies.
VWAP corrects that by weighting each price by the volume that traded there. Each period’s price is multiplied by its volume, those products are summed, and the total is divided by the total volume. The result is a single line representing the volume-weighted average from the start of the measurement period to now.
That makes VWAP a benchmark rather than a signal. Institutions use it to judge execution quality: filling below VWAP on a buy order means beating the day’s average price. Traders use it as a reference for value, since price above VWAP means buyers have on average paid up relative to the session and price below it means the opposite. Because VWAP resets at the start of each period, it describes the current session rather than the market’s whole history.
How do you read VWAP?
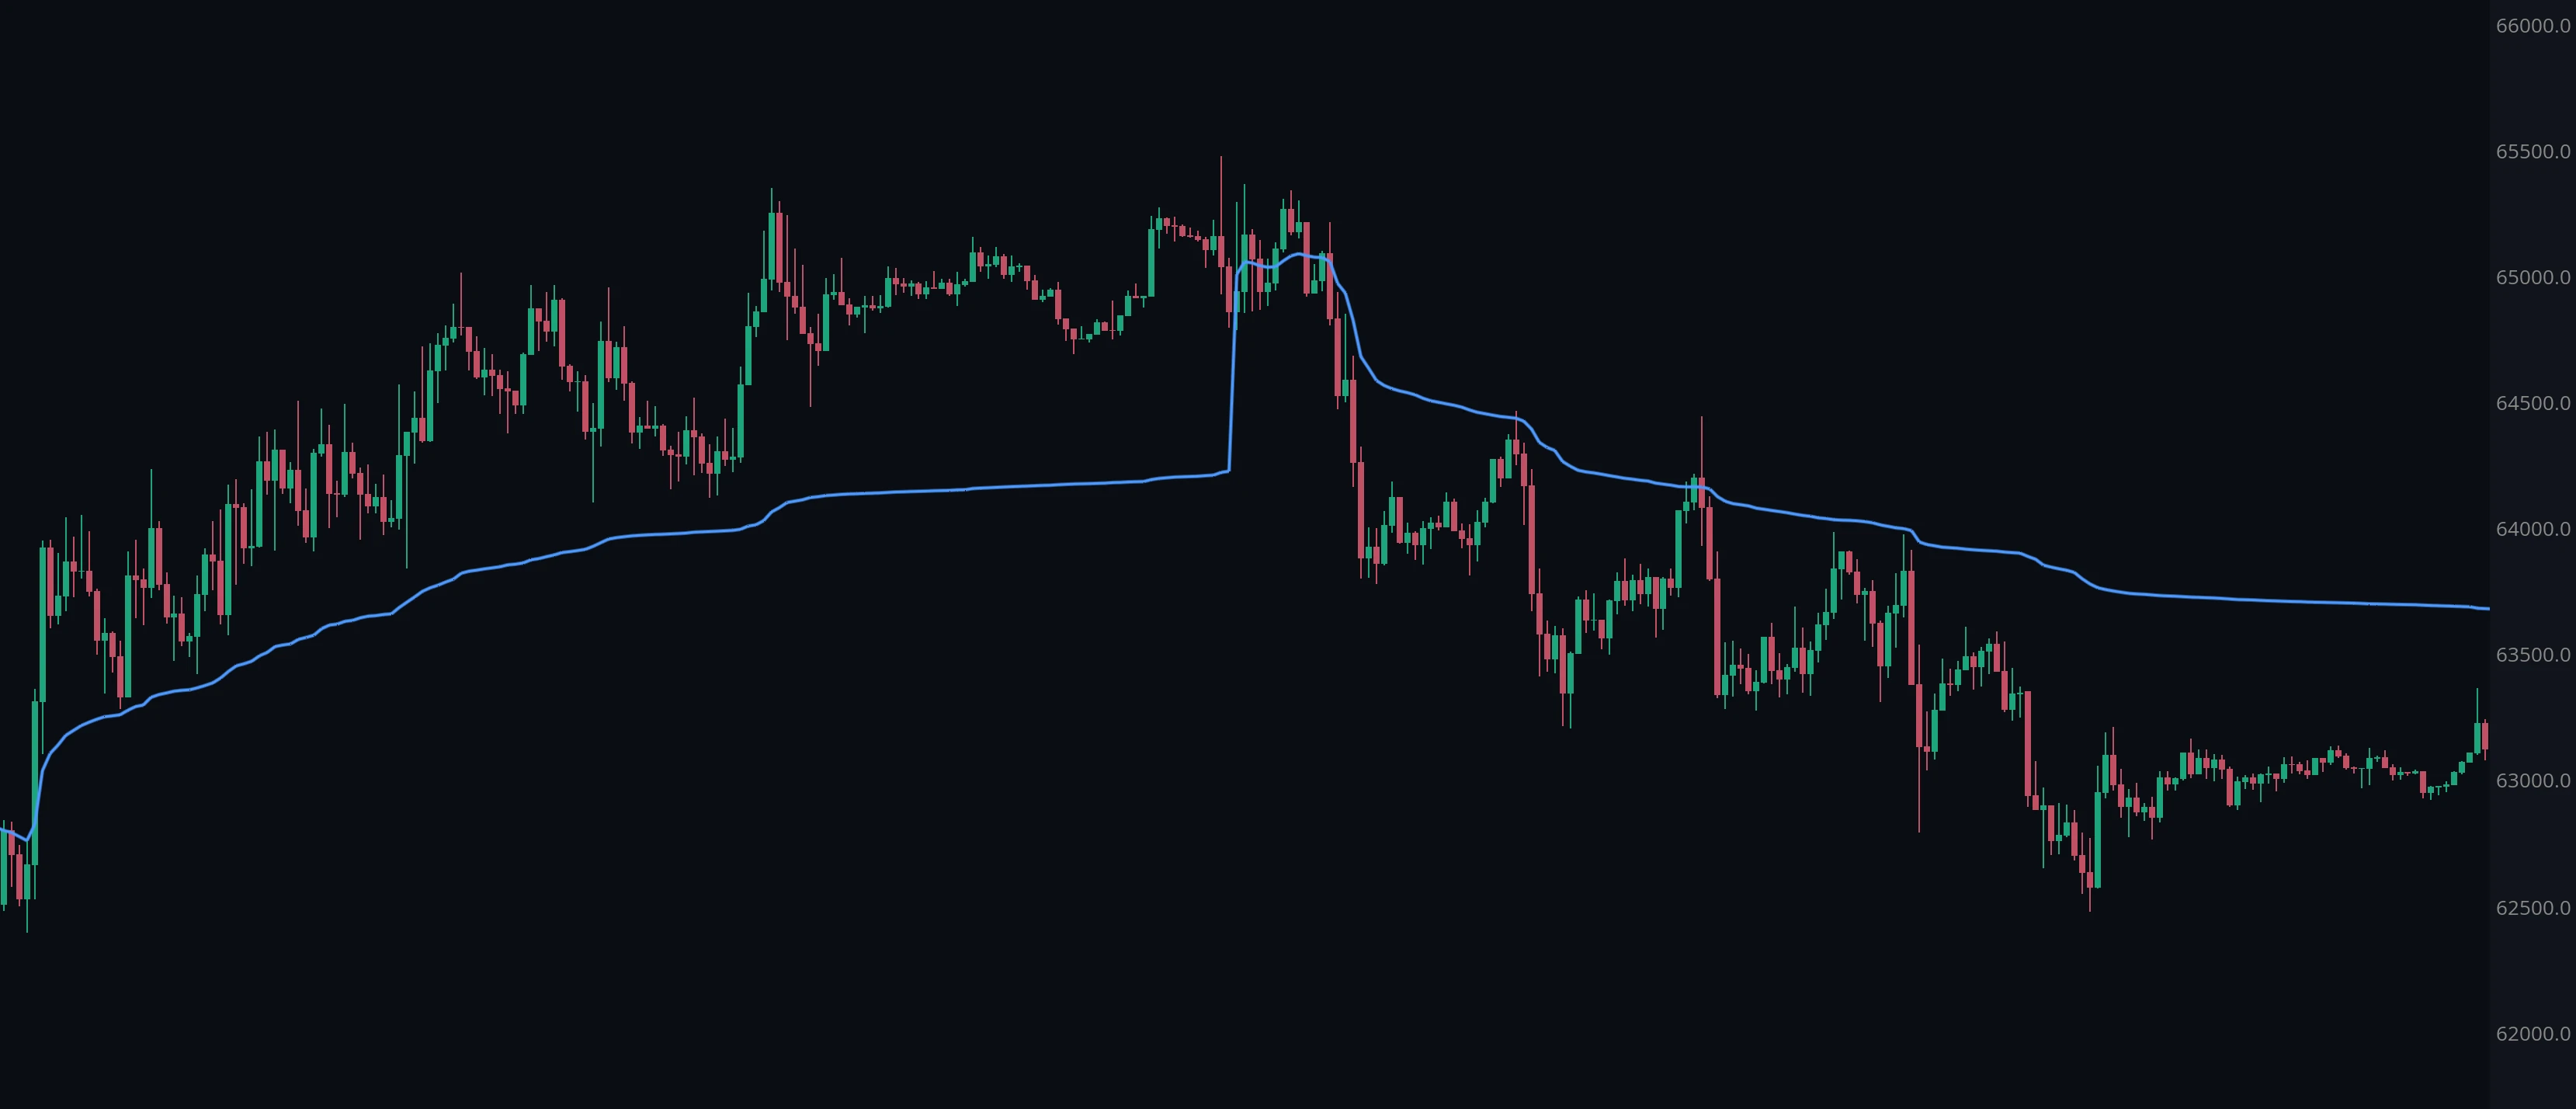
The basic reading is position: price above VWAP means the average participant in this period is in profit on a long, price below it means they are not. Traders often treat that as a rough dividing line between bullish and bearish control within a session.
Because so many participants watch it, VWAP frequently behaves as support or resistance. Price returning to it after trending away is a common test, and whether it holds says a good deal about whether the move has agreement behind it.
The slope matters too. A rising VWAP means each new period is trading above the running average and pulling it up. A flat VWAP is a market in balance, with new trade doing little to move the average, which is the shape you see in ranges.
What is an anchored VWAP?
A standard VWAP resets on a fixed schedule - each day, week or month. An anchored VWAP instead starts from a point you choose.
That matters because the reset point determines what the average describes. Anchoring to a significant high, a low, a breakout candle or a news event gives you the average price paid by everyone who has traded since that moment. If price is above an anchored VWAP set at a swing low, everyone who bought since the low is on average in profit; if it is below, they are not.
Anchoring turns VWAP from a session benchmark into a measure of a specific participant group’s position, which is why it is the version most discretionary traders reach for.
What are VWAP bands?
VWAP bands are lines drawn a set distance above and below the VWAP itself, marking how far price has stretched from the volume weighted average.
The distance is usually measured in standard deviations, so the bands widen when the market is volatile and narrow when it is quiet. Price at the first band is modestly extended; price at the second or third is unusually far from where the bulk of business was done, and in ranging conditions the outer bands are often where moves exhaust and turn back.
Bands can also be set as a fixed percentage from VWAP, which keeps the distance constant rather than adapting to volatility.
When should you use VWAP?
VWAP is at its most useful intraday, where it does what it was designed for: describe the session’s average traded price and act as a reference for execution and for value.
It is a natural fit for judging whether a move has agreement behind it, for framing mean reversion trades against the bands, and, in its anchored form, for measuring where a specific cohort of participants sits relative to their average entry.
Its weakness is that it is a lagging, cumulative measure. Early in a session it moves quickly on little data; late in a session it is heavy and slow to respond, so a late break of VWAP means less than an early one.
Related: Volume · Volume Profile Visible Range (VPVR) · TPO market profile
Using VWAP in MMT
MMT’s VWAP draws directly on the price chart. The anchor can be a rolling period or a point you pick yourself, the price source is configurable, and up to three deviation bands can be drawn around it.
How do you add VWAP to a chart?
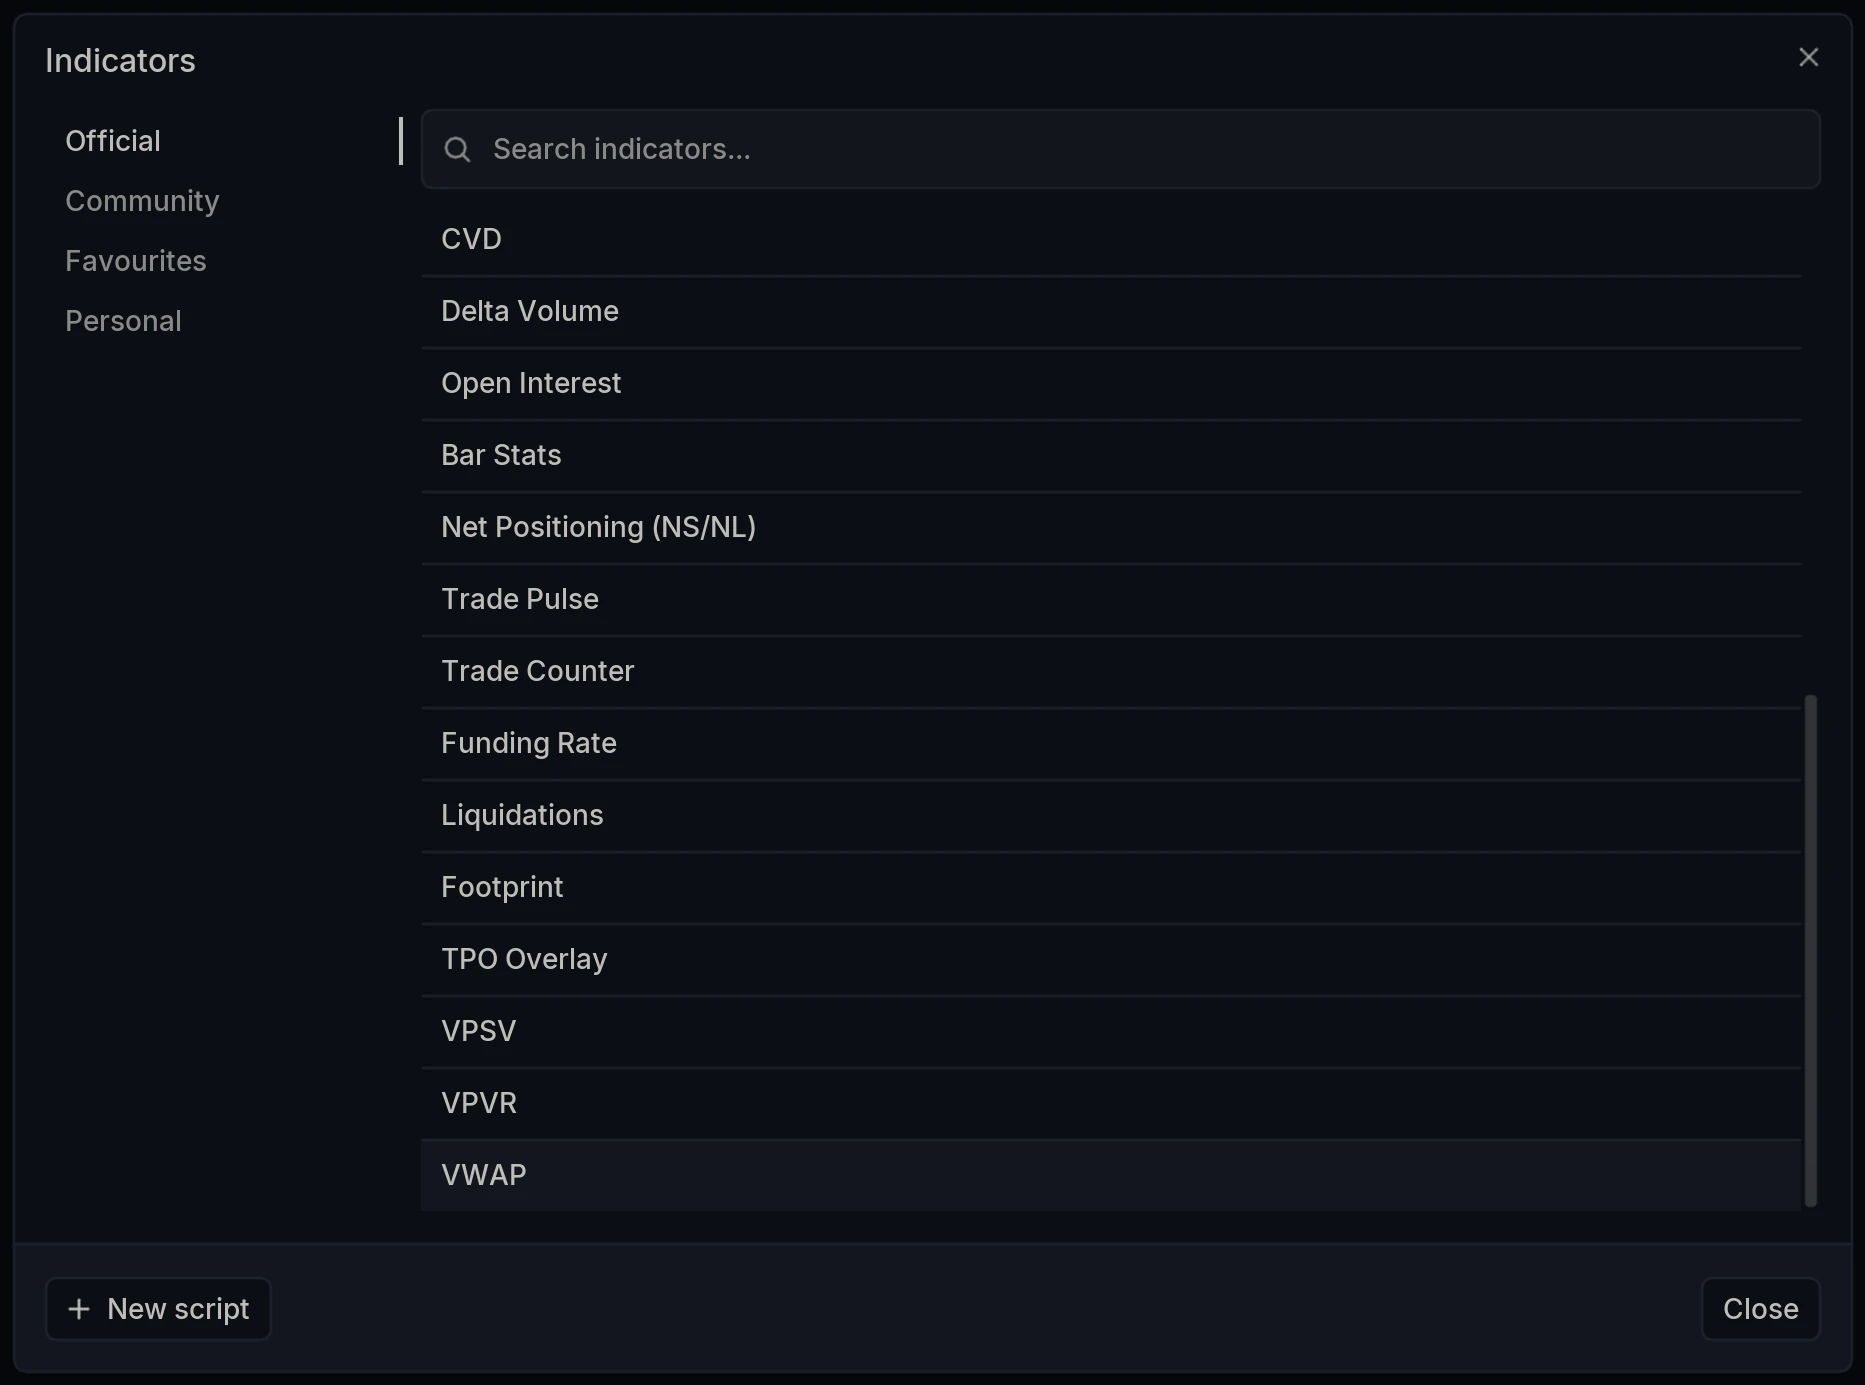
Open the Indicators dialog and select VWAP under Official.
How do you set the anchor?
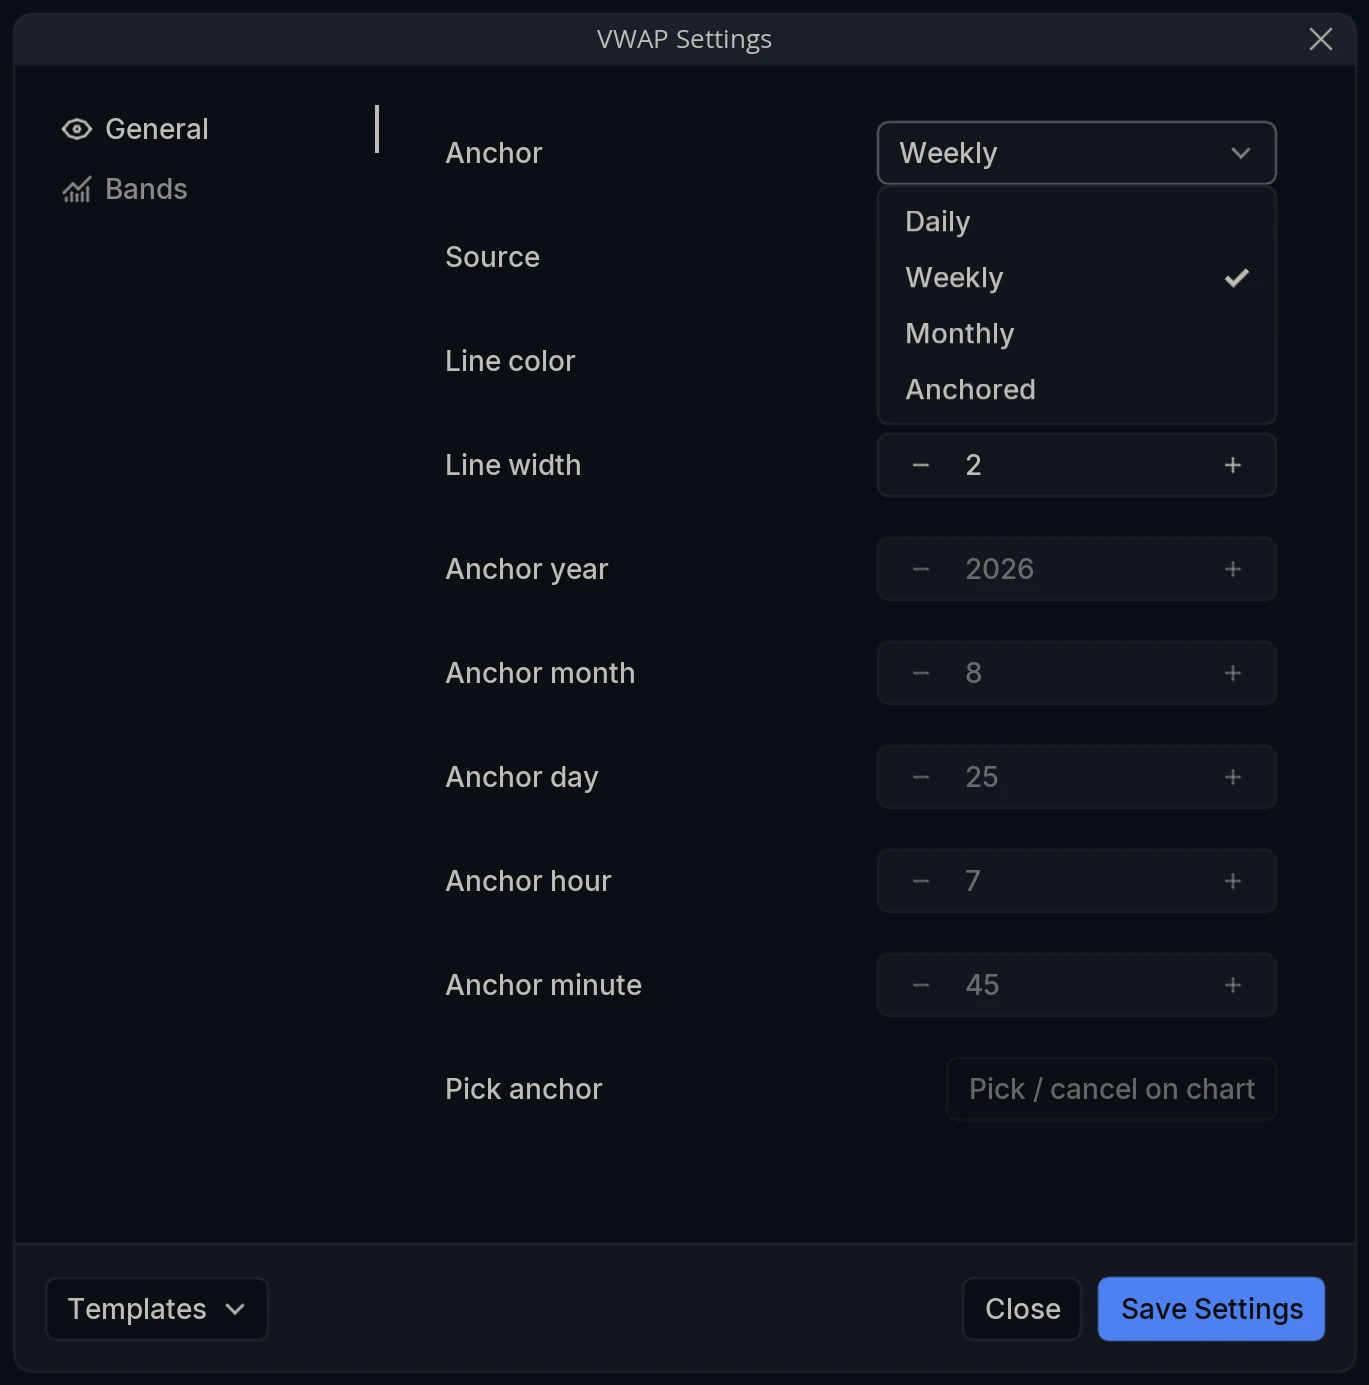
The Anchor dropdown offers Daily, Weekly, Monthly and Anchored. The first three reset on that schedule; Anchored starts from a fixed point in time that you specify.
With Anchored selected, the anchor point can be set two ways. The Anchor year, month, day, hour and minute fields let you type an exact timestamp. Pick anchor is quicker: click Pick / cancel on chart and then click the candle you want to anchor to, which is the practical way to anchor to a high, a low or a breakout.
Layer Settings
Open VWAP Settings via the cog wheel on the layer name. The panel has two tabs: General and Bands.
General
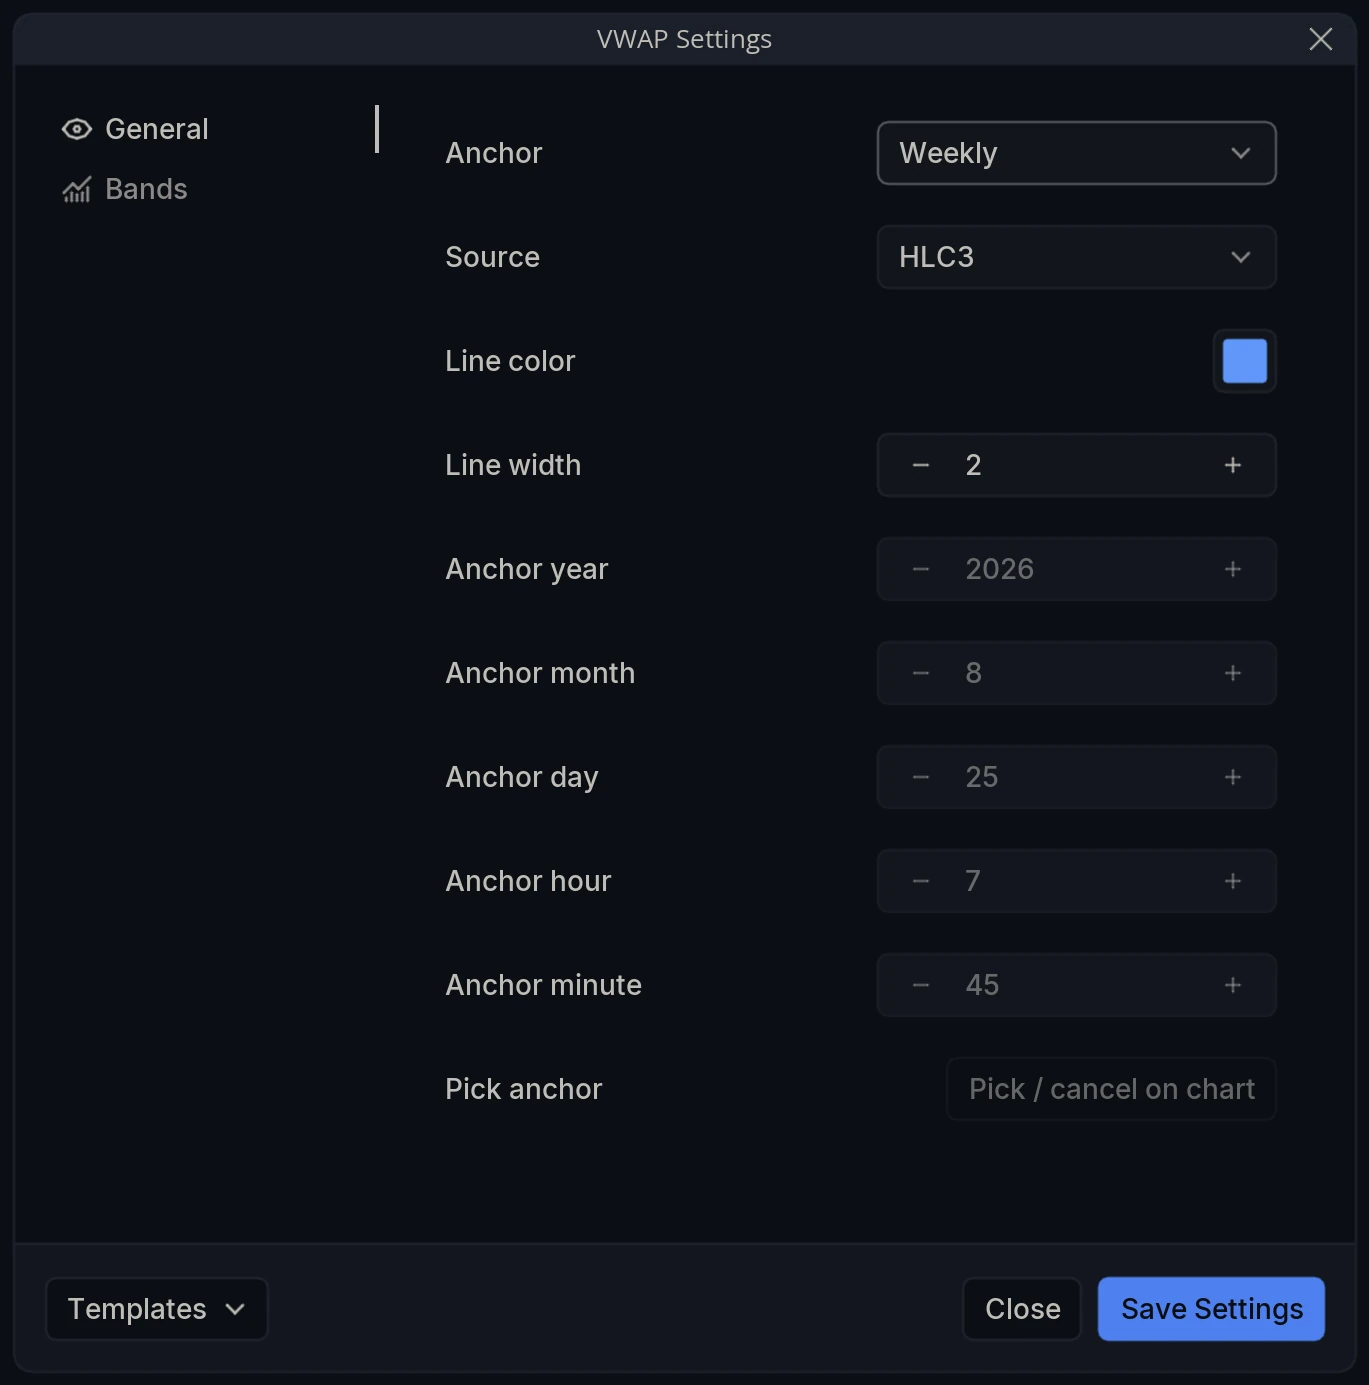
Anchor - When the calculation resets: Daily, Weekly, Monthly, or Anchored to a fixed point you choose.
Source - Which price of each candle feeds the calculation: HLC3 (the average of high, low and close), HL2 (high and low), OHLC4 (all four values) or Close.
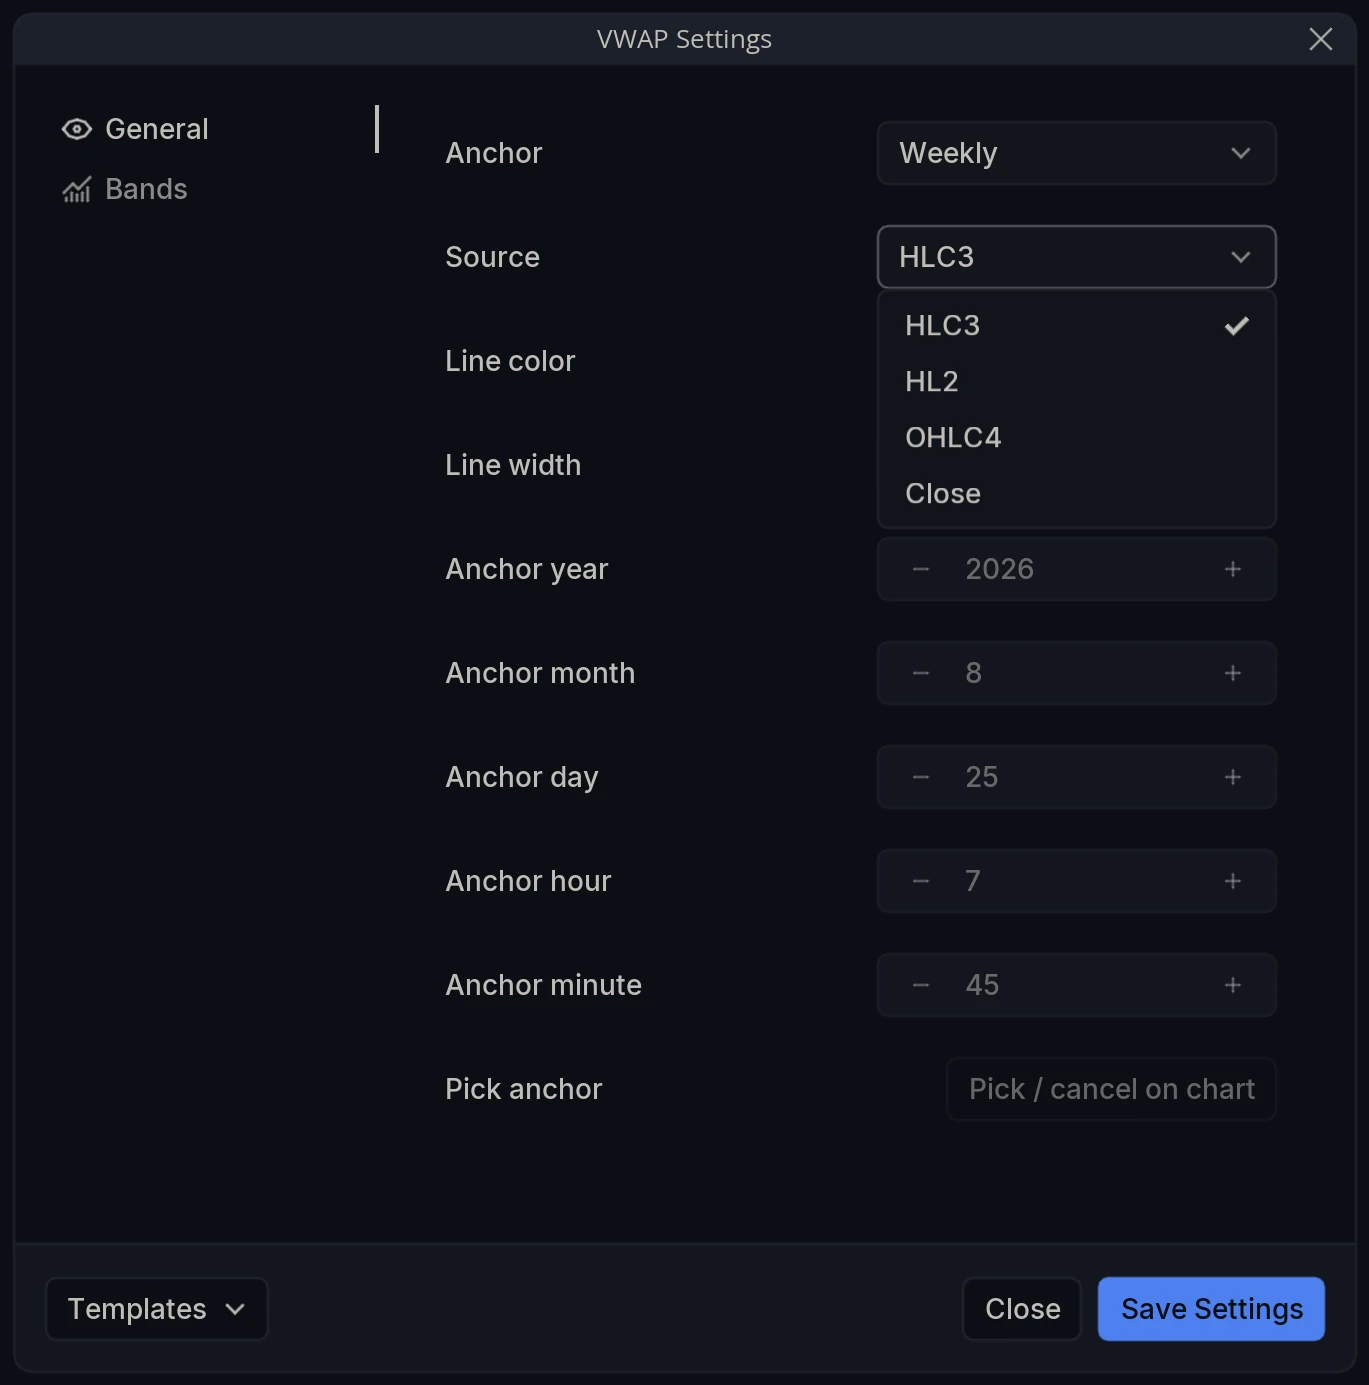
Line color - Color of the VWAP line.
Line width - Thickness of that line.
Anchor year / Anchor month / Anchor day / Anchor hour / Anchor minute - The exact timestamp the calculation starts from. Active only when Anchor is set to Anchored.
Pick anchor - Pick / cancel on chart lets you set the anchor by clicking a point on the chart rather than typing a timestamp.
Bands
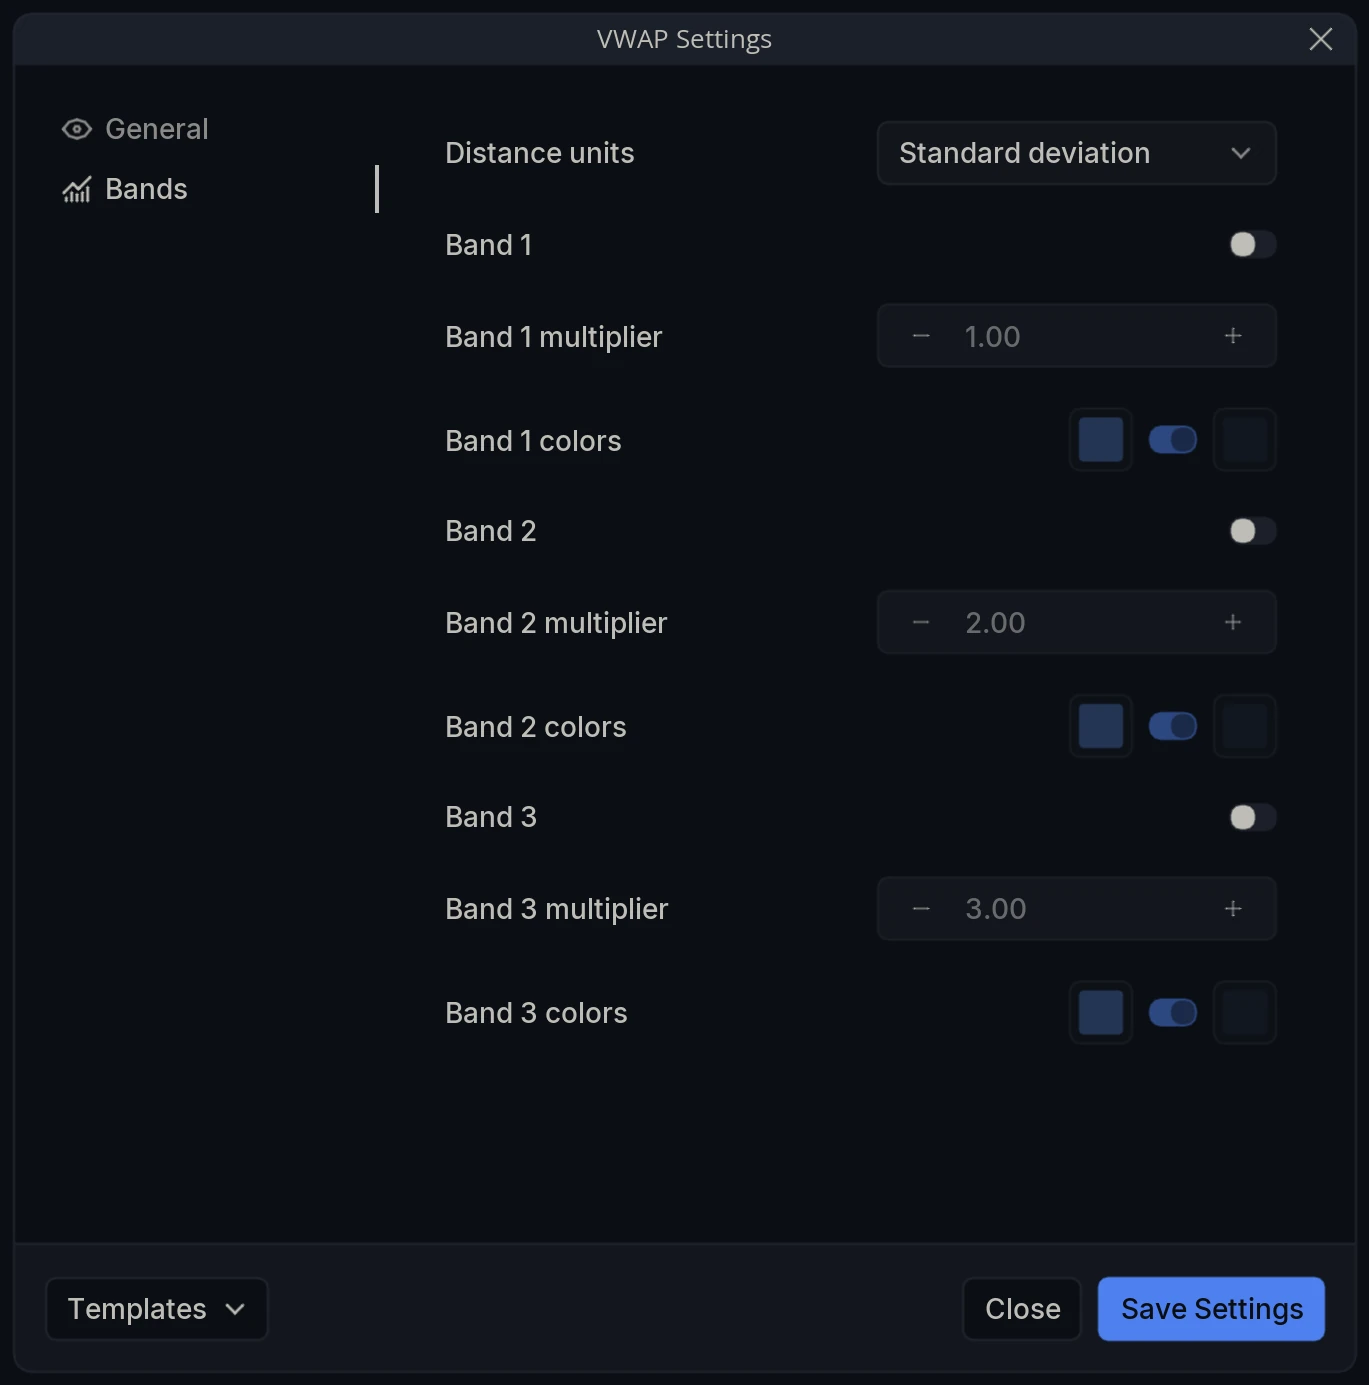
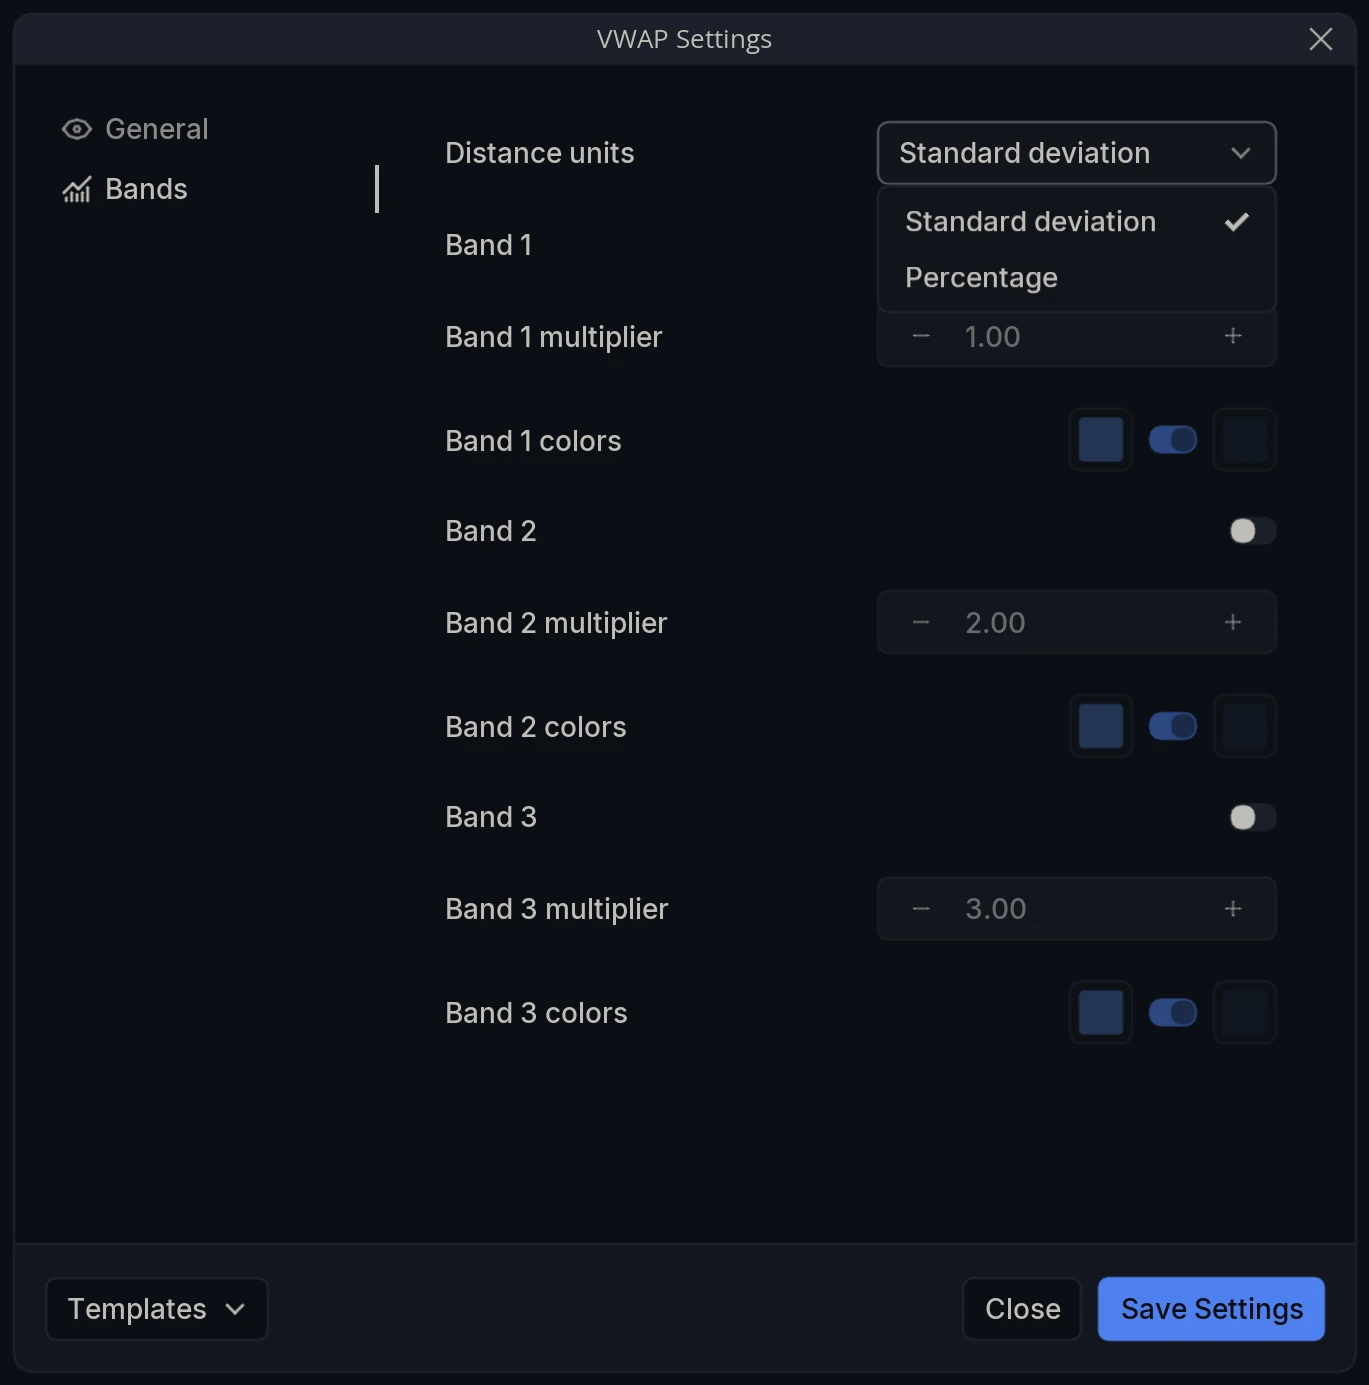
Distance units - How band distance is measured: Standard deviation, which adapts to volatility, or Percentage, which holds a fixed distance from the line.
Band 1 - Draw the first band pair.
Band 1 multiplier - How far from VWAP it sits, in the selected units. 1.00 by default.
Band 1 colors - The line colors for the upper and lower band, and a toggle for the fill between them.
Band 2 / Band 2 multiplier / Band 2 colors - The same for a second, wider band. 2.00 by default.
Band 3 / Band 3 multiplier / Band 3 colors - The same for a third band. 3.00 by default.