Learn
Learn order flow trading.
Plain guides to reading the market with real data: footprint charts, CVD, liquidation heatmaps, order book heatmaps, and volume profile. Written for traders who want to see what candlesticks leave out.
Start here
Core market concepts
30 guides
Profiles & price
TPO market profile
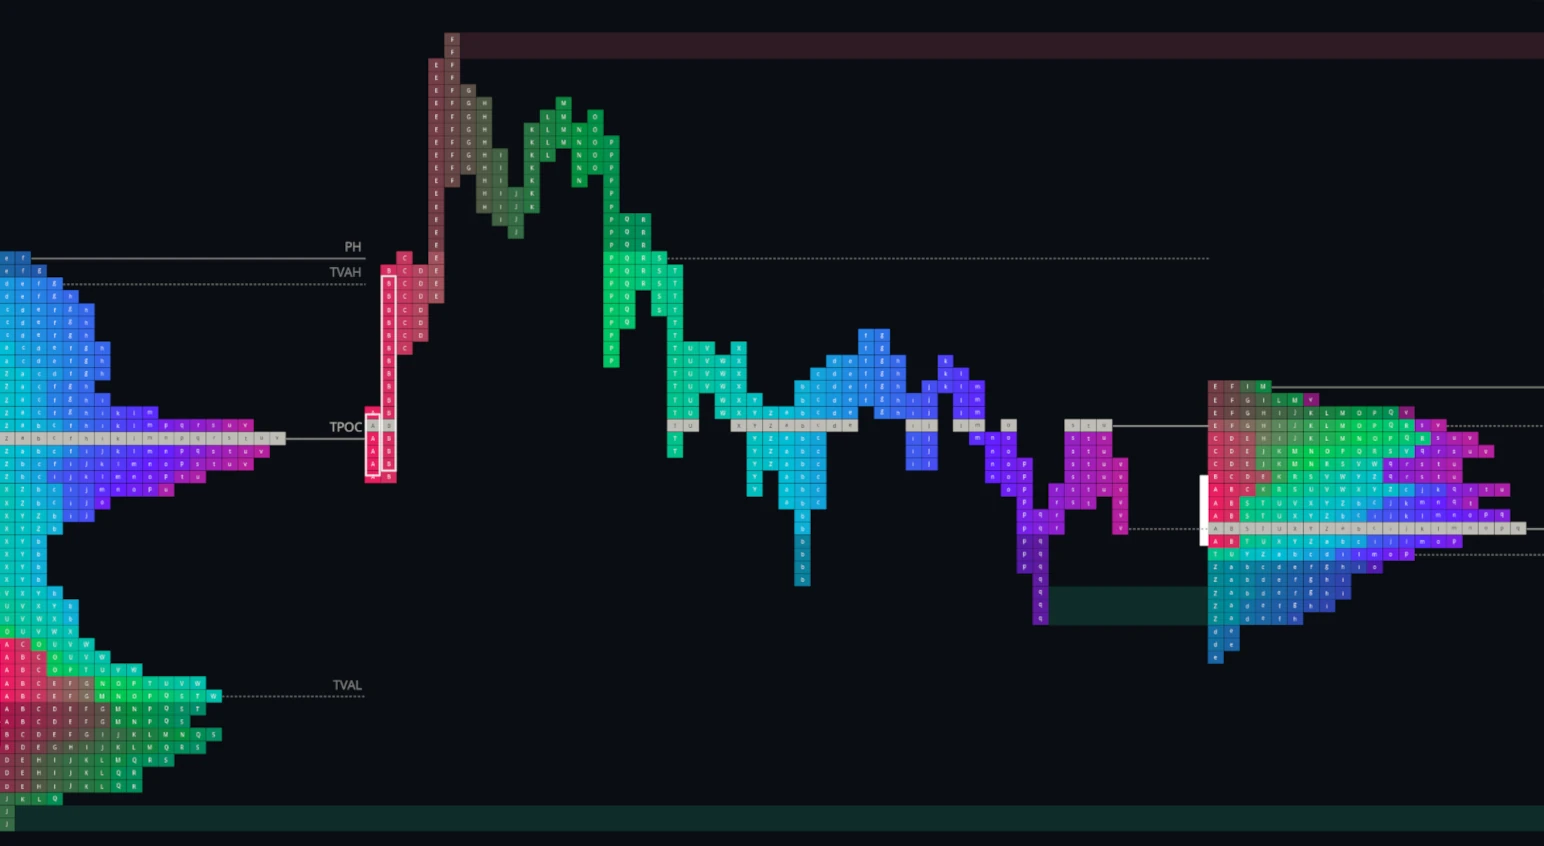
A TPO (Time Price Opportunity) market profile is a chart that shows how long a market traded at each price during a session. Time is divided into equal periods, and every price touched in a period is recorded, building a horizontal distribution in which the longest rows mark the prices the market accepted most.
Order flow
Footprint charts
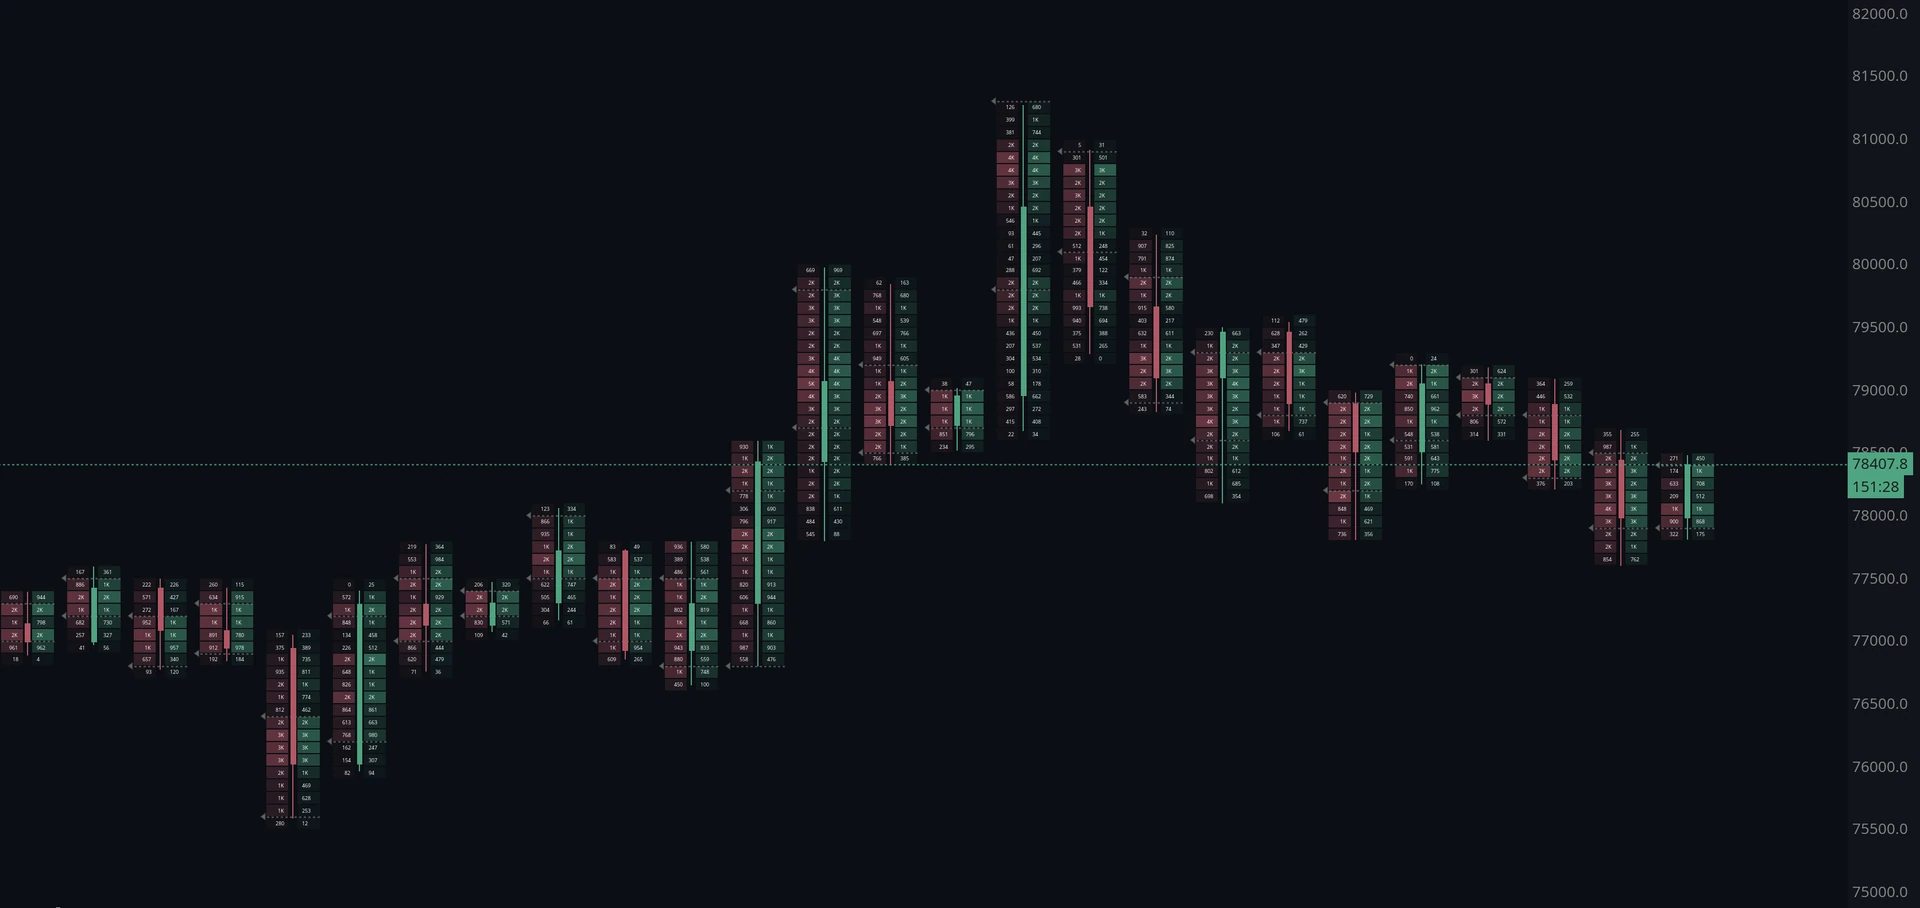
A footprint chart shows the trading that happened inside each candle, broken down by price. Instead of one bar summarizing a period, every price level within it displays how much was bought and sold there, so the buying and selling that produced the candle can be read directly.
Liquidity
Order book heatmap
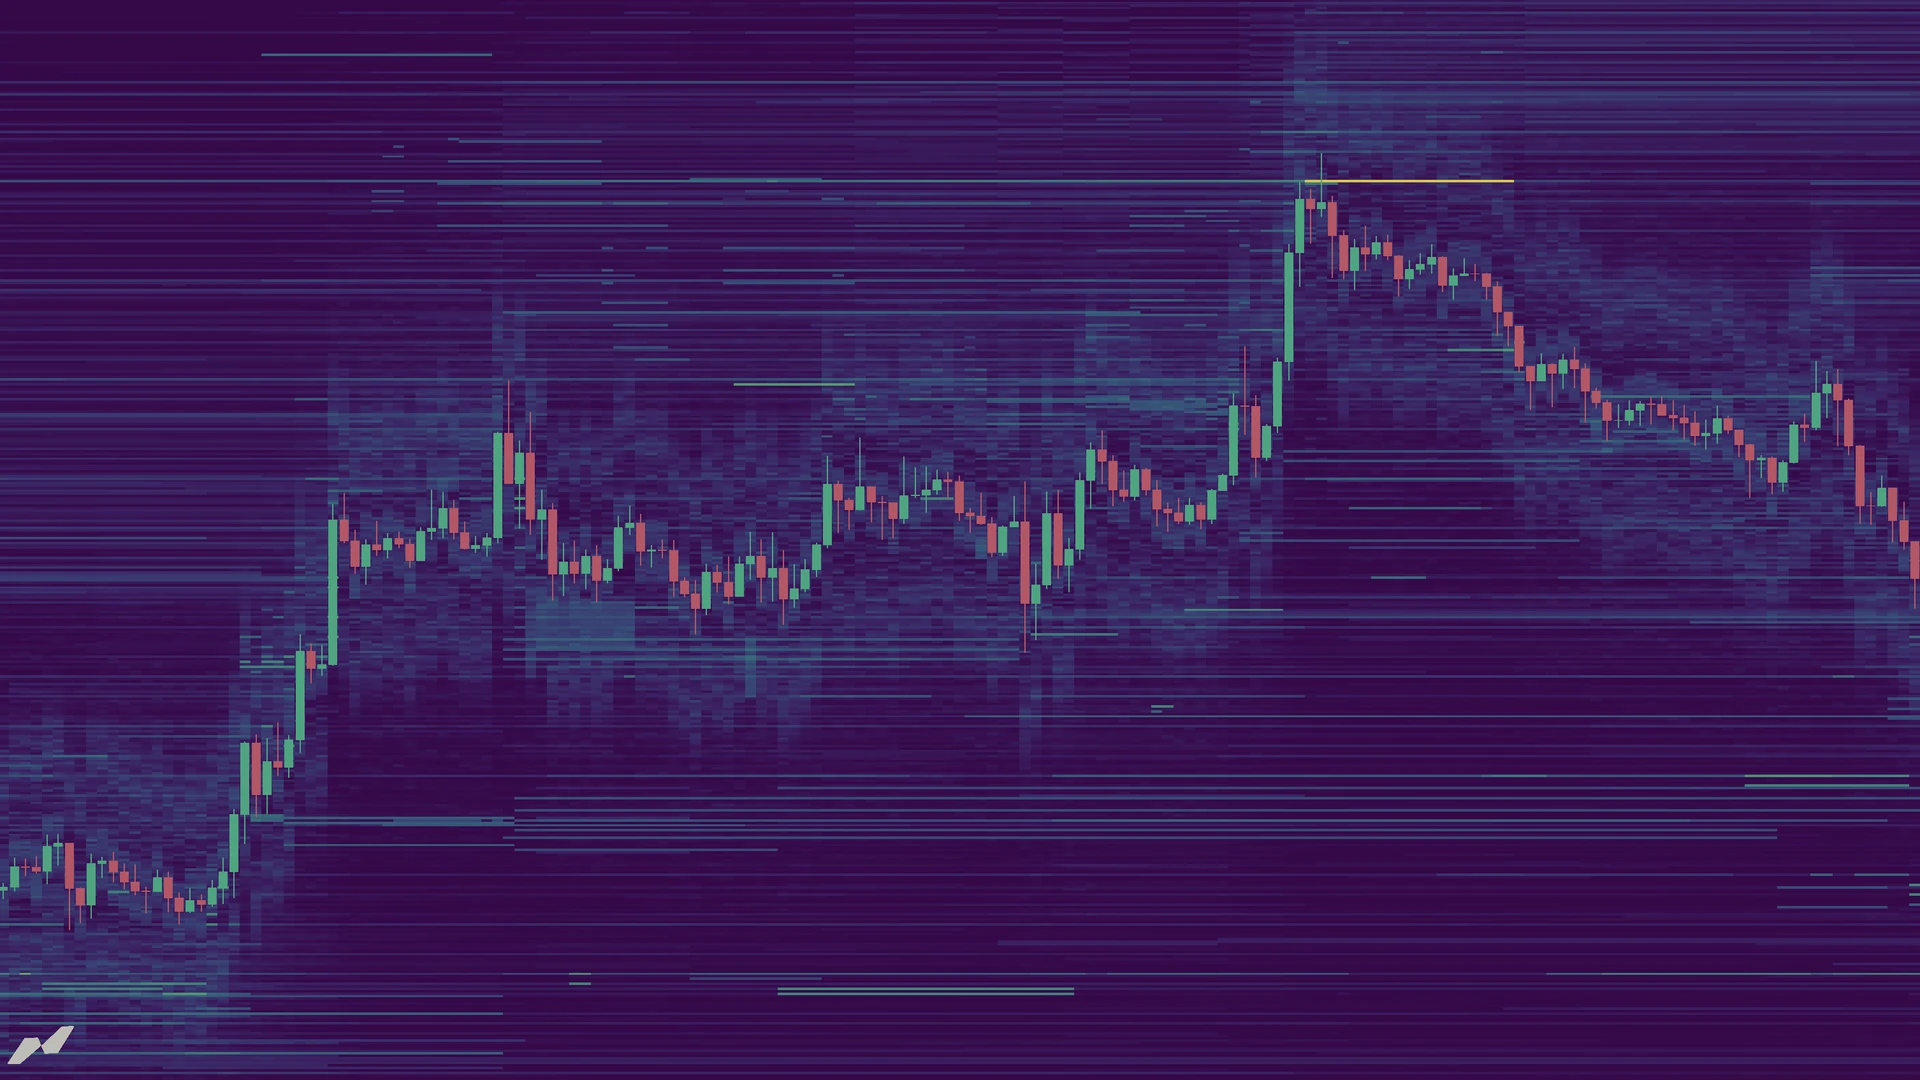
An order book heatmap is a chart that shows resting limit orders over time. Price runs up the chart and time across it, and the color of each cell shows how much size was resting at that price at that moment. Bright bands mark large concentrations of orders, dark areas mark a thin book.
Order flow
Volume
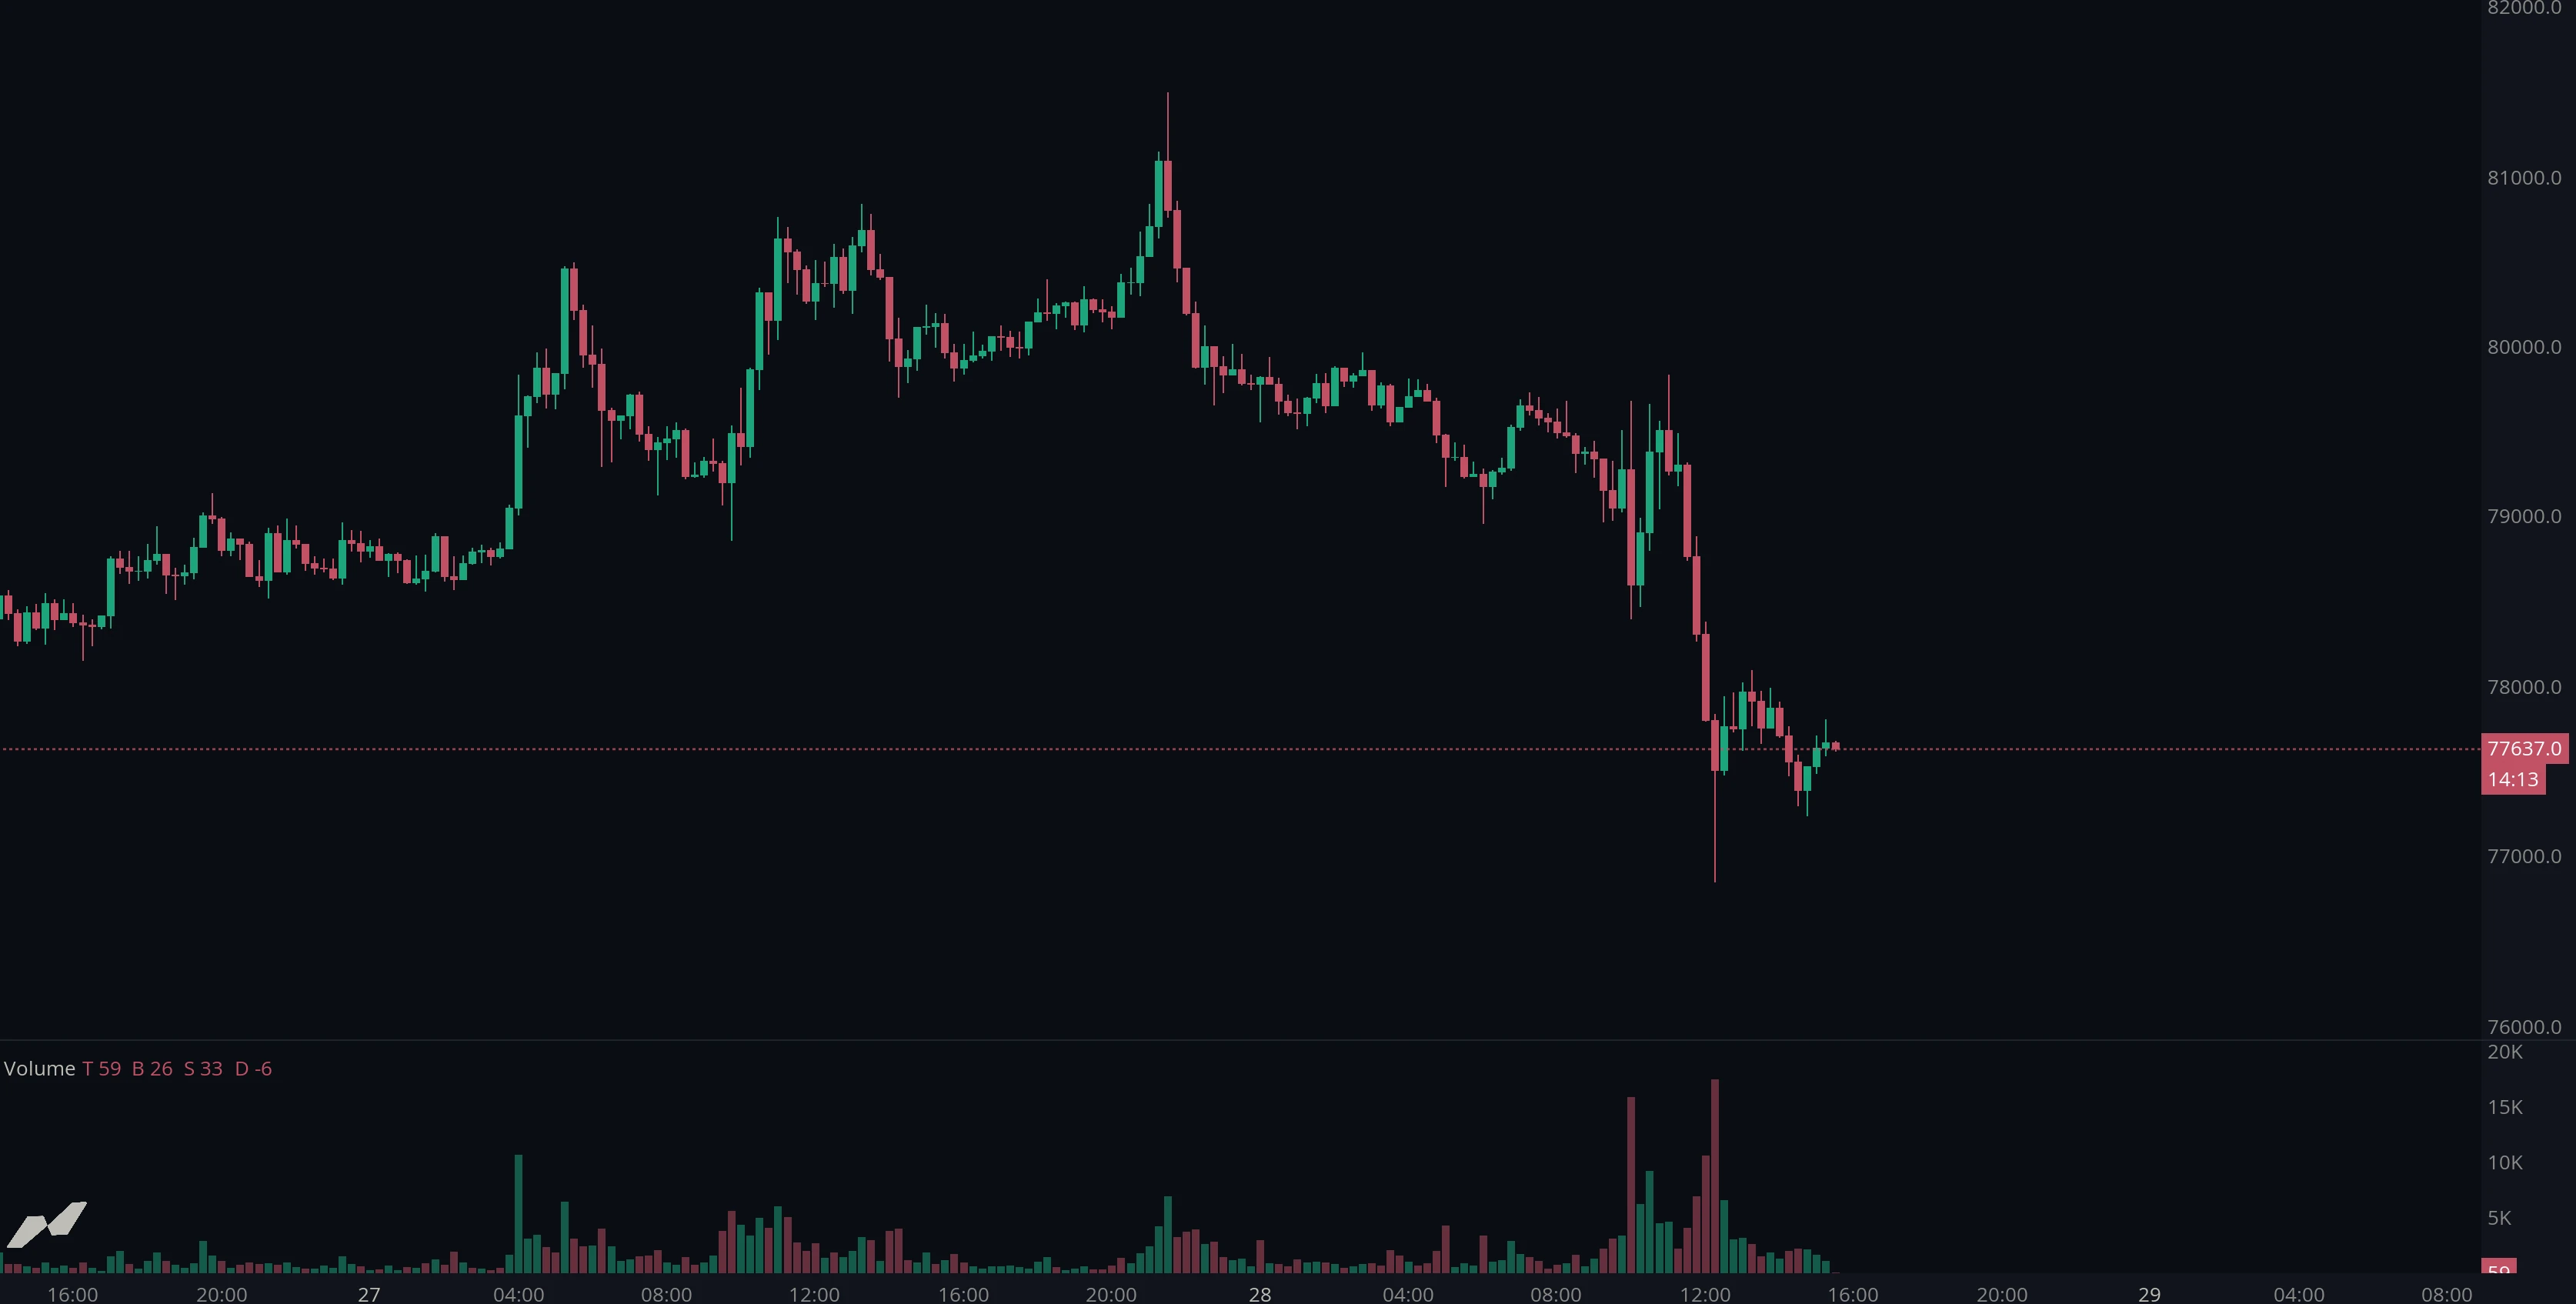
Trading volume is the total amount of an asset that changed hands during a given period. On a chart it is drawn as a histogram beneath price, with one bar per candle: the taller the bar, the more was traded while that candle formed.
Derivatives
Open interest
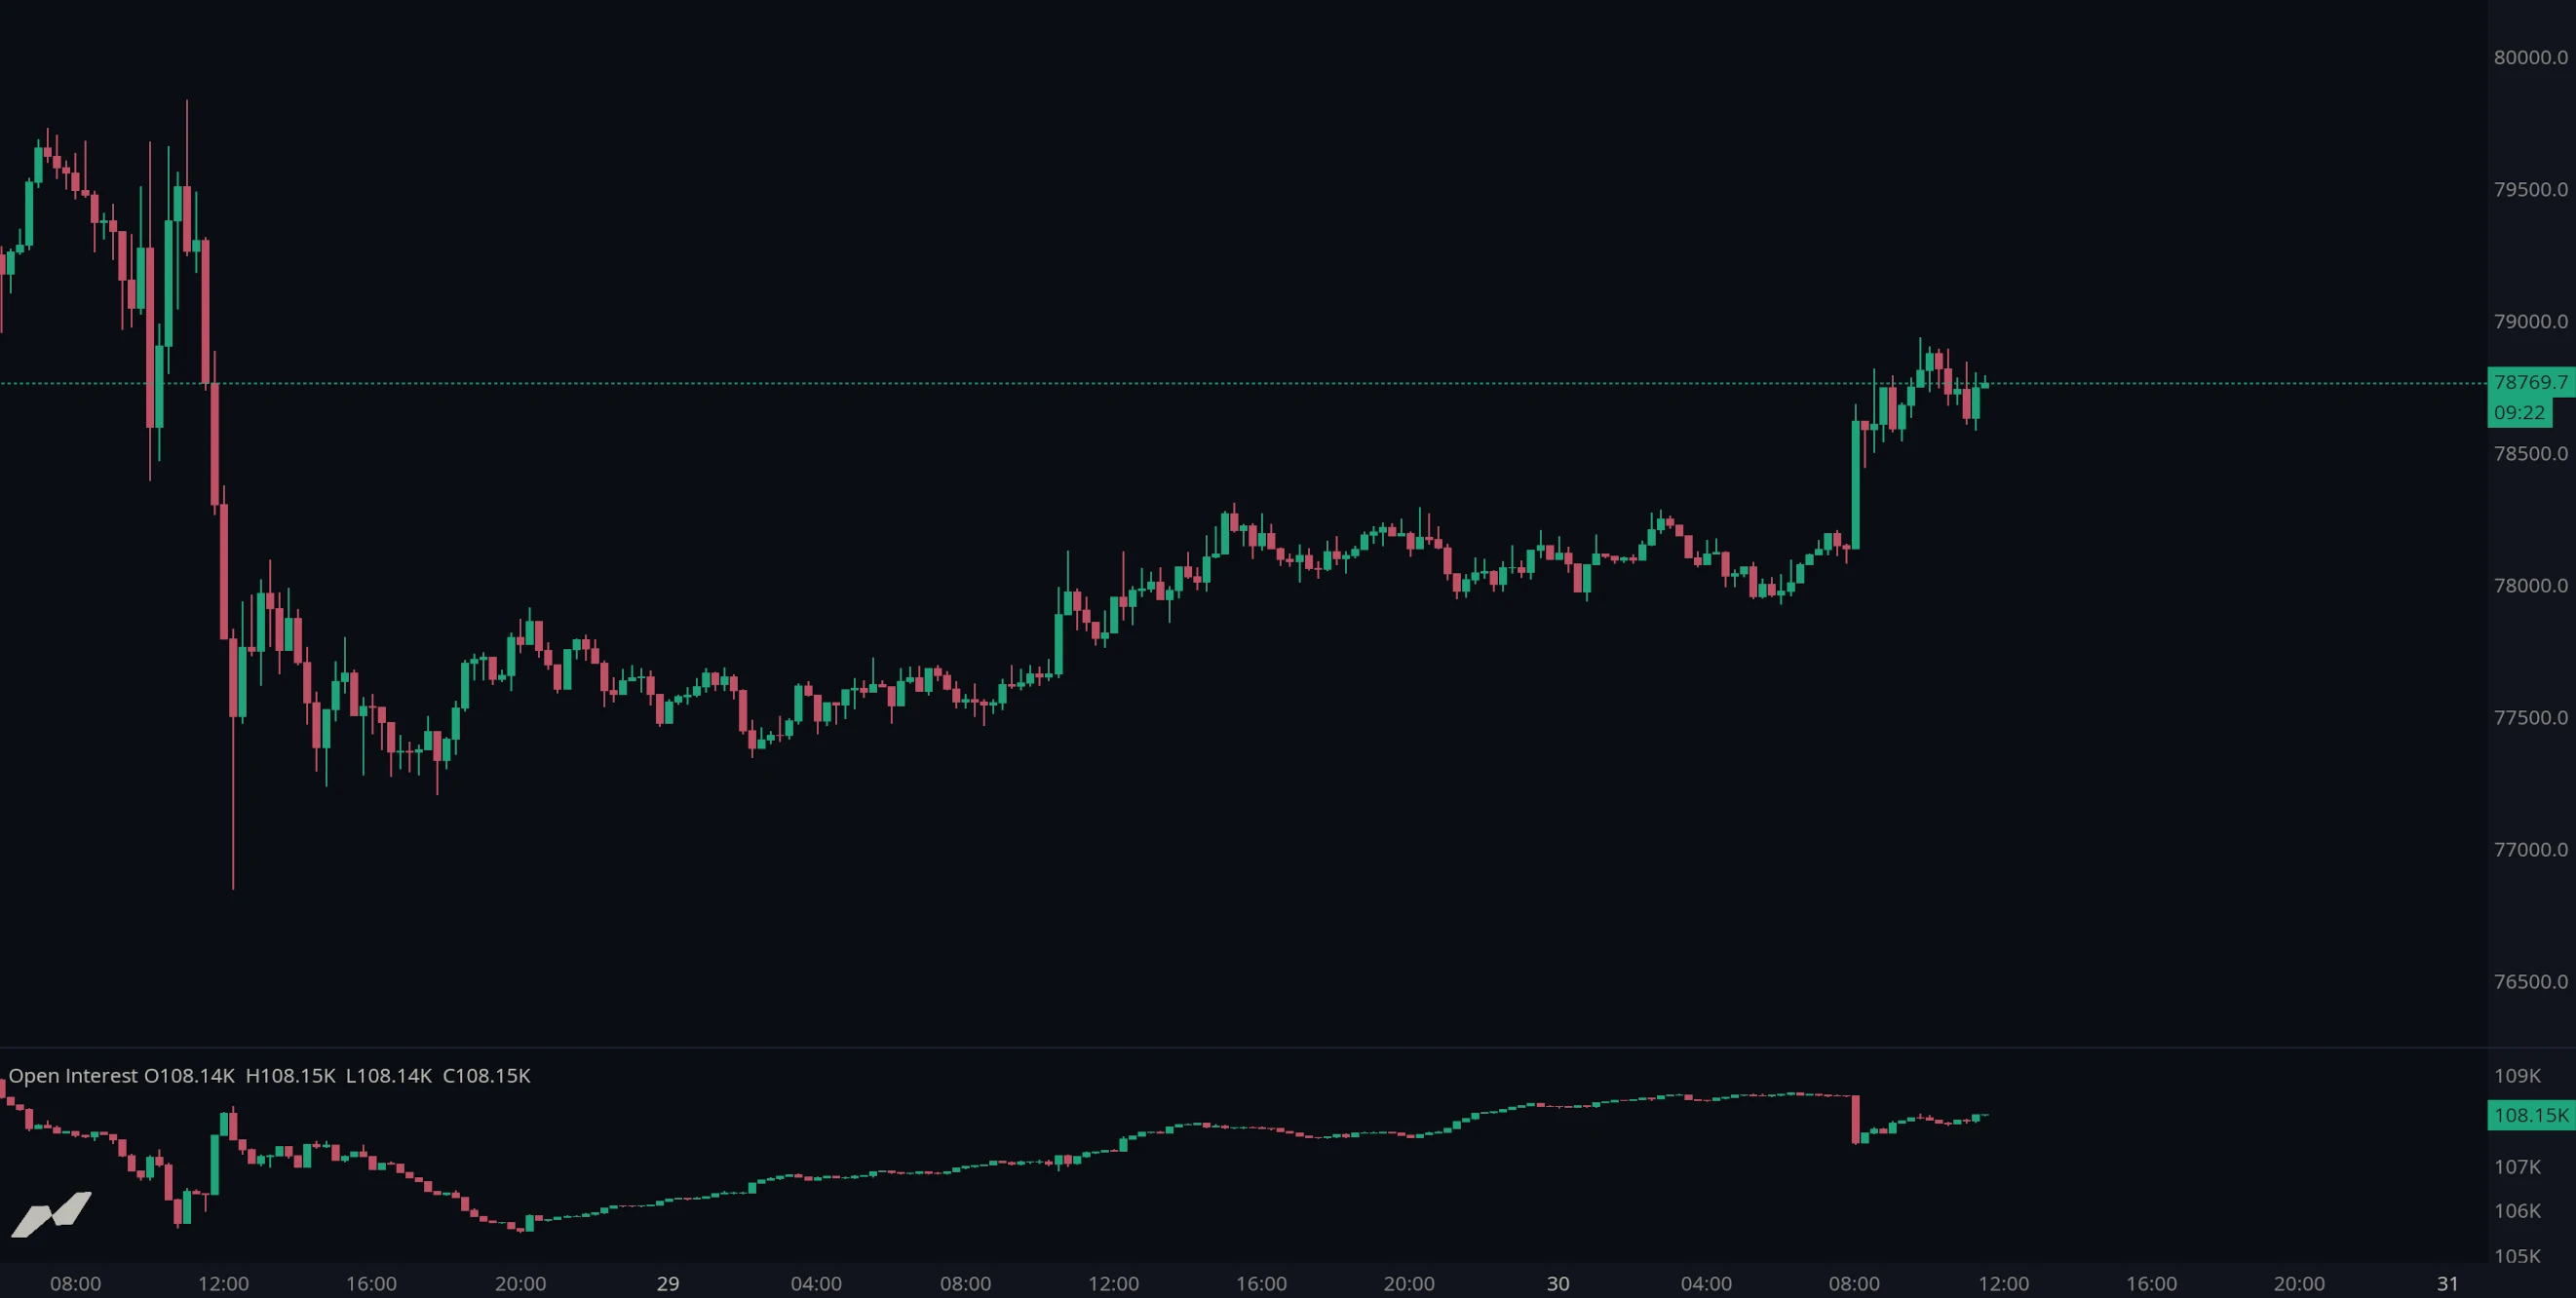
Open interest is the total number of derivative contracts that are currently open and have not yet been closed or settled. It rises when a new position is created and falls when one is closed, so it measures how much money is committed to a market rather than how much has changed hands.
Liquidity
Liquidation heatmap
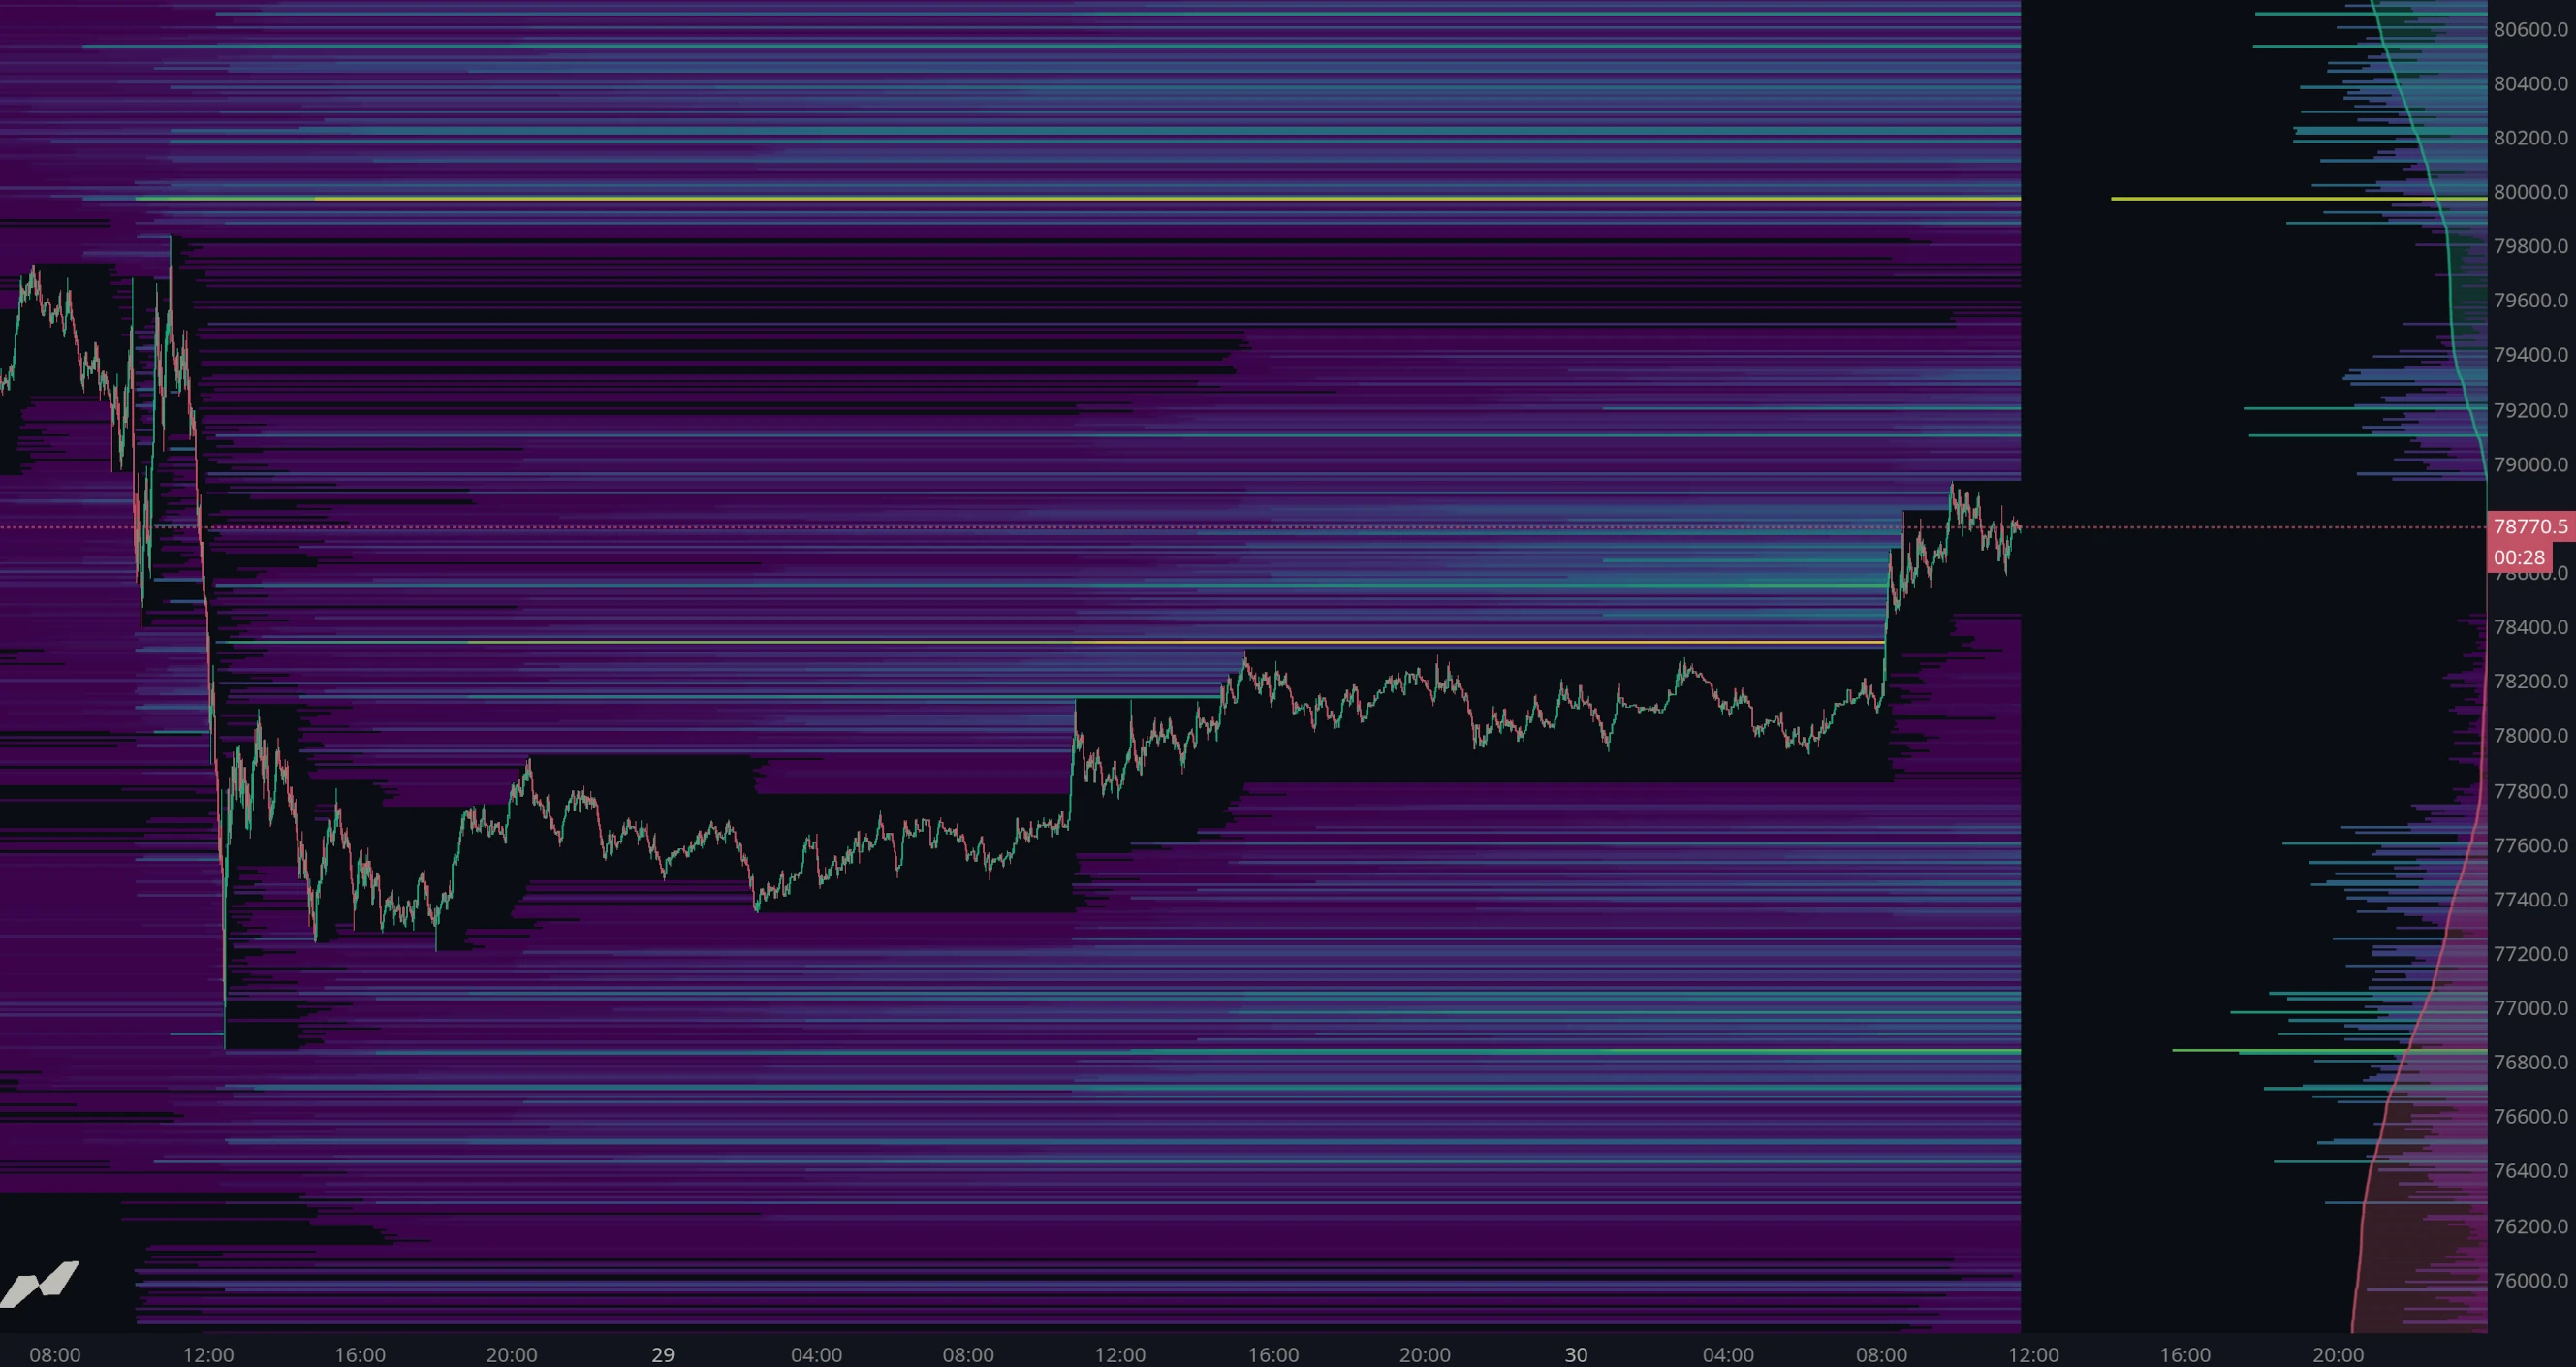
A liquidation heatmap estimates where leveraged positions would be forced to close, and plots those price levels as bands of color. Bright areas mark prices where a large amount of leverage is projected to be liquidated, so the chart shows where forced buying or selling is likely to occur.
Terminal workflows
The widgets and controls used to monitor markets, place orders, and keep the terminal responsive to what changes.
Order book
An order book is the list of every unfilled limit order in a market, arranged by price. Buy orders sit below the current price and sell orders above it, and the quantity waiting at each level shows how much would have to be traded for price to move through it.
Depth of market
Depth of market, or DOM, is a price ladder showing the resting buy and sell orders at each level alongside the trading that has happened there. It combines what is waiting with what has executed, in one column of prices, and is the standard interface for trading directly from the book.
Time and sales
Time and sales is a running list of every trade as it executes, newest first. Each line carries the price, the size and the time, colored by which side crossed the spread, so the raw stream of what is actually happening in a market can be read directly.
Live liquidations
A live liquidation feed is a running list of forced position closures as they happen, newest first. Each line carries the price the liquidation filled at, its size, the exchange it came from and the time, so forced selling and forced buying can be watched as it arrives rather than read off a chart afterward.
Watchlist
A watchlist is a saved list of markets a trader monitors together, each row showing its current price and how it has moved. It replaces checking instruments one at a time with a single view, so a change in one market can be spotted while attention is on another.
Order ticket
An order ticket is the panel a trader places orders from. It carries the order type, the price, the size and the side, and submits the instruction to the exchange. Everything about how a trade enters the market is decided here, before anything is sent.
Alerts
An order flow alert fires on what is happening inside the market rather than only on price. It watches a condition built from executed trades, resting liquidity or positioning, and notifies you when that condition is met, so activity that a price level alone would not reveal can be monitored unattended.
Order flow
Executed trades, buying and selling pressure, liquidations, and the tools that show what happened inside each candle.
Footprint charts
A footprint chart shows the trading that happened inside each candle, broken down by price. Instead of one bar summarizing a period, every price level within it displays how much was bought and sold there, so the buying and selling that produced the candle can be read directly.
Volume
Trading volume is the total amount of an asset that changed hands during a given period. On a chart it is drawn as a histogram beneath price, with one bar per candle: the taller the bar, the more was traded while that candle formed.
Trade counter
A trade counter measures how many individual trades executed during each candle, rather than how much size traded. It is added as a histogram indicator in its own panel below the price chart, usually splitting buys from sells, so the height reports the number of transactions rather than their combined value.
Liquidations
A liquidation is the forced closure of a leveraged position by the exchange, triggered when the trader's margin can no longer support it. A liquidations indicator plots those forced closures over time, separating long liquidations from short ones, so clusters of forced selling or buying become visible against price.
CVD
Cumulative Volume Delta (CVD) is a running total of aggressive buying minus aggressive selling. Each candle's delta, the difference between market buy volume and market sell volume, is added to the previous total, producing a line that rises while buyers are more aggressive and falls while sellers are.
Bar statistics
Bar statistics are the underlying numbers behind each candle on a chart: how much volume traded, how it split between buyers and sellers, how many trades made it up, what happened to open positions. Displayed as a grid aligned to the bars, they can be read directly rather than estimated from an indicator.
Volume delta
Volume delta is the difference between aggressive buying and aggressive selling in a period: market buy volume minus market sell volume. A positive delta means buyers crossed the spread for more size than sellers did, a negative delta the reverse. It measures which side was the aggressor, not which side was right.
Volume bubbles
Volume bubbles mark unusually heavy trading directly on the price chart, drawing a circle at the exact price it traded at. Often called big trades, the circles scale with size, so the largest events stand out at a glance without a separate panel, and each one marks a level rather than just a moment.
Tape reading
Tape reading is the practice of watching individual trades as they execute, rather than waiting for them to be summarized into candles. Each print carries a price, a size and the side that crossed the spread, and the pattern of those arrivals describes what a market is doing right now.
Liquidity
Resting orders, depth, modeled liquidation levels, and native Hyperliquid position maps.
Order book heatmap
An order book heatmap is a chart that shows resting limit orders over time. Price runs up the chart and time across it, and the color of each cell shows how much size was resting at that price at that moment. Bright bands mark large concentrations of orders, dark areas mark a thin book.
Order book depth
Order book depth is the quantity of limit orders resting at each price around the market. Imbalance is the difference between the two sides: how much is bid against how much is offered. A depth imbalance indicator tracks that difference over time, showing which side of the book is carrying more size.
Liquidation heatmap
A liquidation heatmap estimates where leveraged positions would be forced to close, and plots those price levels as bands of color. Bright areas mark prices where a large amount of leverage is projected to be liquidated, so the chart shows where forced buying or selling is likely to occur.
Order book profile
An order book profile totals the resting limit orders at each price and draws them as a horizontal histogram beside the chart. Long rows are prices holding a lot of size. It is a live picture of where liquidity is stacked in the book, updating as orders are placed and pulled.
Hyperliquid heatmaps
Liquidation, stop loss and take profit heatmaps show where open positions will be closed, plotted as bands of color at those prices. Liquidations mark forced exits, stop losses mark voluntary ones and take profits mark targets, so together they map every level where pending orders are waiting to fire.
Profiles & price
Candles, volume profiles, TPO, and VWAP for reading acceptance, rejection, and session structure.
TPO market profile
A TPO (Time Price Opportunity) market profile is a chart that shows how long a market traded at each price during a session. Time is divided into equal periods, and every price touched in a period is recorded, building a horizontal distribution in which the longest rows mark the prices the market accepted most.
Candlestick charts
A candlestick chart shows price movement over time as a series of candles. Each candle summarises one period of trading with four values: the open, the high, the low and the close. Its body spans the open and close, and thin wicks extend to the extremes reached in between.
VPVR
VPVR (Volume Profile Visible Range) is a chart tool that shows how much volume traded at each price level across whatever part of the chart is currently on screen. It draws a horizontal histogram beside price, where the longest rows mark the prices that saw the most trading activity.
VWAP
VWAP (Volume Weighted Average Price) is the average price a market has traded at over a period, weighted by volume. Prices where more volume traded count for more, so the line tracks where the bulk of business was actually done rather than the midpoint of the range.
VPSV
VPSV (Volume Profile Session Volume) draws one volume profile for each trading session. Every session gets its own horizontal histogram showing how much volume traded at each price during that period, so sessions can be compared with one another rather than blended into a single distribution.
Derivatives
Open interest, funding, positioning, and venue-specific data for tracking leveraged markets.
Open interest
Open interest is the total number of derivative contracts that are currently open and have not yet been closed or settled. It rises when a new position is created and falls when one is closed, so it measures how much money is committed to a market rather than how much has changed hands.
Net positioning
Net positioning tracks how much of a market's trading actually created or closed positions rather than passing existing ones between traders. It separates new longs and new shorts from position transfer, producing two running series that show which side has been building exposure and which has been unwinding it.
Funding rate
A funding rate is a periodic payment between the long and short holders of a perpetual futures contract. When the rate is positive longs pay shorts; when it is negative shorts pay longs. It exists to keep the perpetual's price tethered to spot, since the contract never expires to settle the difference.
Hyperliquid footprint
Open interest at price shows where positions were opened and closed within a candle, level by level, instead of as one figure for the whole bar. Combined with net long and net short data at the same granularity, it shows not just that positioning changed but at exactly which price.