What is an order book profile?
By MichaelUpdated August 26, 2026
An order book profile totals the resting limit orders at each price and draws them as a horizontal histogram beside the chart. Long rows are prices holding a lot of size. It is a live picture of where liquidity is stacked in the book, updating as orders are placed and pulled.
How does an order book profile work?
An order book is a list: every unfilled limit order, at every price, on both sides of the market. Read raw it is unmanageable, because the interesting structure is spread across hundreds of individual price levels.
A profile compresses it. The price range is divided into rows, the resting size at every price inside a row is added together, and the total is drawn as a bar extending from the price axis. Prices holding a lot of size produce long bars; prices holding little produce short ones.
Because the book changes continuously, the profile is a live picture rather than a record. Orders appear, get filled, get canceled, and the shape redraws. What you are looking at is the market’s current standing intent, not anything that has already happened.
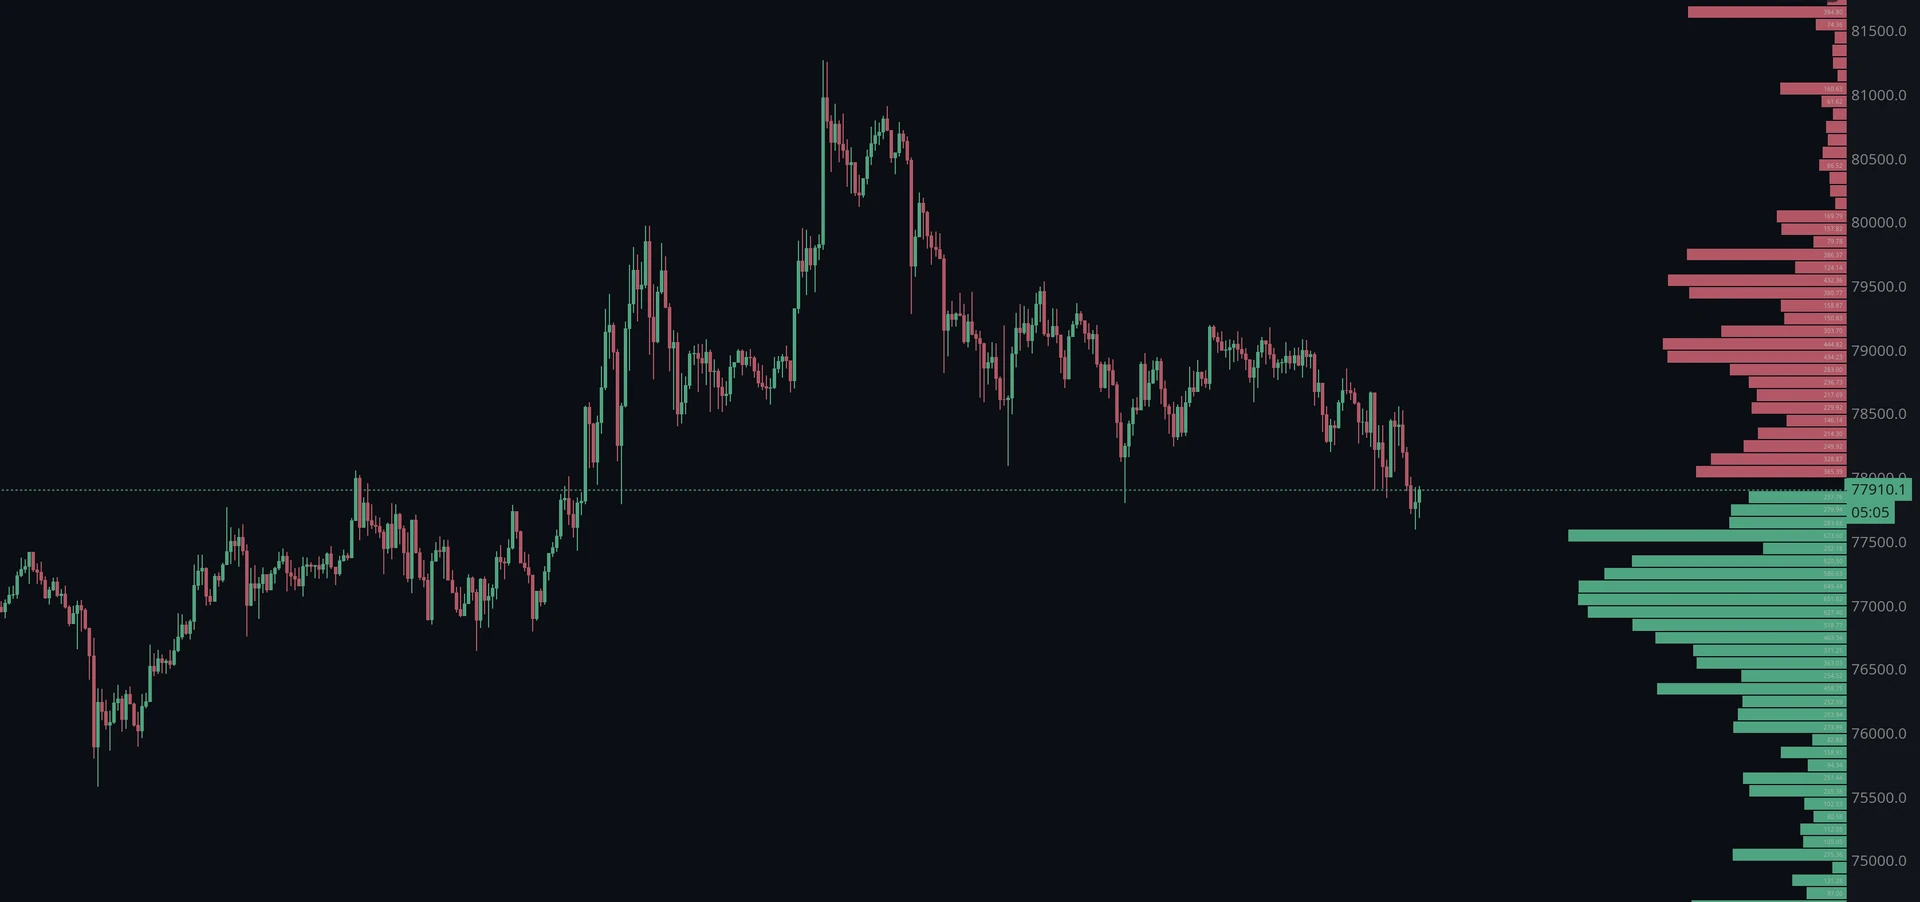
The two sides are drawn together and separate naturally, because bids can only sit below the current price and asks can only sit above it. That gives the profile a distinctive shape: one color running down from the market and the other running up, meeting at the spread.
How do you read an order book profile?
Start with the long rows. A bar that is much longer than its neighbors is a wall: a price where a large amount of size is waiting. If it sits above the market it is offers, and price has to consume them to get through. If it sits below, it is bids that would have to be filled before price could fall past.
Then look at the gaps. Short rows are thin liquidity, and thin liquidity is where price moves fastest, because there is very little to trade against. A large wall with a gap just beyond it is a specific setup: hard to reach, then fast once passed.
The comparison between the two sides matters as much as either alone. A profile with heavy bids stacked beneath the market and a thin, scattered ask side describes a book that is far better supported below than it is capped above. That is a different market from one where both sides are evenly matched, even if price is behaving identically.
The one habit worth building is watching how the shape changes rather than reading it once. A wall that has stood through several tests is meaningful. A wall that appears the moment price approaches and vanishes before it arrives never existed in any useful sense.
How is an order book profile different from a volume profile?
They look almost identical and mean opposite things, which is the most common confusion around this tool.
A volume profile is built from executed trades. It shows where business was actually done, so it describes the past and it cannot change once the period has passed.
An order book profile is built from unfilled orders. It shows what participants say they are willing to do, so it describes the future and it can change entirely in a second.
That difference decides how much weight each deserves. A volume profile’s point of control is a fact about what happened. An order book profile’s largest row is a statement of intent that may be withdrawn before it is tested. The first is evidence; the second is a forecast.
Used together they answer different halves of the same question. The volume profile shows the levels the market has already agreed on, and the order book profile shows what is currently waiting at them.
How does it compare with the other order book tools?
Three tools read the same book and differ in what they hold fixed.
An order book profile shows depth against price, right now. It answers where size is sitting.
An order book heatmap shows depth against price and time, as color. It answers how the size at a level has behaved: whether it has been sitting there, refilling, or was pulled.
An order book depth imbalance shows the balance between the two sides against time, as a single figure per bar. It answers which side has been heavier and when that changed.
The profile is the one to reach for when you have a level in mind and want to know what is currently defending it.
What are the limits of an order book profile?
It is a snapshot. The profile describes the book as it stands. It carries no history, so a level that has been defended all day looks exactly like one that appeared a moment ago.
Resting orders are not commitments. Any limit order can be canceled before it fills. A wall shows what someone has stated, not what they will do.
Spoofing exists. Size placed with no intent to be filled, purely to shape how the book looks, is common in unregulated markets. A wall that retreats as price approaches was never real.
It is venue-specific. Each exchange publishes only its own book, so a single venue’s profile can look nothing like the aggregate.
It says nothing about aggression. The profile is entirely passive. To see who is actually crossing the spread you need volume delta or CVD.
Related: Order book heatmap · Order book imbalance · VPVR · Volume delta
Using OB Profile in MMT
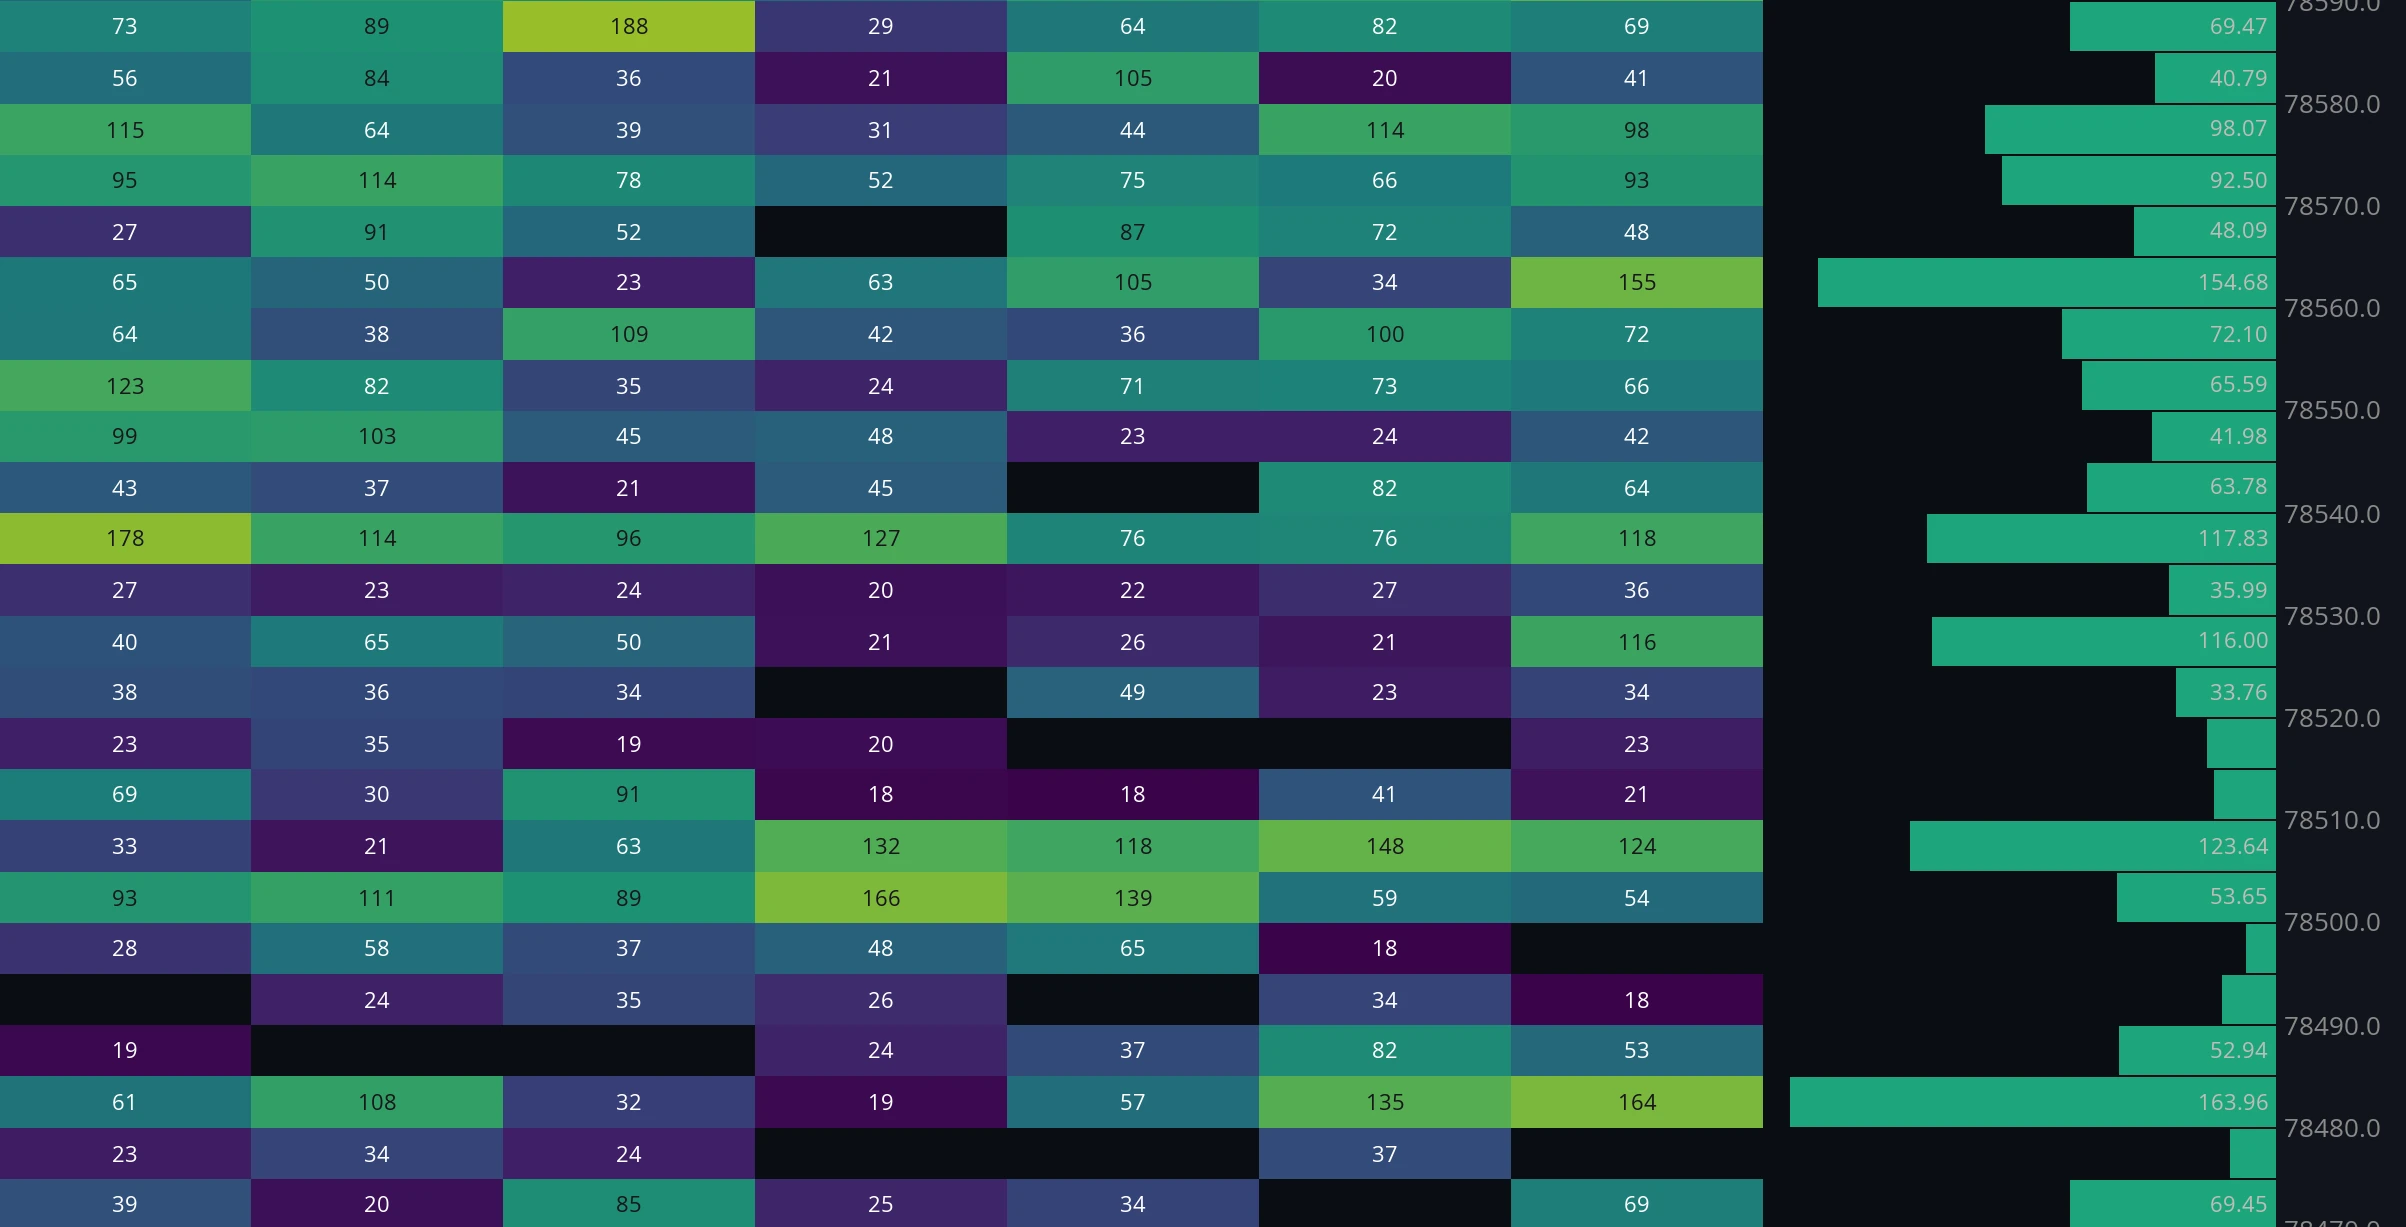
MMT’s OB Profile draws the live book as a horizontal profile against the price axis, bids in the up color and asks in the down color, with each row’s size printed inside it. Row height, width and coloring are configurable, and the book can be pooled across exchanges.
How do you add OB Profile to a chart?
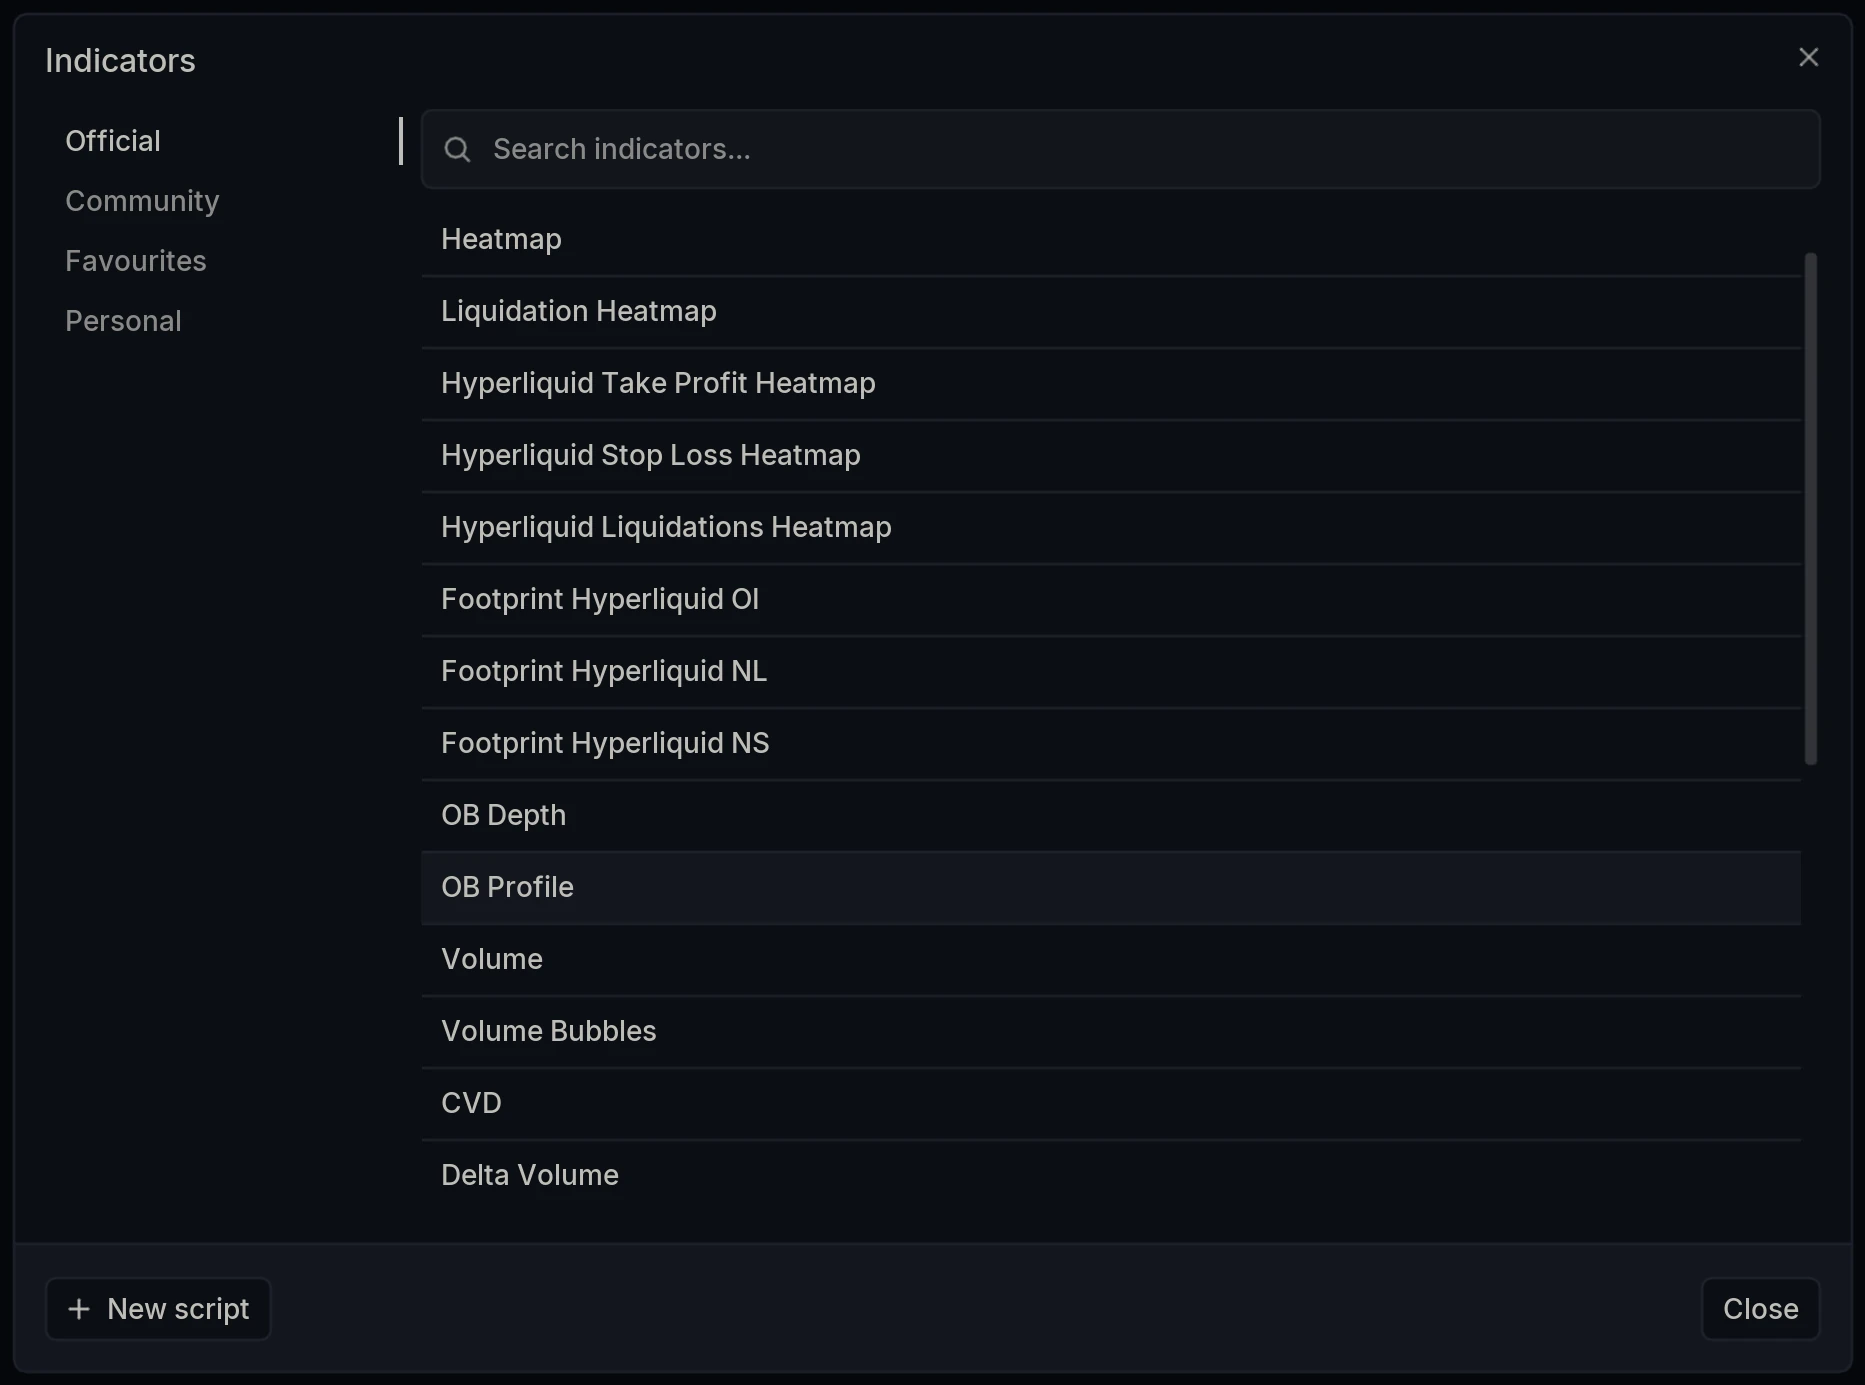
Open the Indicators dialog and select OB Profile under Official.
How do you set the row height?
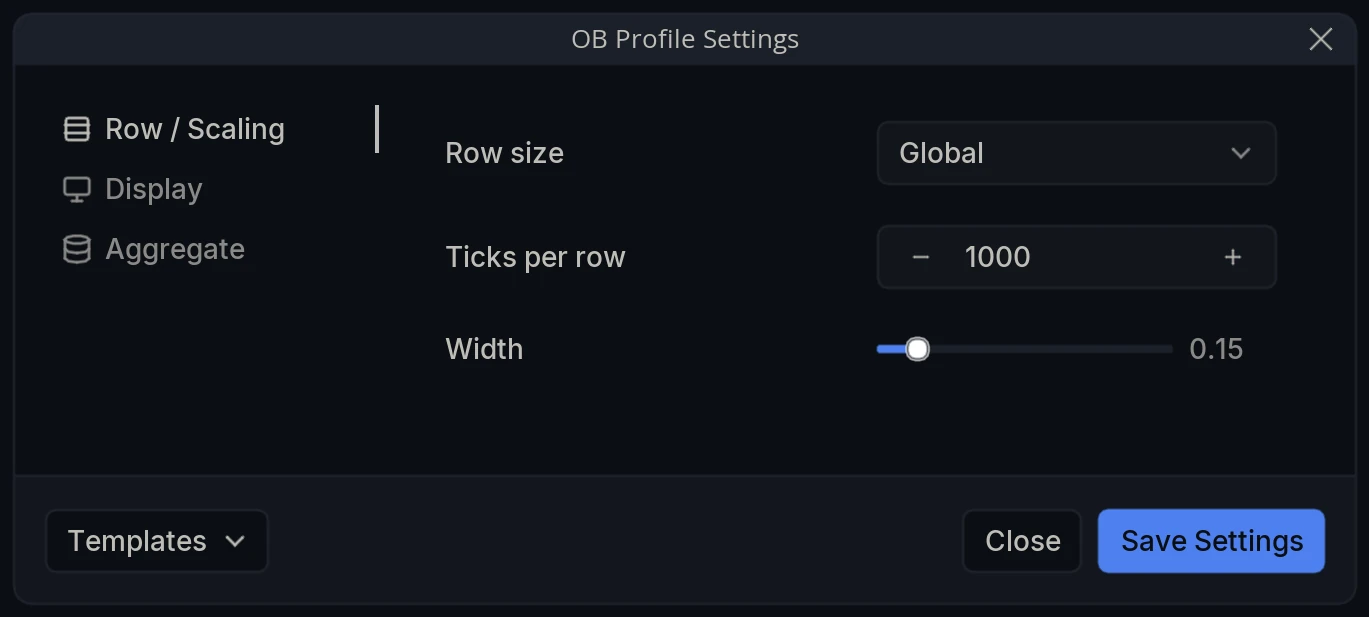
Row size decides how the price range is divided: Auto, Global or Custom.
Auto sizes the rows for you. Global uses the shared per-pair value that other row-based layers in global mode also use, set in the Ticks per row dialog. Custom takes the Ticks per row figure in this panel.
Row height is the setting that changes the reading most. Tall rows aggregate heavily and show broad areas of liquidity; short rows resolve individual price levels and show the walls themselves. Neither is correct, and the useful habit is to change it deliberately rather than leave it wherever it happened to be.
What do the display options do?
Show values prints each row’s size inside the bar, which is on by default and is what makes the profile readable as figures rather than only as shapes. Grade colors shades each row by its size so the heaviest render most strongly, in the same way color grading works on the volume profile layers.
Layer Settings
Open OB Profile Settings via the cog wheel on the layer name. The panel has three tabs: Row / Scaling, Display and Aggregate.
Row / Scaling
Row size - How row height is decided: Auto sizes it for you, Global uses the shared per-pair value, and Custom uses the figure below.
Ticks per row - The number of ticks each row covers, active when Row size is set to Custom.
Width - How far the profile extends across the chart, as a fraction of the available width. 0.15 by default.
Display
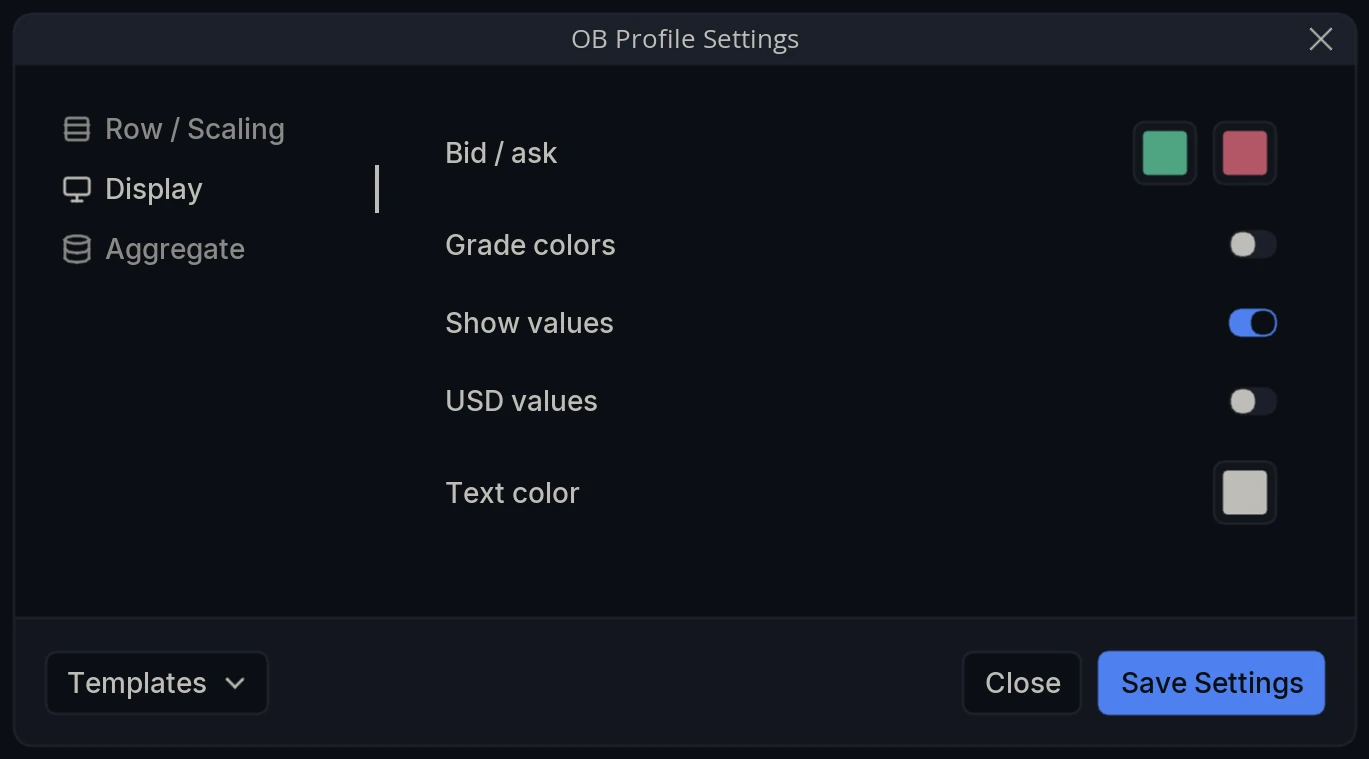
Bid / ask - The two colors used for the two sides.
Grade colors - Shade each row by its size so the largest render most strongly.
Show values - Print each row’s size inside the row.
USD values - Report those figures in USD rather than in units of the base asset.
Text color - Color of the printed values.
Aggregate
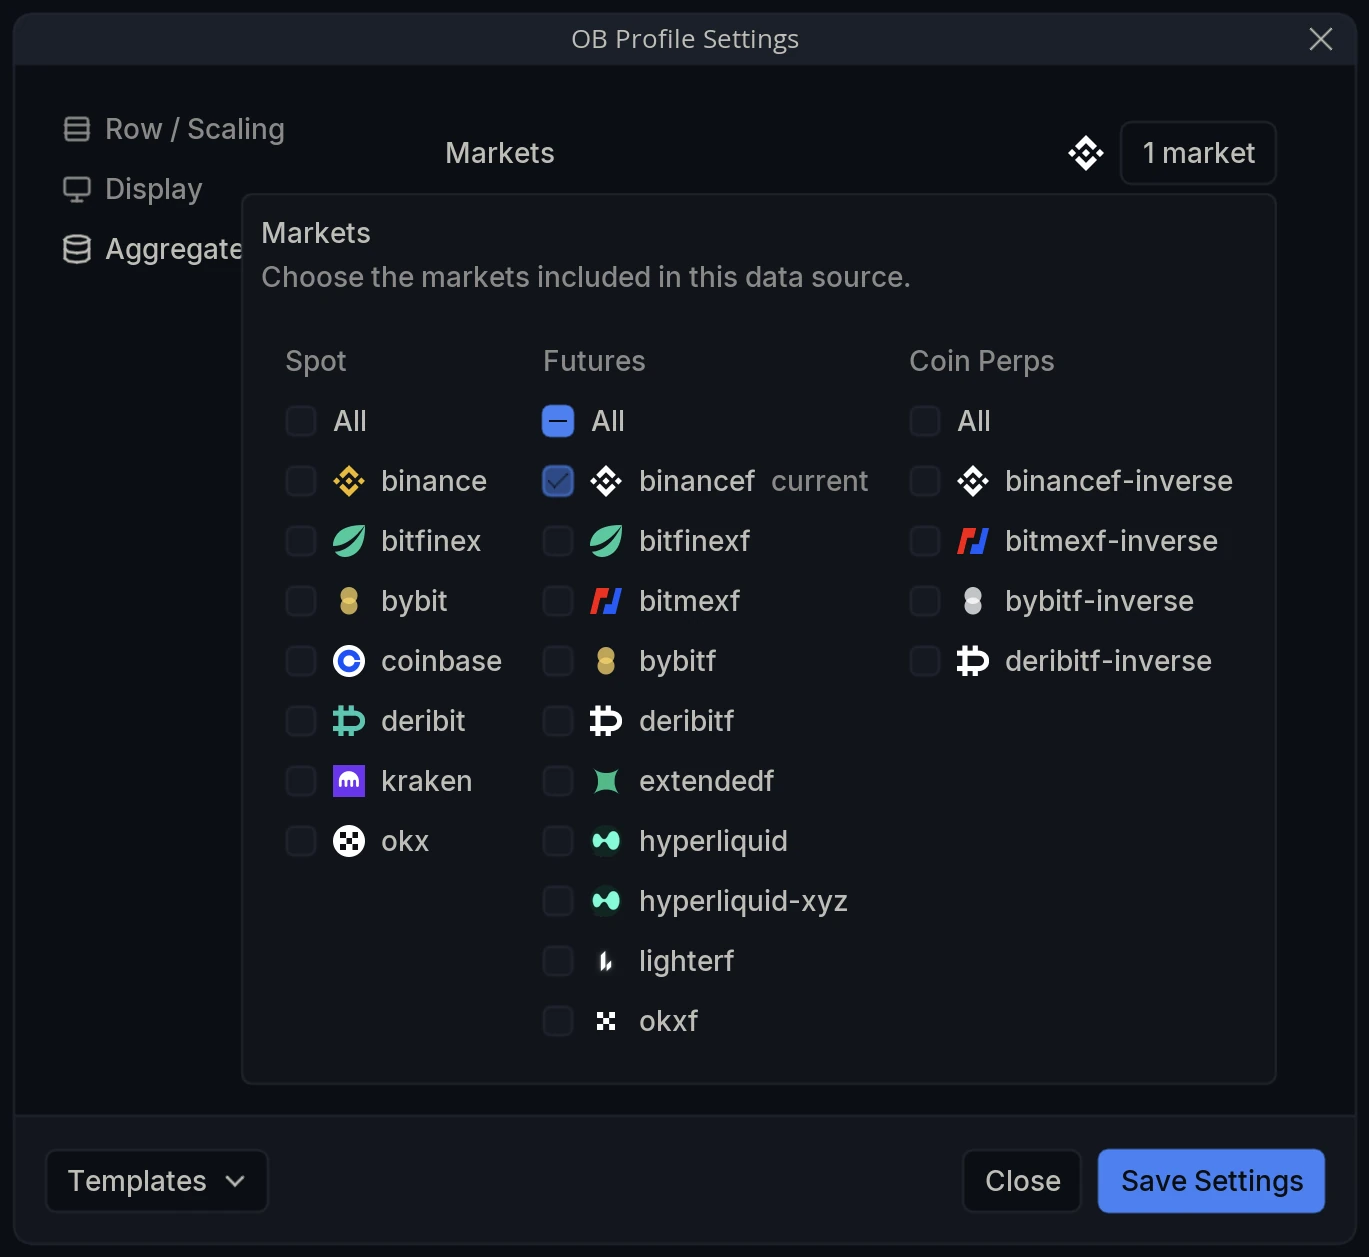
Markets - Choose the markets whose books are included. The selector is grouped into Spot, Futures and Coin Perps, with an All toggle per group; your chart’s own market is tagged current.
Pooling venues gives a much better answer to where liquidity actually sits, since a wall on one exchange is a far weaker level than the same size spread across several.