What are volume bubbles?
By MichaelUpdated August 26, 2026
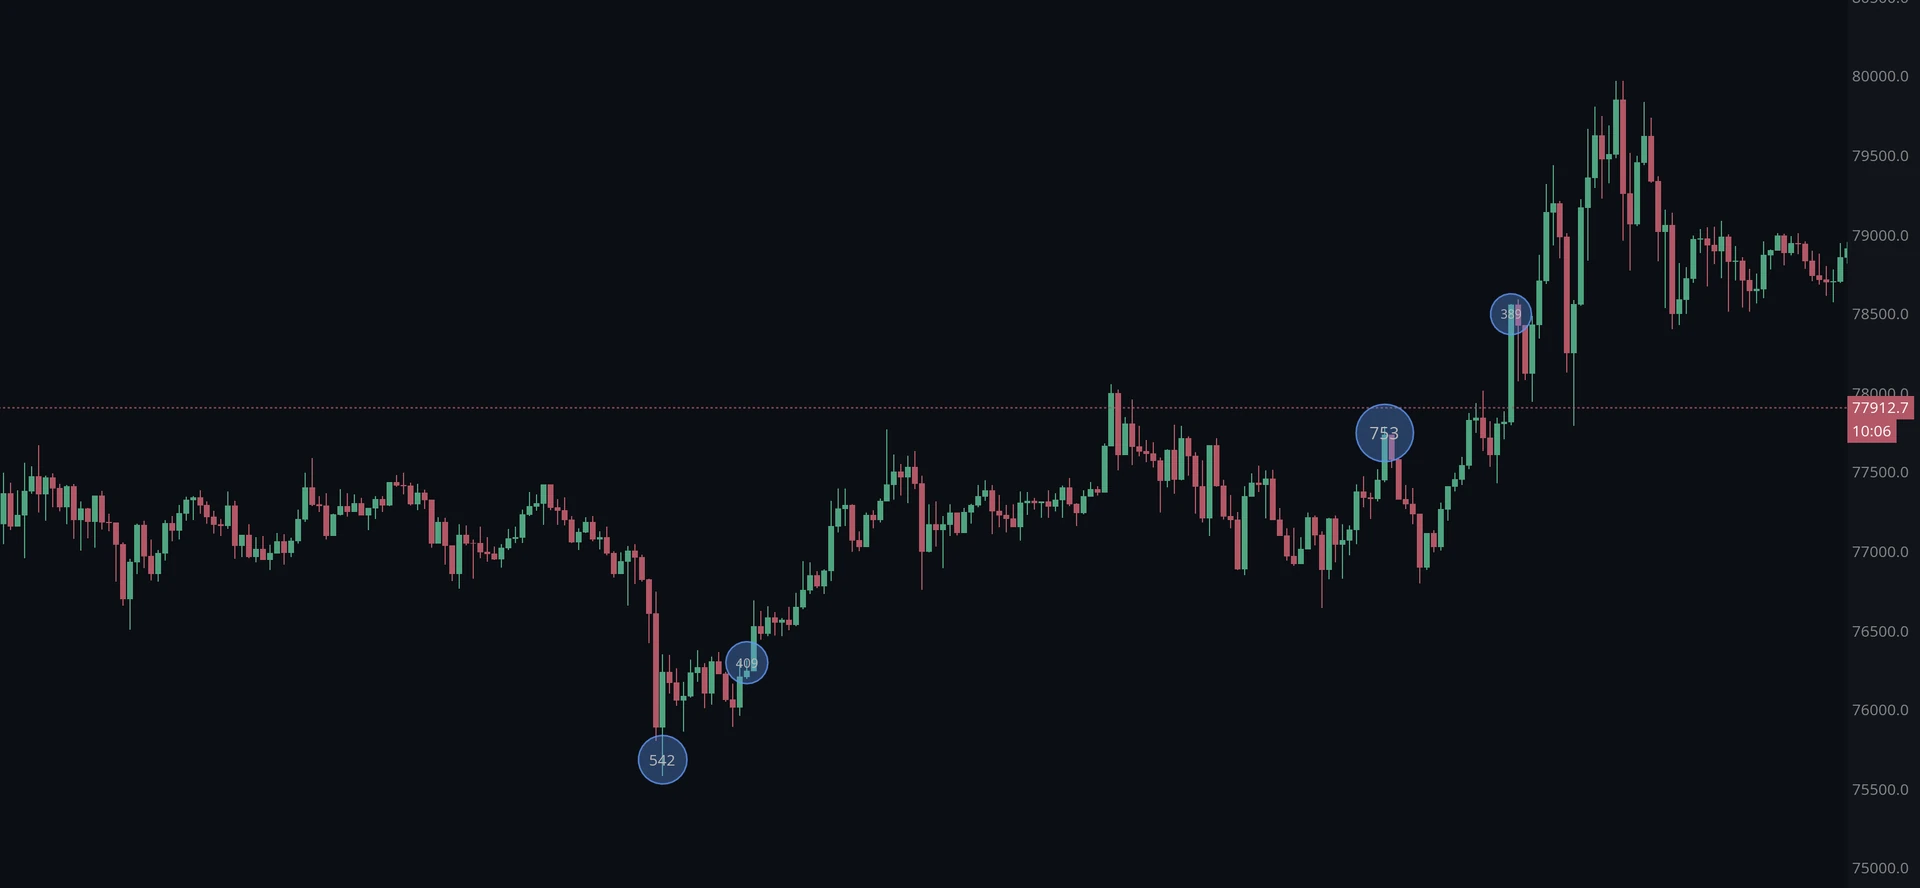
Volume bubbles mark unusually heavy trading directly on the price chart, drawing a circle at the exact price it traded at. Often called big trades, the circles scale with size, so the largest events stand out at a glance without a separate panel, and each one marks a level rather than just a moment.
How do volume bubbles work?
Volume is normally drawn as a histogram in a panel of its own, one bar per candle, beneath the price chart. That works, and it has one persistent drawback: the volume is separated from the price it belongs to. You see a tall bar, you trace up to the chart above, and you work out what price was doing.
Bubbles remove that step, and they are more precise than the histogram they replace. Trading is measured at each price inside a candle, and when the amount at one of those prices clears a threshold, a circle is drawn there. The bubble does not sit on the candle in general; it sits at the price level where the heavy trading actually occurred, which may be anywhere between the bar’s high and its low.
That precision is the point. A tall histogram bar tells you a lot traded during a bar that spanned a wide range. A bubble tells you which price inside that range absorbed it.
Not everything gets marked. The threshold is measured against the busiest activity in a chosen window, so setting it low marks a great deal and setting it high leaves only genuine outliers. That filtering keeps the chart readable and makes the tool a spotter for events rather than a continuous readout.
Why put volume on the price chart?
Because the useful question about a volume spike is usually where, not when.
A histogram answers when. It tells you that a great deal traded at a particular moment, and that is genuinely useful for judging whether a move had participation behind it.
A bubble answers when and where at the same time. It marks the price at which the heavy trading occurred, which is what turns a volume event into something you can act on. A large circle sitting at the low of a sharp drop marks the exact price where a lot of business was done in a hurry. That price becomes a level worth watching, and you learned it without leaving the chart.
This is the tool other platforms usually call big trades. The name describes what it surfaces, and the principle is the same: find the outsized activity and put it where it happened.
The trade-off is that bubbles are selective by design. A histogram shows every bar; bubbles show only the ones that clear the threshold. They are not a replacement for a volume panel, they are a different question asked of the same data.
How do you read volume bubbles?
Read the size first, then the location.
Size is the magnitude relative to the window you are scaling against. A circle much larger than its neighbors is an outlier for that period, not necessarily in absolute terms, which is why the scaling window matters as much as the bubble.
Location is what the tool adds. A bubble at a swing high or low marks the price where heavy trading coincided with an extreme, and those prices frequently matter again later. A bubble in the middle of a range is less interesting: a lot traded, but nothing was decided.
Clusters are the strongest reading. Several large bubbles at similar prices across different times mark a level the market has repeatedly done business at, which is the same conclusion a volume profile reaches by a different route, arrived at faster and without changing chart layout.
The one thing bubbles will not tell you is who was trading. Heavy volume is heavy volume, whether it was buyers lifting offers or sellers hitting bids, which is why the delta view exists.
What does a delta view add?
Volume counts everything that traded. Delta separates it into aggressive buying and aggressive selling, and shows the difference.
Switching bubbles to delta changes the question from “how much traded here” to “which side was doing the taking here”. A large bubble in the buy color marks a price where aggressive buyers dominated; the sell color marks the reverse. The size still reflects magnitude, but now the color carries direction.
That matters at the extremes. A huge volume bubble at a low tells you the market was busy there. A huge sell delta bubble at the same low tells you sellers were the aggressors into it, and if price turned anyway, someone was absorbing them. The second reading is considerably more specific than the first.
Volume delta covers the underlying measurement in full.
What happened to the positions behind a bubble?
A bubble tells you a great deal traded at a price. It does not tell you what that trading did, and that is the question worth asking next.
Heavy volume can mean two opposite things. It can be positions being opened, which leaves the market holding more exposure than before. Or it can be positions being closed, which leaves it holding less. Both look identical on a volume bubble, and they resolve very differently.
Open interest settles it. If open interest rose across the bar the bubble marks, that volume created positions; if it fell, the volume closed them. A large bubble at a low with open interest dropping through it is capitulation, positions being flushed out. The same bubble with open interest climbing is fresh money stepping in.
Net positioning takes it one step further by combining that open interest change with the direction of the flow, which tells you not just whether positions were opened but whose. A sell-delta bubble on rising open interest is new shorts; the same bubble on falling open interest is longs being closed out.
That pairing is the habit worth forming. The bubble finds the event and gives you the price. Open interest and net positioning tell you what the event actually was.
What are the limits of volume bubbles?
They are relative, not absolute. Both the sizing and the threshold measure against a window. Change the window and the same event can go from unremarkable to the biggest thing on screen. The reading is always “big for this period”.
They are selective. Anything below the threshold is invisible. That is the point, but it means the chart is not showing you all the volume, and a run of moderately heavy bars can matter without any of them qualifying.
They occupy the price chart. Every bubble is drawn over the candles. Set the threshold too low or the size too large and the tool obscures the thing it is meant to annotate.
Volume is venue-specific. One exchange’s volume is one exchange’s activity. Aggregating across venues gives a better sense of what actually traded.
Related: Volume · Volume delta · Open interest · Net positioning · VPVR
Using Volume Bubbles in MMT
MMT’s Volume Bubbles draws circles on the price chart wherever activity at a price clears a threshold, sized by volume or by delta, with the figure printed inside each one. What counts as large is set by a scaling window you choose.
How do you add Volume Bubbles to a chart?
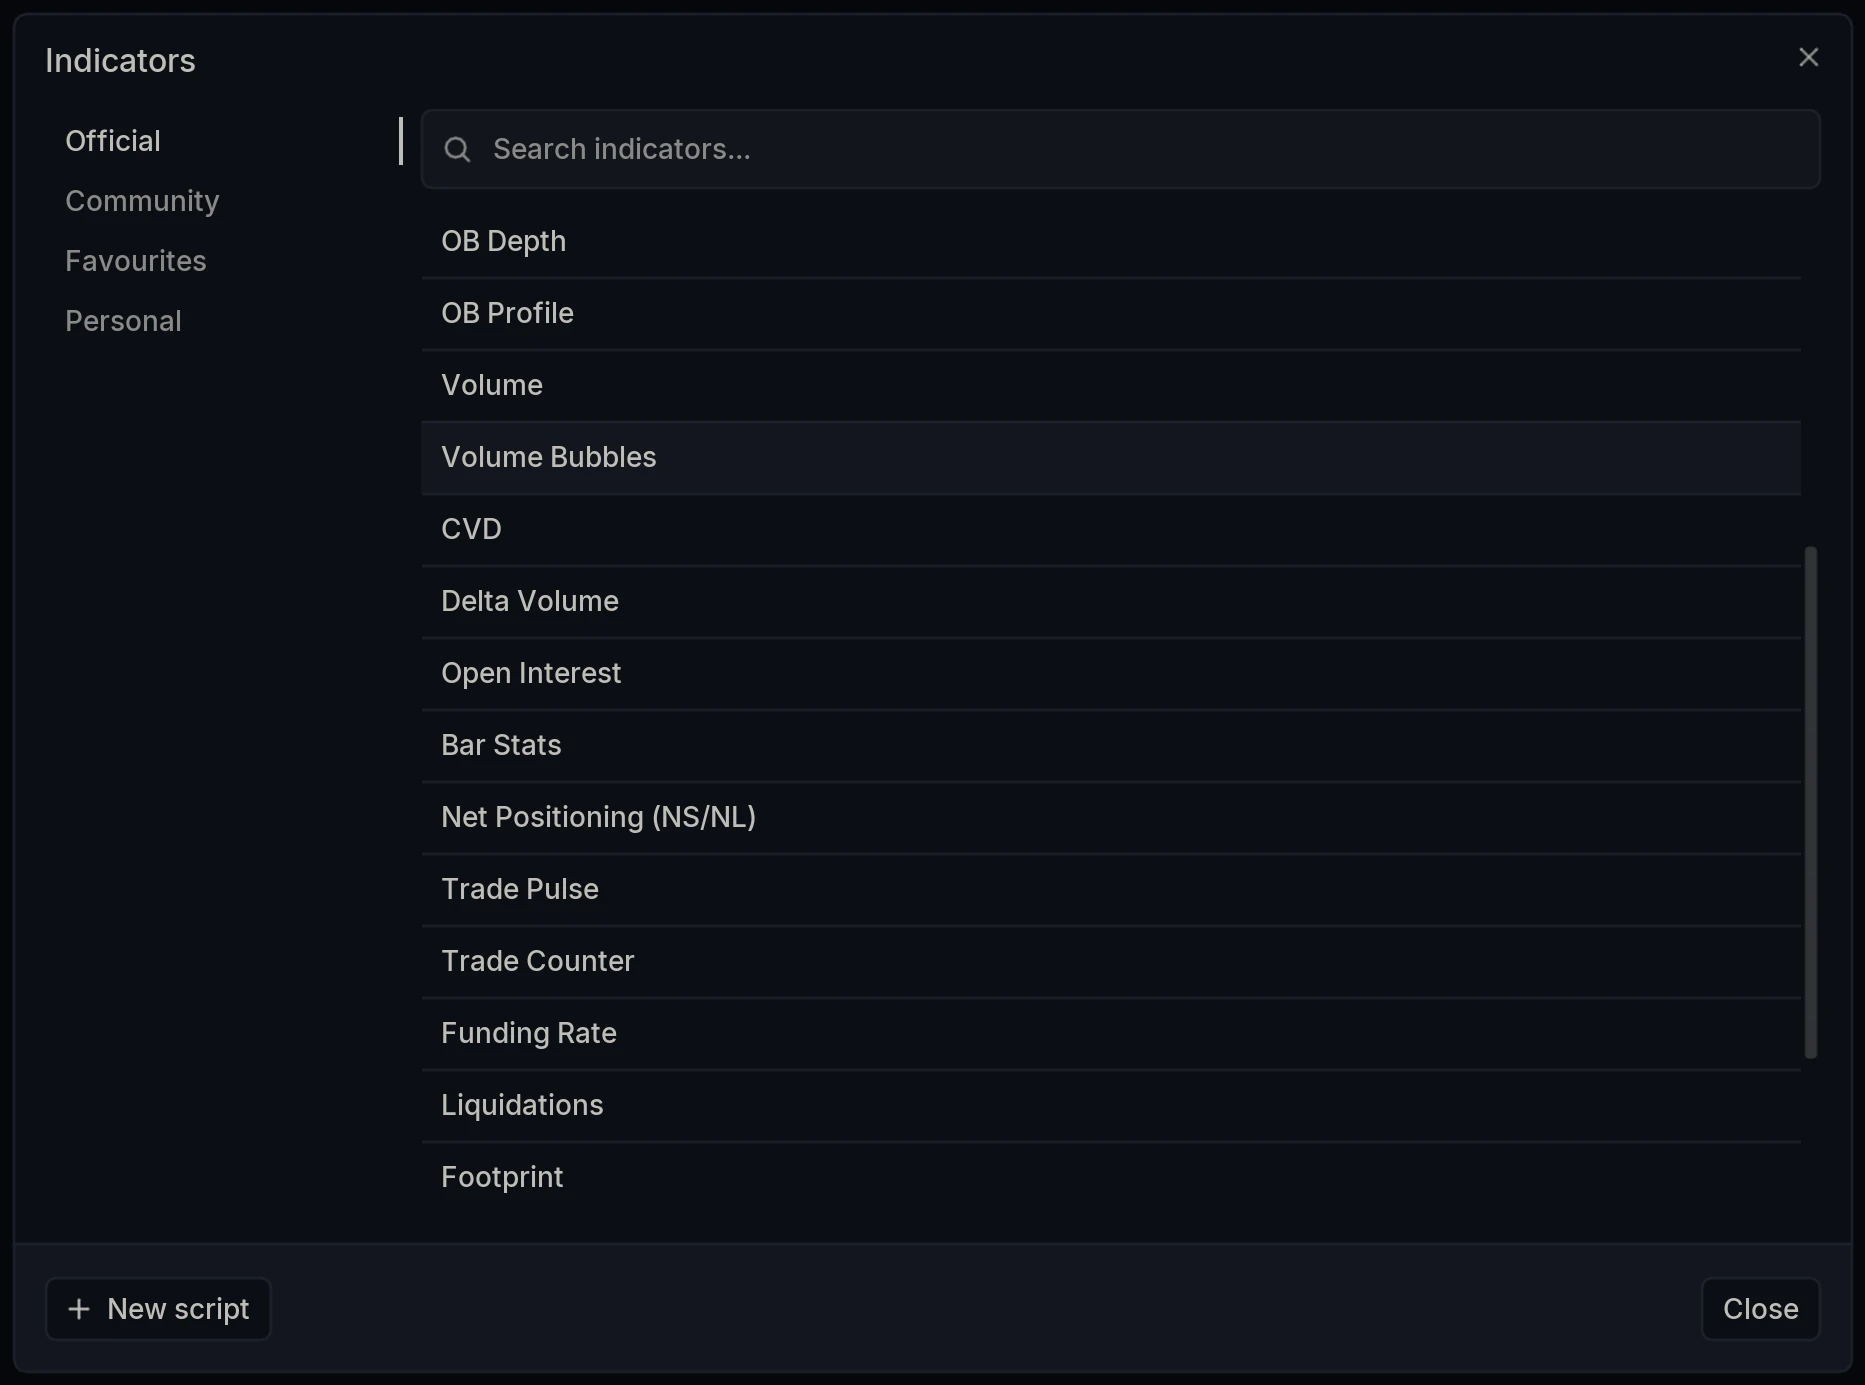
Open the Indicators dialog and select Volume Bubbles under Official.
Volume or Delta?
Mode offers Volume or Delta.
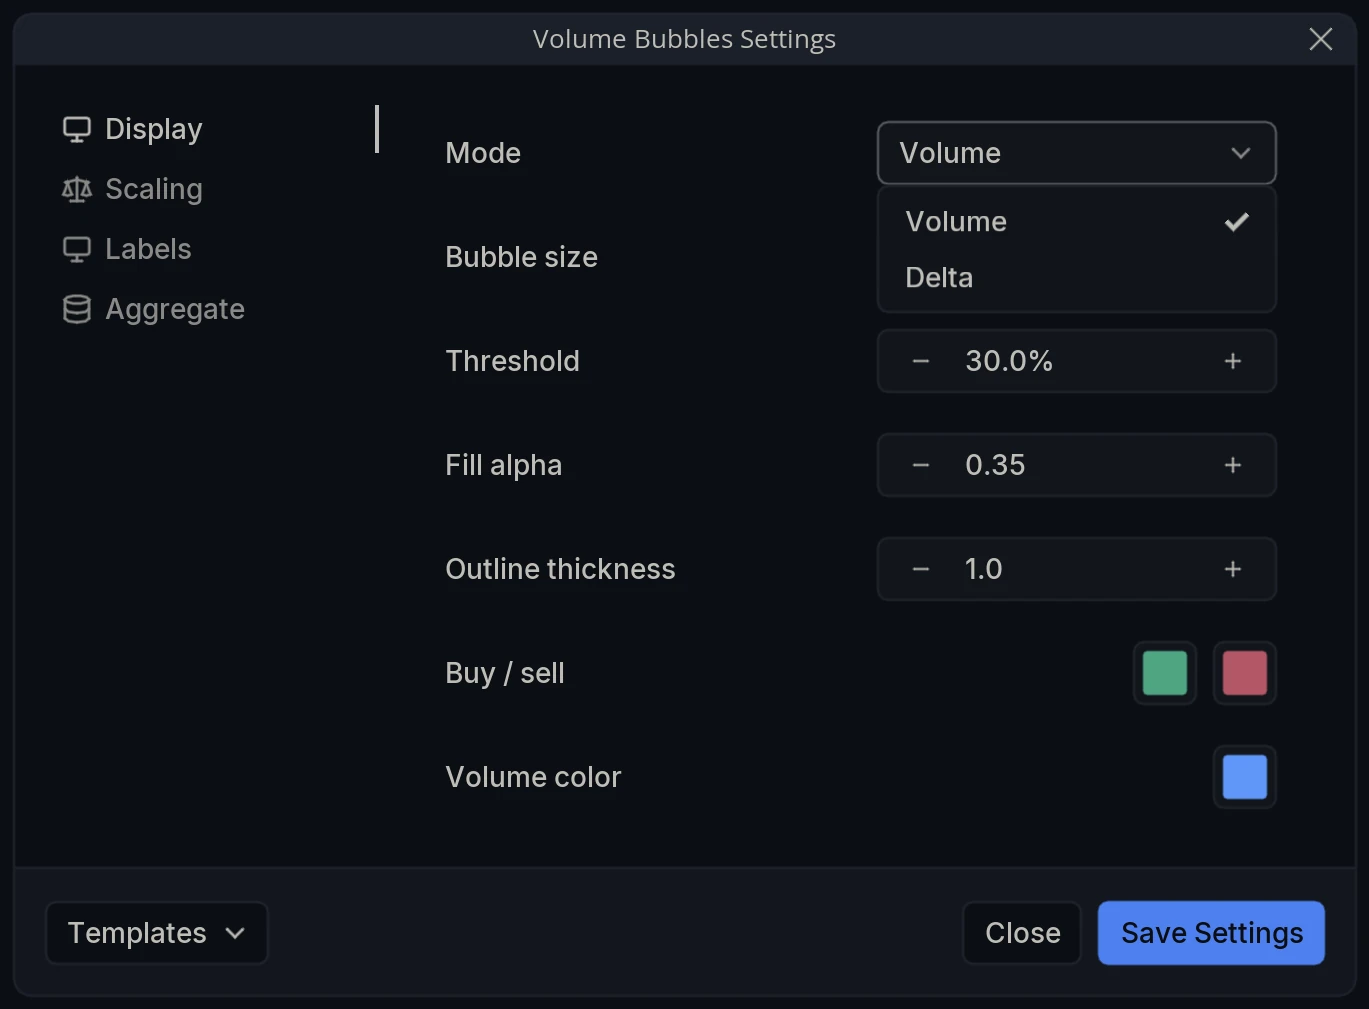
Volume sizes each bubble by total volume and draws it in the Volume color, a single color since total volume has no direction. Delta sizes by the bar’s delta and draws it in the Buy / sell colors according to which side was the aggressor.
How do the threshold and scaling work together?
These two settings decide what gets a bubble, and they work as a pair.
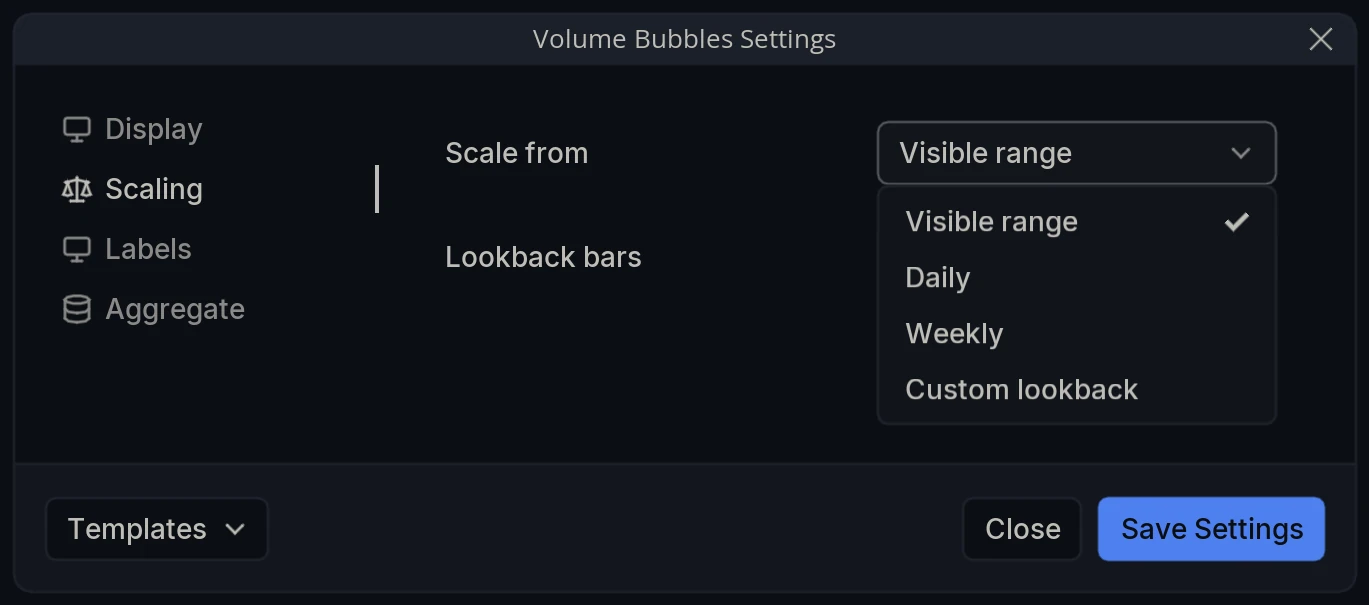
Scale from sets the window that the maximum is taken from: Visible range, Daily, Weekly or Custom lookback. With Custom lookback, Lookback bars sets how many bars back to look.
Threshold is then a percentage from 0 to 100 of that maximum. Activity at a price must reach that share of the busiest reading in the window to be drawn at all, so raising it leaves only the largest events on the chart and lowering it marks more of them.
The pairing is what makes the tool adaptable. Visible range rescales as you navigate, so the bubbles always describe what is currently on screen and a quiet stretch still shows its own busiest bars. A fixed window such as Daily or Weekly holds the standard still, so a bubble means the same thing wherever you scroll and quiet periods correctly show nothing at all.
What do the labels show?
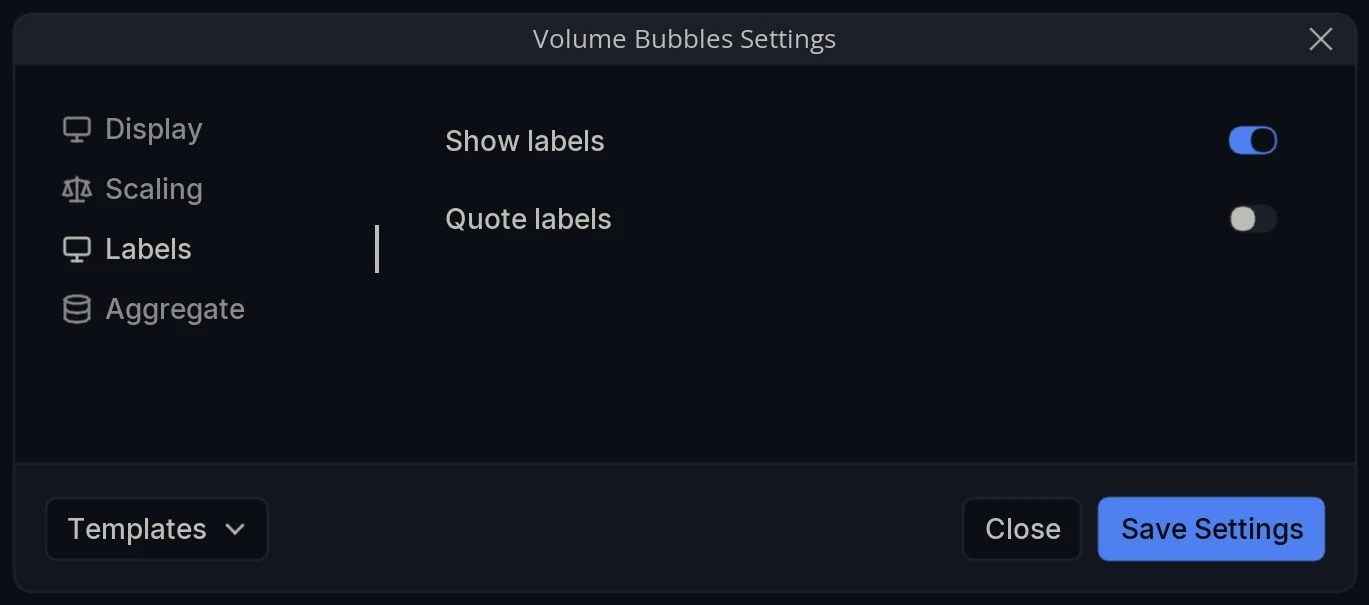
Show labels prints the figure inside each bubble, so the magnitude can be read rather than judged by circle size. Quote labels reports those figures in the quote currency rather than the base asset.
Layer Settings
Open Volume Bubbles Settings via the cog wheel on the layer name. The panel has four tabs: Display, Scaling, Labels and Aggregate.
Display
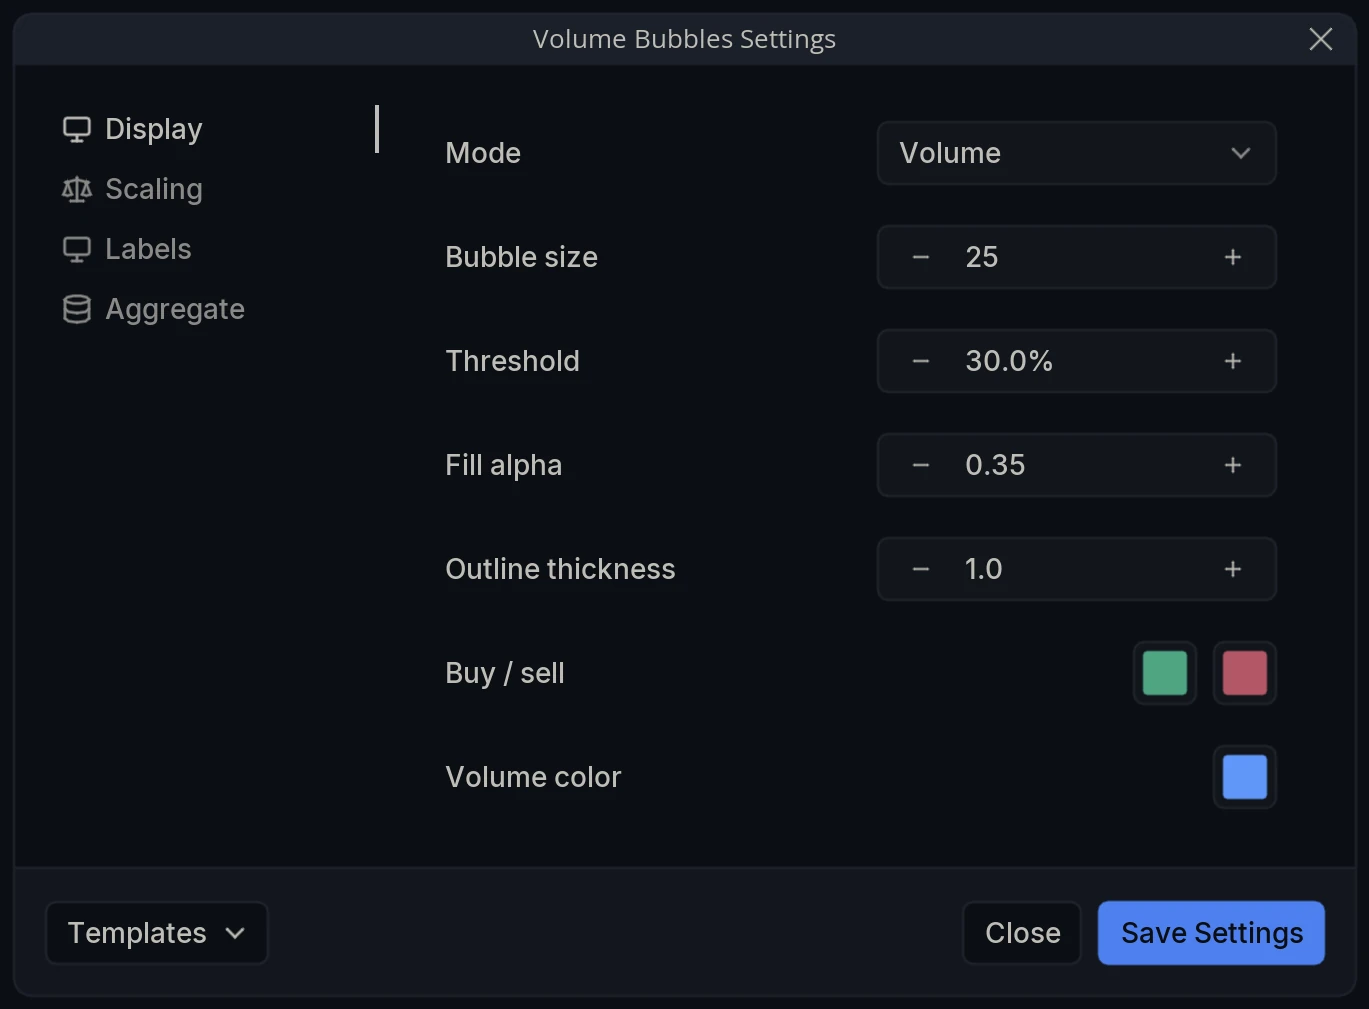
Mode - What the bubbles measure: Volume or Delta.
Bubble size - The overall scale of the circles. 25 by default.
Threshold - The share of the scaling window’s maximum that activity at a price must reach to be drawn, from 0 to 100%. 30% by default.
Fill alpha - How opaque the circle’s fill is, so the candles beneath stay visible. 0.35 by default.
Outline thickness - Weight of the circle’s outline. 1.0 by default.
Buy / sell - The two colors used in Delta mode.
Volume color - The single color used in Volume mode.
Scaling
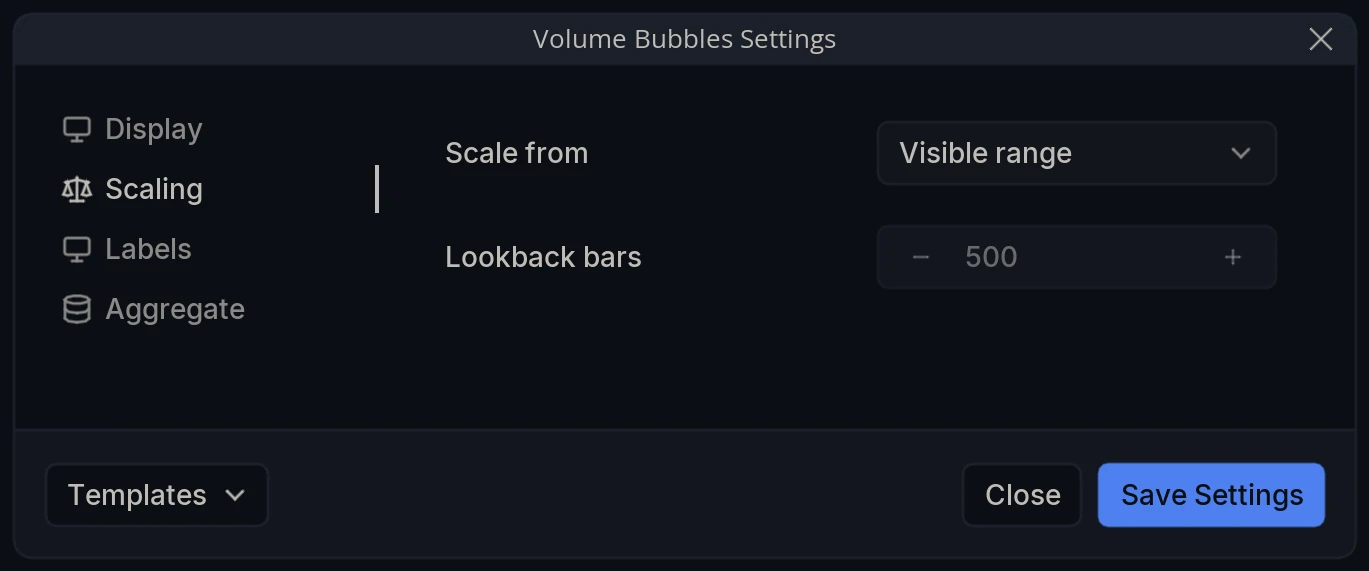
Scale from - The window whose largest reading sets the maximum: Visible range, Daily, Weekly or Custom lookback.
Lookback bars - How many bars back to measure, active when Scale from is set to Custom lookback. 500 by default.
Labels
Show labels - Print each bubble’s figure inside the circle.
Quote labels - Report those figures in the quote currency rather than in units of the base asset.
Aggregate
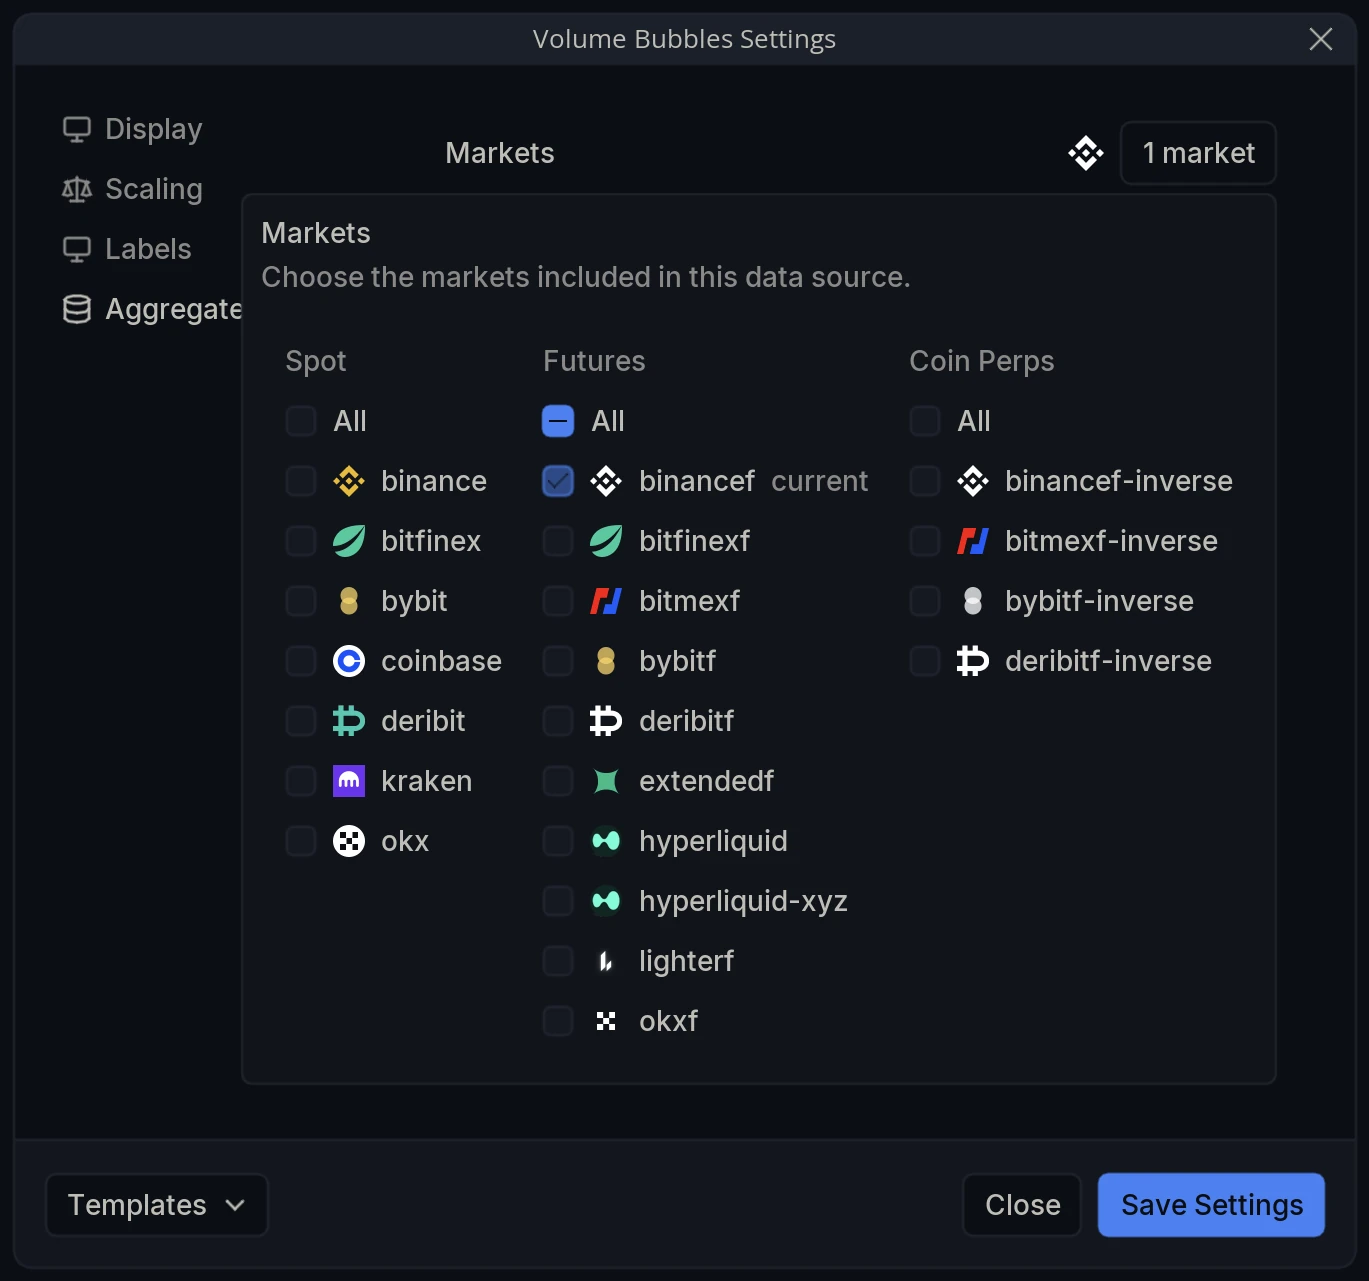
Markets - Choose the markets included in the calculation. The selector is grouped into Spot, Futures and Coin Perps, with an All toggle per group; your chart’s own market is tagged current.