What is a live liquidation feed?
By MichaelUpdated August 27, 2026
A live liquidation feed is a running list of forced position closures as they happen, newest first. Each line carries the price the liquidation filled at, its size, the exchange it came from and the time, so forced selling and forced buying can be watched as it arrives rather than read off a chart afterward.
How does a live liquidation feed work?
When a leveraged position runs out of margin, the exchange closes it. That closure is not a normal trade: it is a market order that must fill, at whatever price is available, in the direction the position was wrong. A liquidated long is force-sold; a liquidated short is force-bought. Liquidations covers the mechanism in full.
Exchanges publish those events as they occur. A feed subscribes to that stream and prints each one on its own line as it arrives, so what you are watching is forced flow entering the market in real time.
The distinction from every other liquidation tool is timing. A chart-based view groups liquidations into bars and shows you what happened once the bar is complete. A feed shows you each closure at the moment it prints, before it has been aggregated into anything.
What does a feed show that a chart does not?
Individual events. A histogram bar reading 4 million tells you the total. A feed tells you whether that was one position or four hundred, which is a different situation with different consequences.
The sequence. Whether the large closures came first and dragged the small ones behind them, or whether the small ones went first and the large ones capitulated at the end, is visible in the order the lines arrive and invisible in any total.
The pace. Liquidations arriving one every few seconds is a market grinding through weak positions. Fifty in the same second is a cascade. Both can land in the same bar.
It happens first. A cascade is over in seconds. The feed shows it while it is running, which is the only point at which the information is still actionable.
How do you read a liquidation feed?
Watch for bursts, not for lines. Individual liquidations are constant background noise in any leveraged market. What matters is when the rate suddenly changes.
Note which side is being cleared. A run of long liquidations is forced selling and pushes price down; a run of short liquidations is forced buying and pushes it up. A feed that flips from one side to the other during a move usually marks the point where the move exhausted itself.
Size the participants. A burst made of many small closures is retail leverage being flushed. A burst containing several very large ones is somebody meaningful being carried out, and those tend to mark the extreme rather than the middle of a move.
Watch the tail. Cascades end when the crowded positions have been cleared, and the feed shows that directly: the rate collapses back to background. That moment is often the reversal, because the forced supply has run out.
Compare against the level. A cluster of closures arriving at a price you were already watching tells you the level did something. Cross-reference against a liquidation heatmap and you can see whether the projected fuel at that level actually burned.
What are the limits of a liquidation feed?
Reporting is not uniform. Exchanges differ in how they publish liquidations, and some throttle or batch what they report, so the feed is a representative picture rather than a complete census.
It demands attention. Like any live feed, it only tells you things while you are watching it. Look away during the cascade and you have missed the part that mattered.
It has no shape. A list carries no history you can scan. For where liquidations landed against price over time you need the liquidations indicator.
Size is not significance. A large closure in a thin market moves price further than a much larger one in a deep market. The figure alone does not tell you the impact.
It is backward-looking by definition. Every line is something that has already been forced. For where closures are still waiting to happen, see the liquidation heatmap, or, where the underlying positions can be read directly, the Hyperliquid liquidation, stop loss and take profit heatmaps.
Related: Liquidations · Liquidation heatmap · Time and sales · Open interest · Net positioning
Using the Live Liquidations widget in MMT
MMT’s Liquidations widget is the feed: forced closures printing as they arrive, with the exchange, price, size and time on each line. Rows are colored by which side was liquidated and shaded by size, and the widget can be filtered, sounded and pooled across exchanges.
How do you add the Live Liquidations widget?
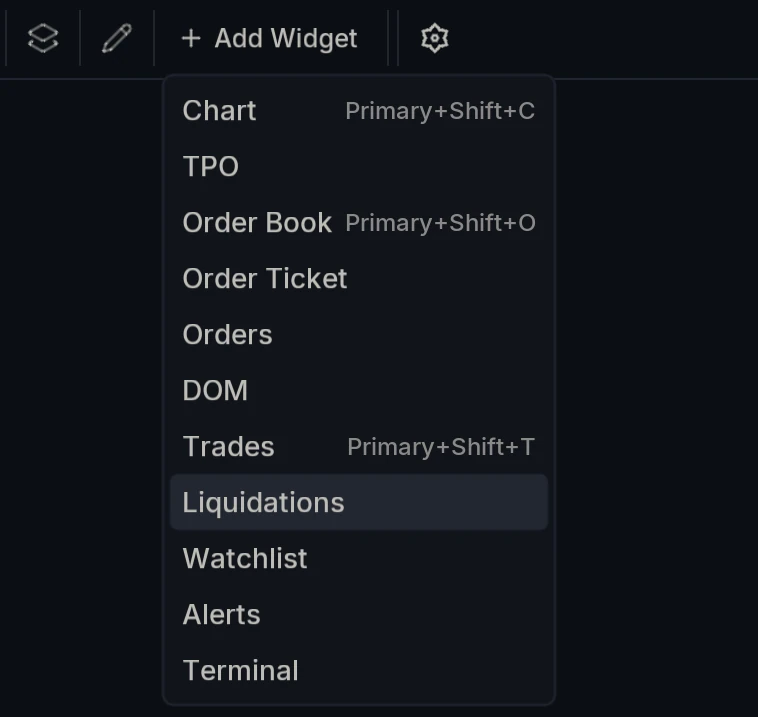
Open Add Widget and choose Liquidations.
What do the columns show?
An exchange logo marks where each closure came from, followed by Price, Size and Time.
Color carries the side. Long liquidations are drawn in one of the Liquidation colors and short liquidations in the other, so the balance of what is being cleared is visible without reading a figure. Rows are also shaded by size, which is what makes a large closure announce itself in a list that is otherwise moving too fast to follow.
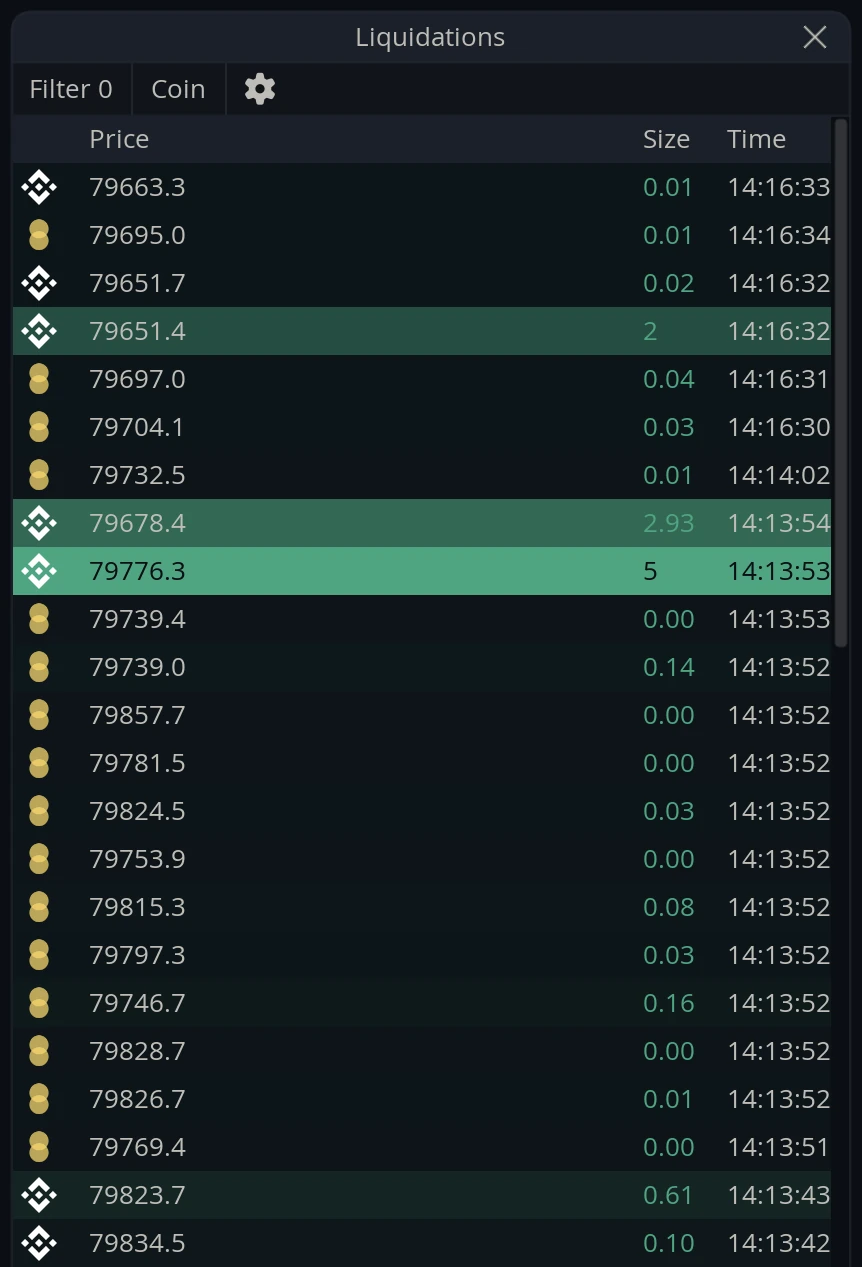
In the capture above, price had been falling, so what the feed is showing is longs being liquidated. The two brightest rows are the large ones, at 2.93 and 5, and they arrived within a second of each other in the middle of a run of much smaller closures. That shape, a burst of small liquidations with a couple of genuinely large ones inside it, is the reading the feed gives you and the histogram does not.
How do you filter out the small liquidations?
Filter on the toolbar opens a Minimum size box. Set a value and only closures at or above that size appear; everything smaller is dropped.
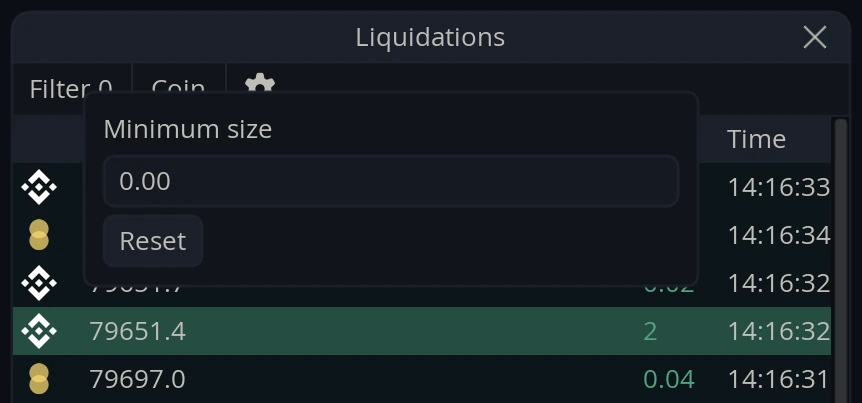
This is the setting that decides what the widget is for. Unfiltered it is a picture of everything, which in a leveraged market is a constant trickle. Filtered to size, the trickle disappears and what is left is the closures large enough to move something, which is a far shorter list and a much easier one to watch.
Reset clears it back to zero.
Coin or USD?
The unit toggle switches sizes between the base Coin and USD.
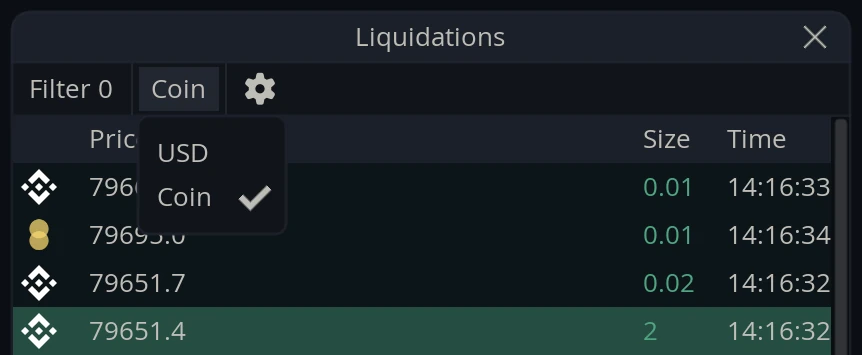
USD is usually the better choice when filtering, since a size threshold in dollars means the same thing across markets.
What are the audio alerts?
The widget can play a sound as liquidations arrive, which turns the feed into something you can monitor without watching it. This is audio flow: you hear forced closures happening while your attention is on the chart.
It suits liquidations particularly well, because the thing you are listening for is a change in rate. A cascade is unmistakable by ear.
Audio threshold sets the smallest closure that makes any sound. Level 1 through Level 4 are size tiers above it, so a large liquidation is distinguishable from a small one without looking. These figures are always in USD, whichever unit the list itself is set to.
Can you combine exchanges?
Yes. Markets in the settings pools several venues into one feed, grouped into Futures and Coin Perps, with your chart’s own market tagged current.
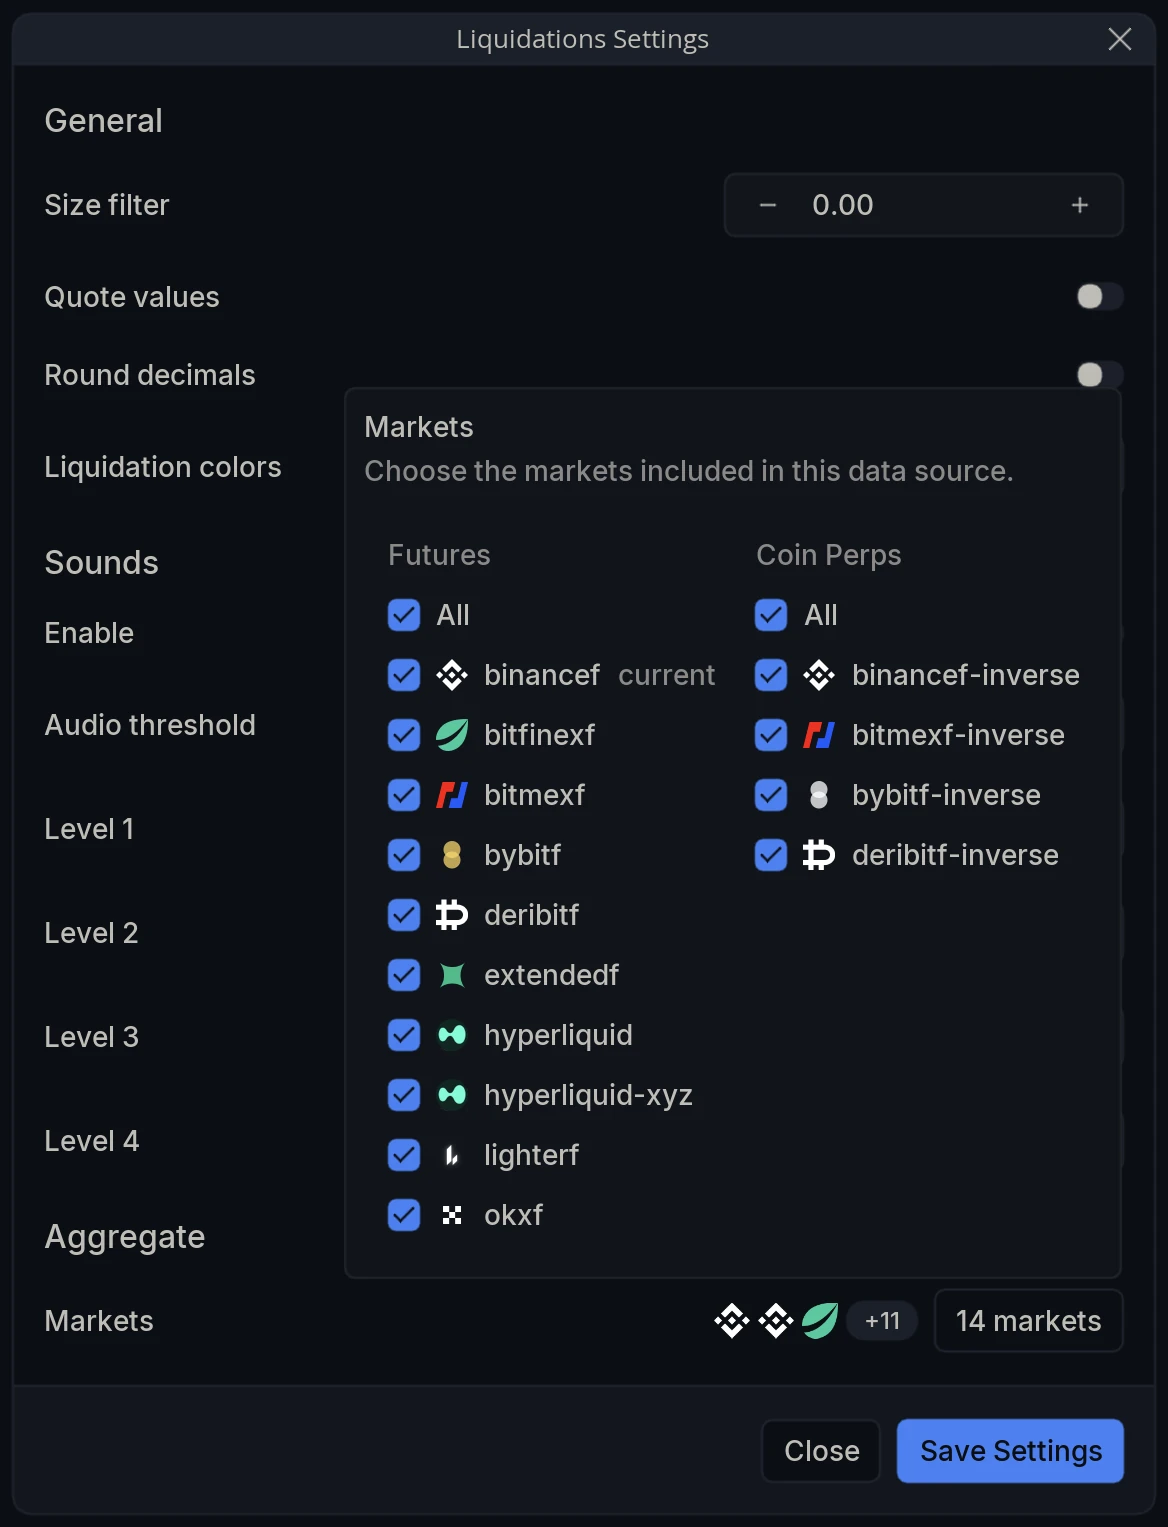
There is no Spot column, because spot markets have no leverage and therefore nothing to liquidate.
Aggregating is worth doing here more than on most widgets. A cascade rarely stays on one exchange, and pooling venues is the difference between seeing one exchange’s share of a flush and seeing the flush.
Widget Settings
Open Liquidations Settings via the cog on the widget’s toolbar.
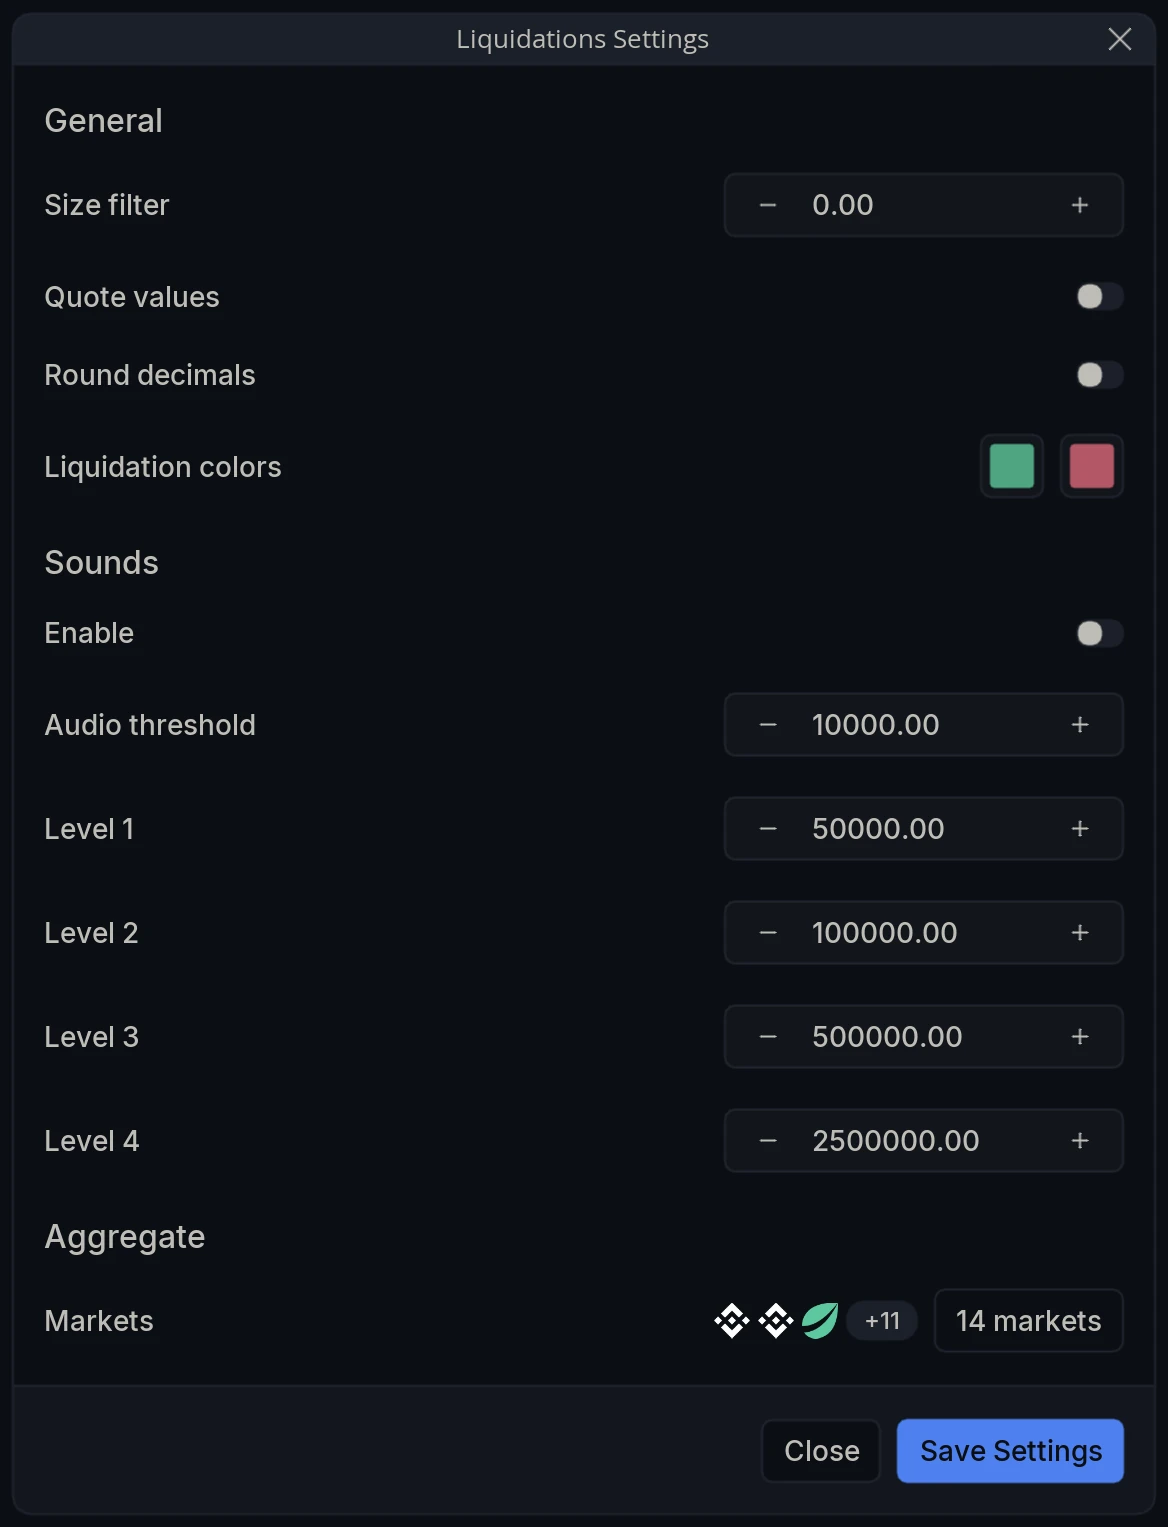
General
Size filter - The smallest liquidation shown in the list. Everything below it is excluded.
Quote values - Report sizes in the quote currency rather than the base asset.
Round decimals - Round the printed figures.
Liquidation colors - The two colors used for long and short liquidations.
Sounds
Enable - Turn audio flow on.
Audio threshold - The smallest liquidation that produces a sound, in USD.
Level 1 / Level 2 / Level 3 / Level 4 - Size tiers above the threshold, in USD, so larger liquidations sound different from smaller ones.
Aggregate
Markets - Choose which exchanges are included in the feed.