What is a trade counter?
By MichaelUpdated August 24, 2026
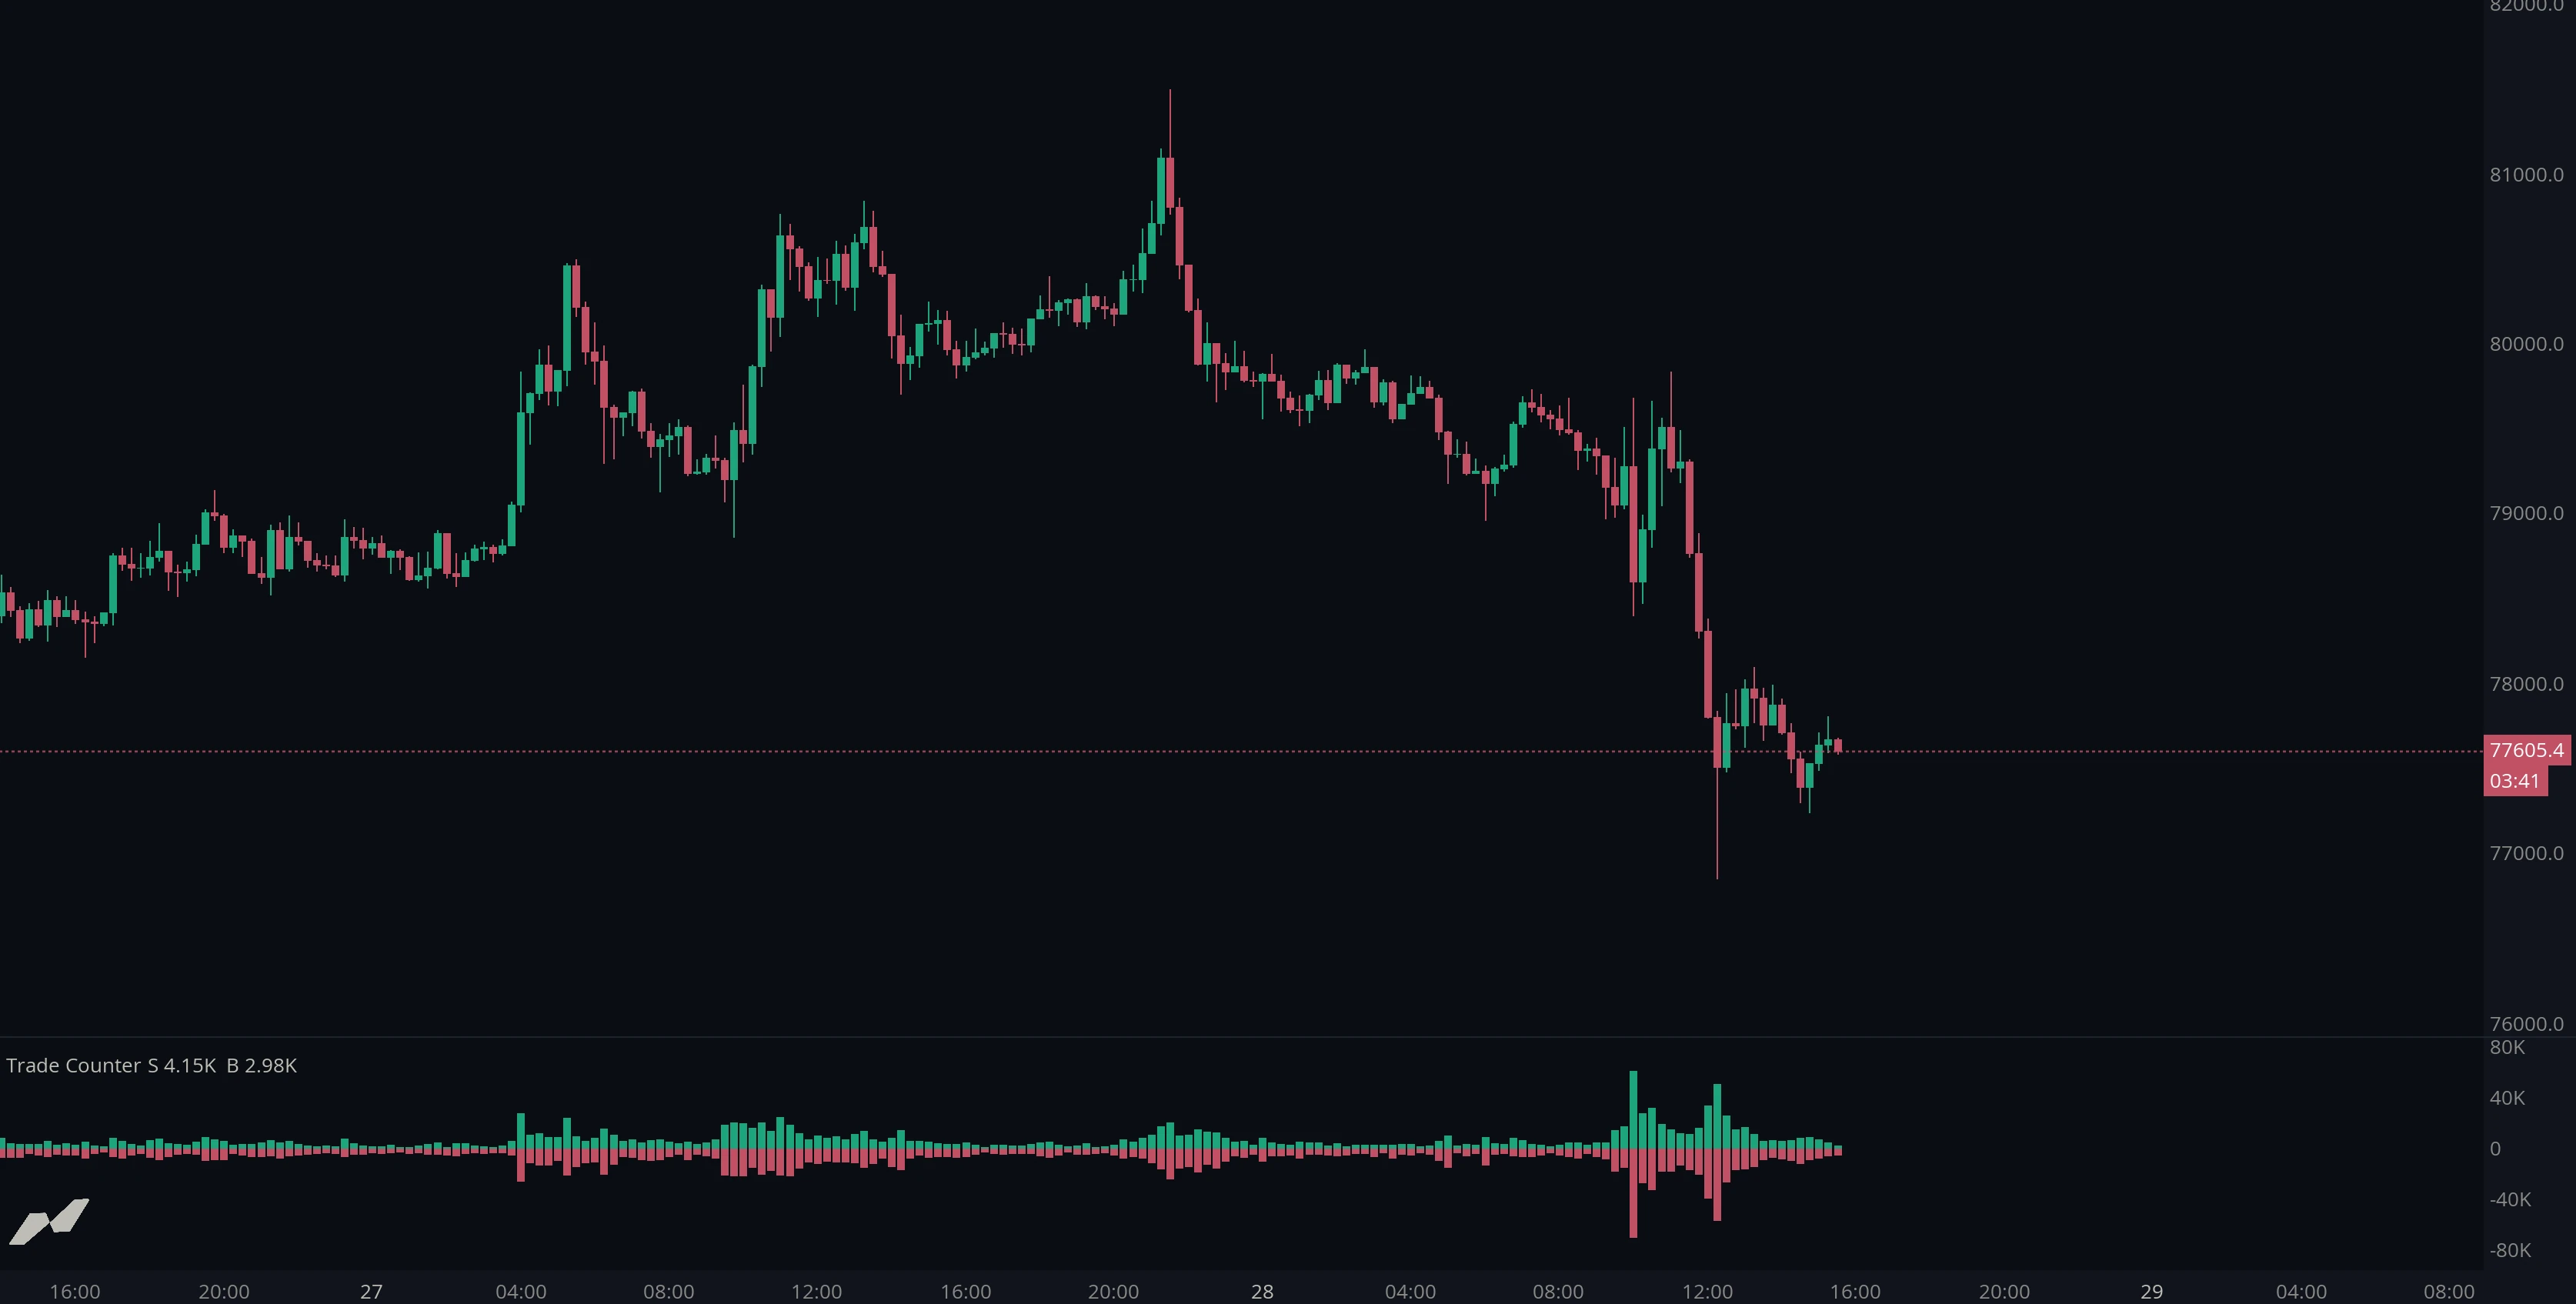
A trade counter measures how many individual trades executed during each candle, rather than how much size traded. It is added as a histogram indicator in its own panel below the price chart, usually splitting buys from sells, so the height reports the number of transactions rather than their combined value.
How does a trade counter work?
Every execution that crosses the spread is one trade, whatever its size. A trade counter simply tallies them: for each candle it counts the market buys and the market sells that occurred, and draws the totals as a histogram in a panel of its own below the price chart.
That is a different measurement from volume, and the distinction is the point. A candle with 500,000 in volume could be one participant sending a single large order, or five hundred participants sending small ones. Volume reports the same figure either way. Trade count separates them, because the first case produces one trade and the second produces five hundred.
What the count captures is participation and urgency. A burst of trades means many separate decisions were made in a short space of time, which is what happens when a level breaks, news lands, or a cascade of stops and liquidations fires. Read alongside volume, it describes not just how much business was done but how many hands did it.
How do you read a trade counter?
The plot is drawn from a baseline of zero. Buys extend above it and sells extend below, so each candle produces a pair of bars whose relative heights show which side executed more often. A line view is also available where the shape of the count over time matters more than the individual candles.
Read it the way you read volume: relative to its recent norm rather than in absolute terms. A count in line with surrounding candles is ordinary activity. A sudden spike marks a moment when a lot of separate participants acted at once, and is worth locating on the price chart to see what triggered it.

The asymmetry matters too. A candle with far more buy executions than sell executions shows aggressive buyers were more numerous, which is a different statement from saying they traded more size.
What does trade count tell you that volume does not?
The two readings answer different questions, and the interesting information is usually in the gap between them.
High count with low volume means many small trades. That is retail-shaped flow: a crowd of participants acting at once, each in modest size. It often appears at emotional moments, when a level gives way and a lot of small positions react together.
Low count with high volume is the opposite: few trades, each of them large. That is institutional-shaped flow, a small number of participants moving significant size, and it often accompanies quieter price action than the volume figure alone would suggest.
High count with high volume is broad, committed participation. Everyone is involved and they are trading in size, which is the signature of a genuine breakout or a capitulation.
None of these are signals on their own. They are context that changes how you weigh a move you have already identified.
When should you use a trade counter?
Trade count is a secondary tool. It rarely justifies a decision by itself, but it sharpens the reading of one.
It is most useful at potential turning points, where spikes in the number of executions often coincide with exhaustion and reversal, and as a companion to volume when you want to know what kind of participant is behind a move. It is least useful in quiet markets, where the count drifts along with nothing to distinguish it.
Related: Volume · CVD (Cumulative Volume Delta) · Liquidations
Using the trade counter in MMT
MMT’s Trade Counter counts market buy and market sell executions separately for every candle and draws them in its own pane beneath the price chart, which can be resized to taste.
How do you add the trade counter to a chart?
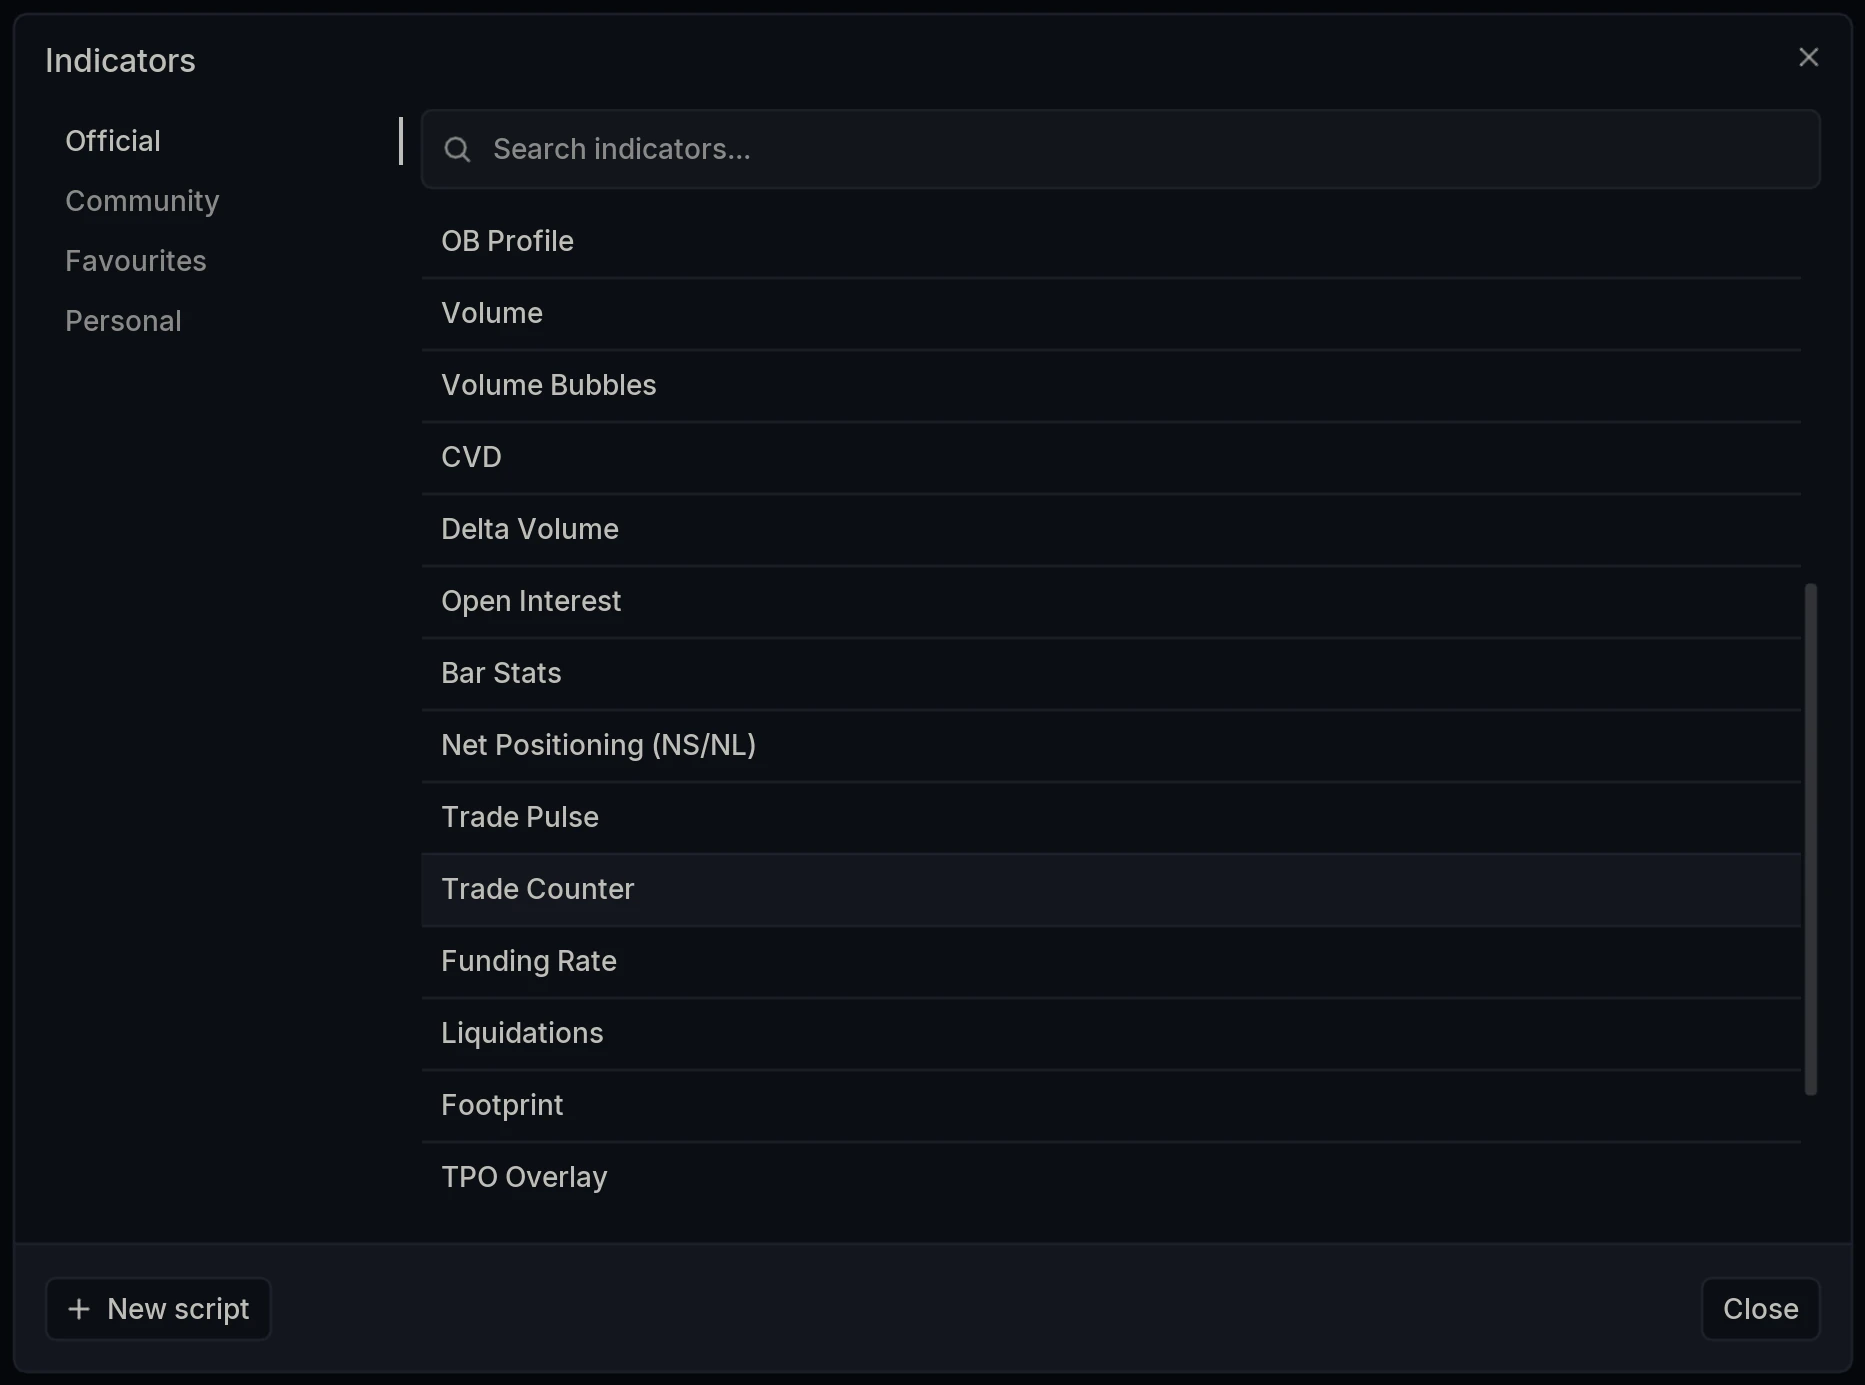
Open the Indicators dialog and select Trade Counter under Official. It renders in a dedicated pane beneath the main price chart.
Layer Settings
Open Trade Counter Settings via the cog wheel on the layer name. The panel has two tabs: Display and Price Marker.
Display
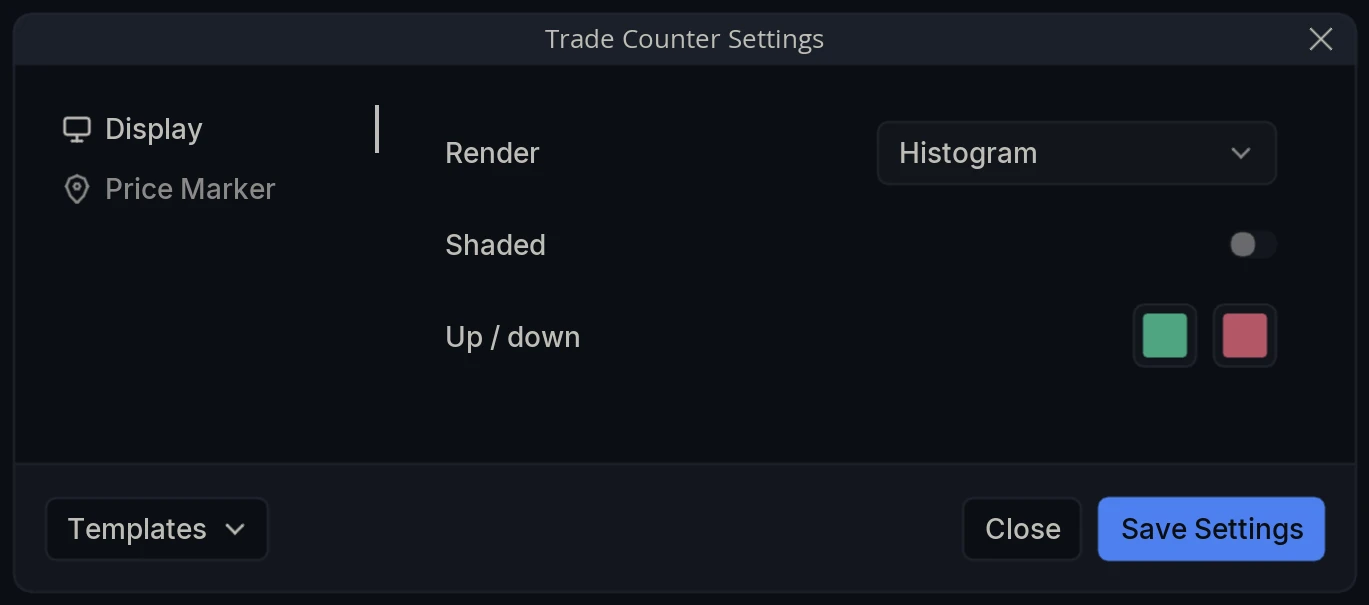
Render - How the counts are drawn: Histogram (one bar per candle, the default) or Line.
Shaded - Fill the area beneath the line with the fill color. Applies to Line only, and has no effect in Histogram mode.
Up / down - The two colors used for market buy and market sell counts.
Price Marker
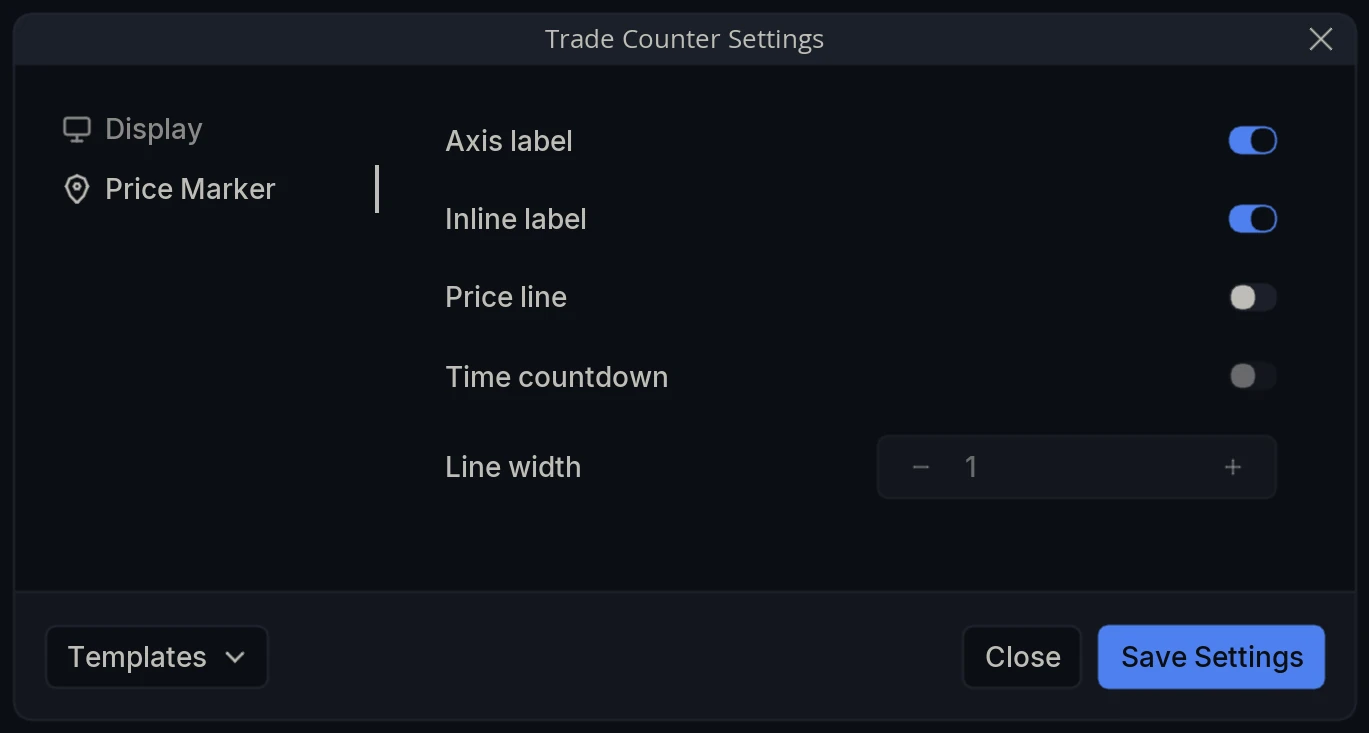
Axis label - Show the current value as a label on the pane’s axis.
Inline label - Show that value on the pane itself rather than on the axis.
Price line - Draw a horizontal line across the pane at the current value.
Time countdown - Show the time remaining until the current candle closes.
Line width - Thickness of that line.