What is an order book?
By MichaelUpdated August 27, 2026
An order book is the list of every unfilled limit order in a market, arranged by price. Buy orders sit below the current price and sell orders above it, and the quantity waiting at each level shows how much would have to be traded for price to move through it.
How does an order book work?
Two kinds of order exist in any market. A limit order states a price and waits; a market order crosses the spread and takes whatever is waiting. The order book is the record of everything currently waiting.
It has two sides. Bids are buy orders, and they sit below the current price because nobody bids above what they could simply pay. Asks, also called offers, are sell orders sitting above it for the same reason. The gap between the highest bid and the lowest ask is the spread, and it is where the current price lives.
Every price level carries a quantity: how much is available there. That quantity is what price has to consume to move. A level holding a great deal takes real buying or selling to clear; a level holding almost nothing gets passed through instantly.
Read as a whole, the book describes the shape of the market’s standing intent. Where size is stacked, where it is thin, and how the two sides compare are all visible at once, before anything has traded.
How do you read an order book?
Find the walls. A level holding far more than its neighbors is a wall. Above price it is offers that have to be bought through; below price it is bids that have to be sold through. Either way it is a level price will slow at, if it is still there when price arrives.
Find the gaps. Thin levels are where price travels fastest, because there is almost nothing to trade against. A wall with a gap just beyond it is a specific shape: hard to reach, then quick once passed.
Compare the two sides. A book with heavy bids beneath and a thin, scattered ask side is far better supported below than it is capped above. That is a different market from one where both sides match, even if price looks identical.
Watch how it changes. This is the part a static reading misses. Size that has sat through repeated tests is real. Size that appears as price approaches and vanishes before it arrives was never going to be filled. The book is a live object, and its behavior over time tells you more than its state at any instant.
What are the limits of an order book?
Resting orders are not commitments. Any limit order can be canceled before it fills. The book shows what has been stated, not what will happen.
Spoofing exists. Size placed with no intent to be filled, purely to shape how the book looks, is common in unregulated markets.
It is only the visible book. Iceberg orders show a fraction of their true size, and conditional orders such as stops and take profits are not in the book at all until they trigger.
It has no memory. The book describes now. To see how depth behaved over time you need an order book heatmap.
It is venue-specific. Each exchange publishes only its own book.
Related: Order book heatmap · Order book depth and imbalance · OB Profile · DOM · Time and sales
Using the Order Book widget in MMT
MMT’s Order Book is a live ladder with the asks above the current price and the bids below, each row carrying its size, how that size is changing, and a bar showing the depth behind it. Two strips down the left edge show recent executions and resting size side by side, so what has traded and what is waiting can be read together.
How do you add the Order Book?
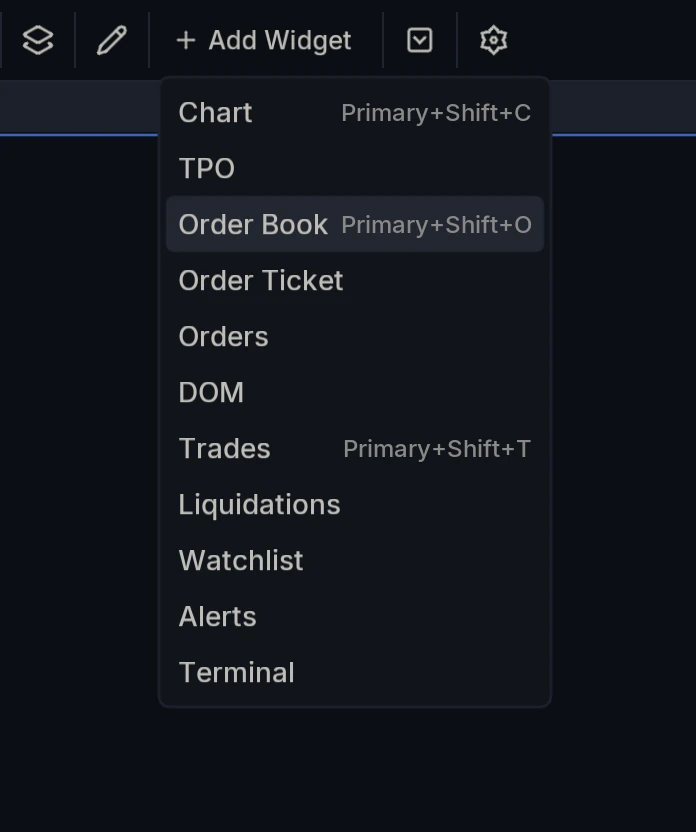
Open Add Widget and choose Order Book, or press Primary+Shift+O.
What do the columns show?
Price is the level. Size is the quantity resting there. Delta is how that size has changed, so a positive figure means orders have been added at that price and a negative figure means they have been pulled.
The Delta column is the one worth getting used to. A wall with a strongly negative delta is being withdrawn as you watch; a level quietly accumulating size has someone building there. Neither is visible from the size figure alone.
A Sum column showing cumulative depth can be enabled as well, and the stepped line drawn across the ladder shows that same cumulative total graphically.
What are the two strips on the left?
Two narrow columns of colored blocks run down the left edge of the ladder, and they show different things.
The outer strip is the trade heatmap: recent executions, plotted at the price they traded at and colored by the Heat colormap. Trade heat window sets how far back it looks.
The inner strip is the size heatmap, which shades each level by how much is resting there.
Together they are what makes this more than a depth ladder. One strip shows what has actually traded, the other what is merely waiting, and they sit side by side at the same price. You can see immediately whether a heavy level is being tested, whether trading is clustering somewhere the book is thin, or whether size is sitting untouched.
How do you group prices?
Price group merges adjacent price levels into single rows: 0.1, 1, 5, 10, 50 or 100.
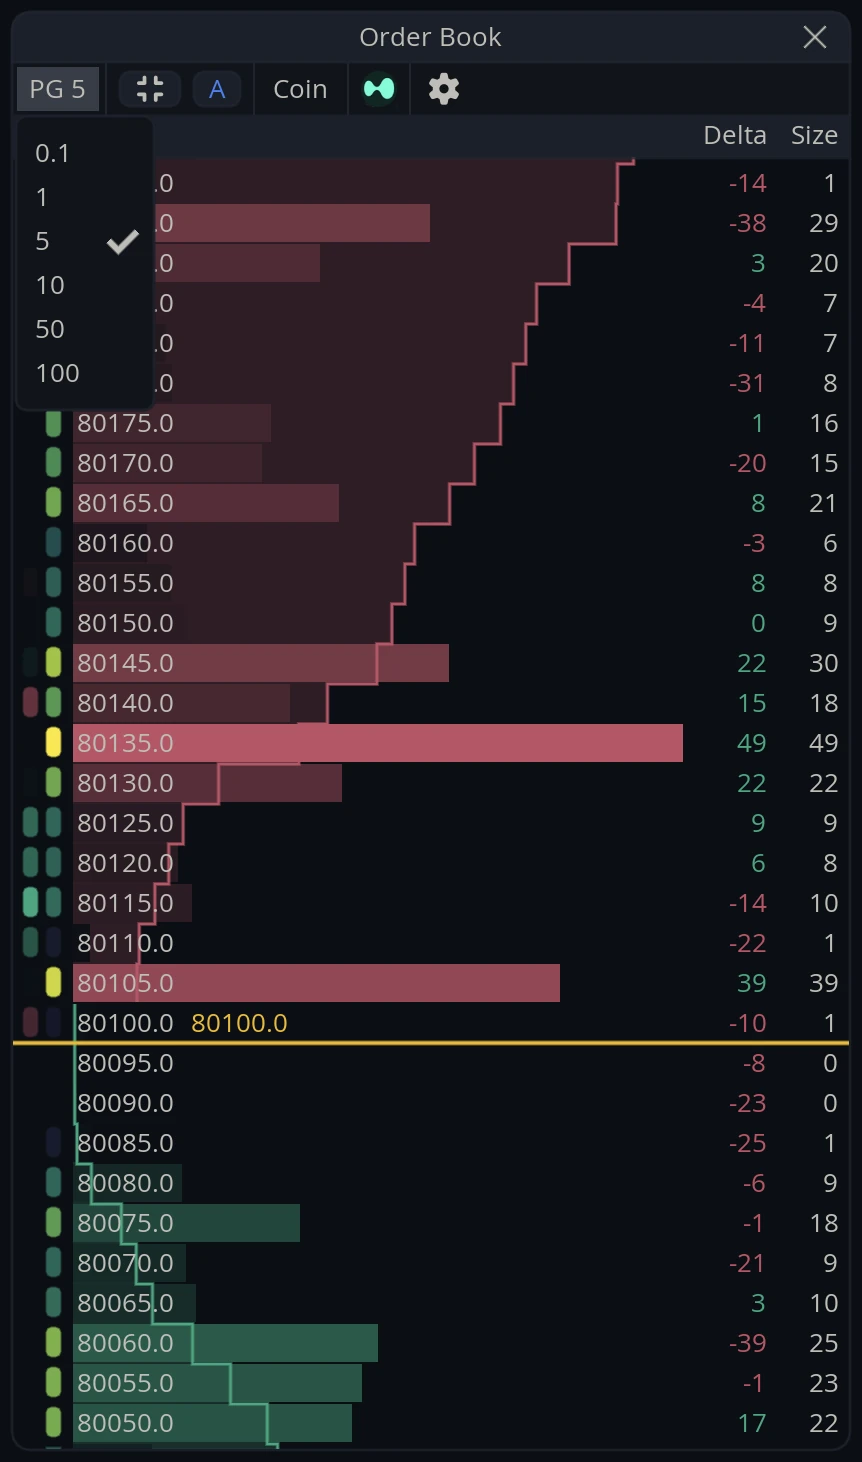
Grouping is the setting that decides what the book is for. Fine grouping shows individual price levels and the churn at the top of the book. Coarse grouping merges them into bands, which hides the churn and makes genuine concentrations of size much easier to see.
How does the ladder stay centered?
Two controls govern this, both on the widget’s toolbar.
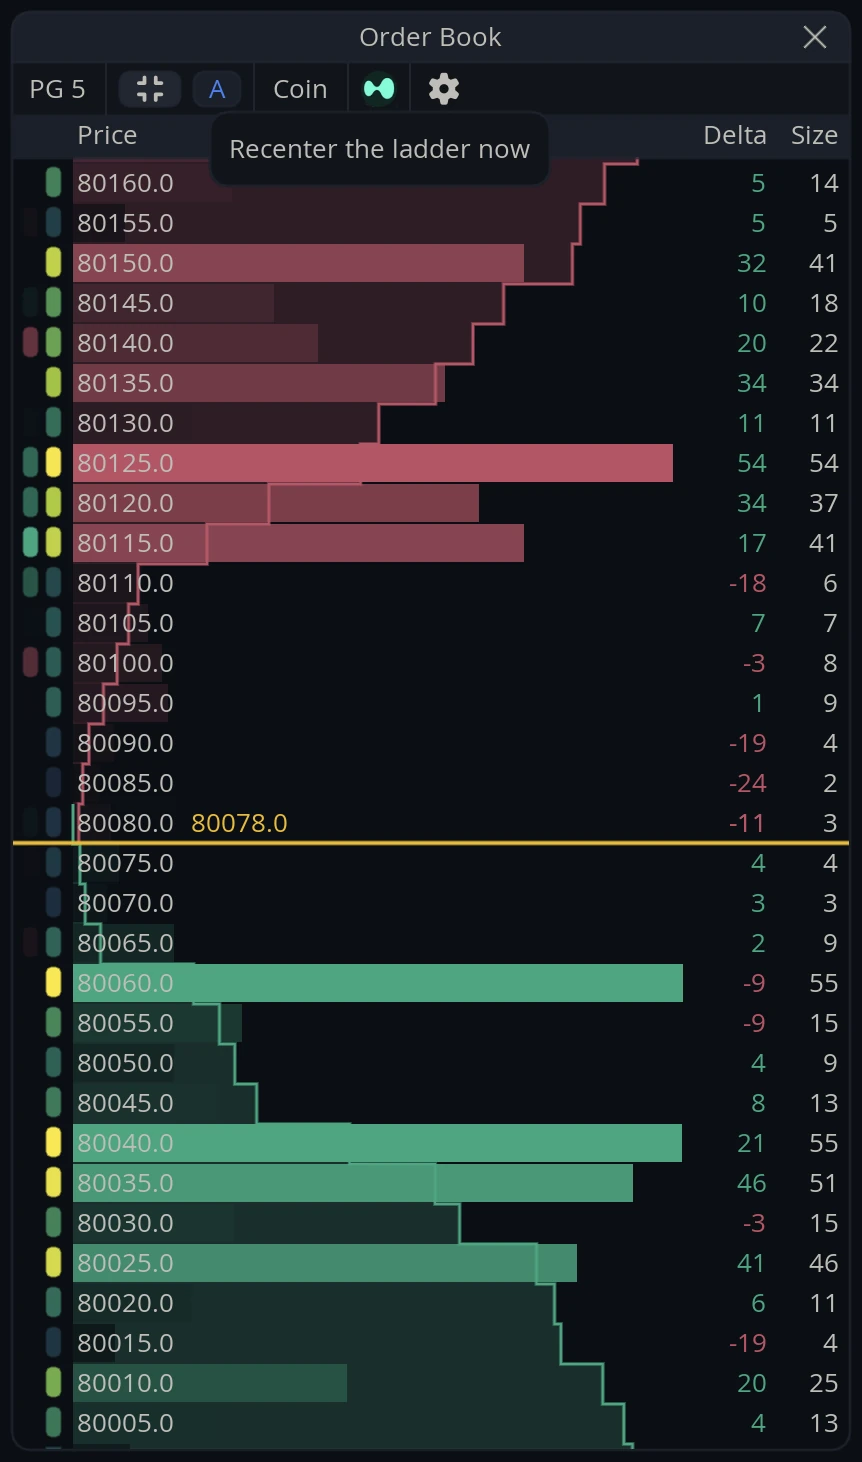
Recenter the ladder now snaps the view back so the current price sits in the middle.
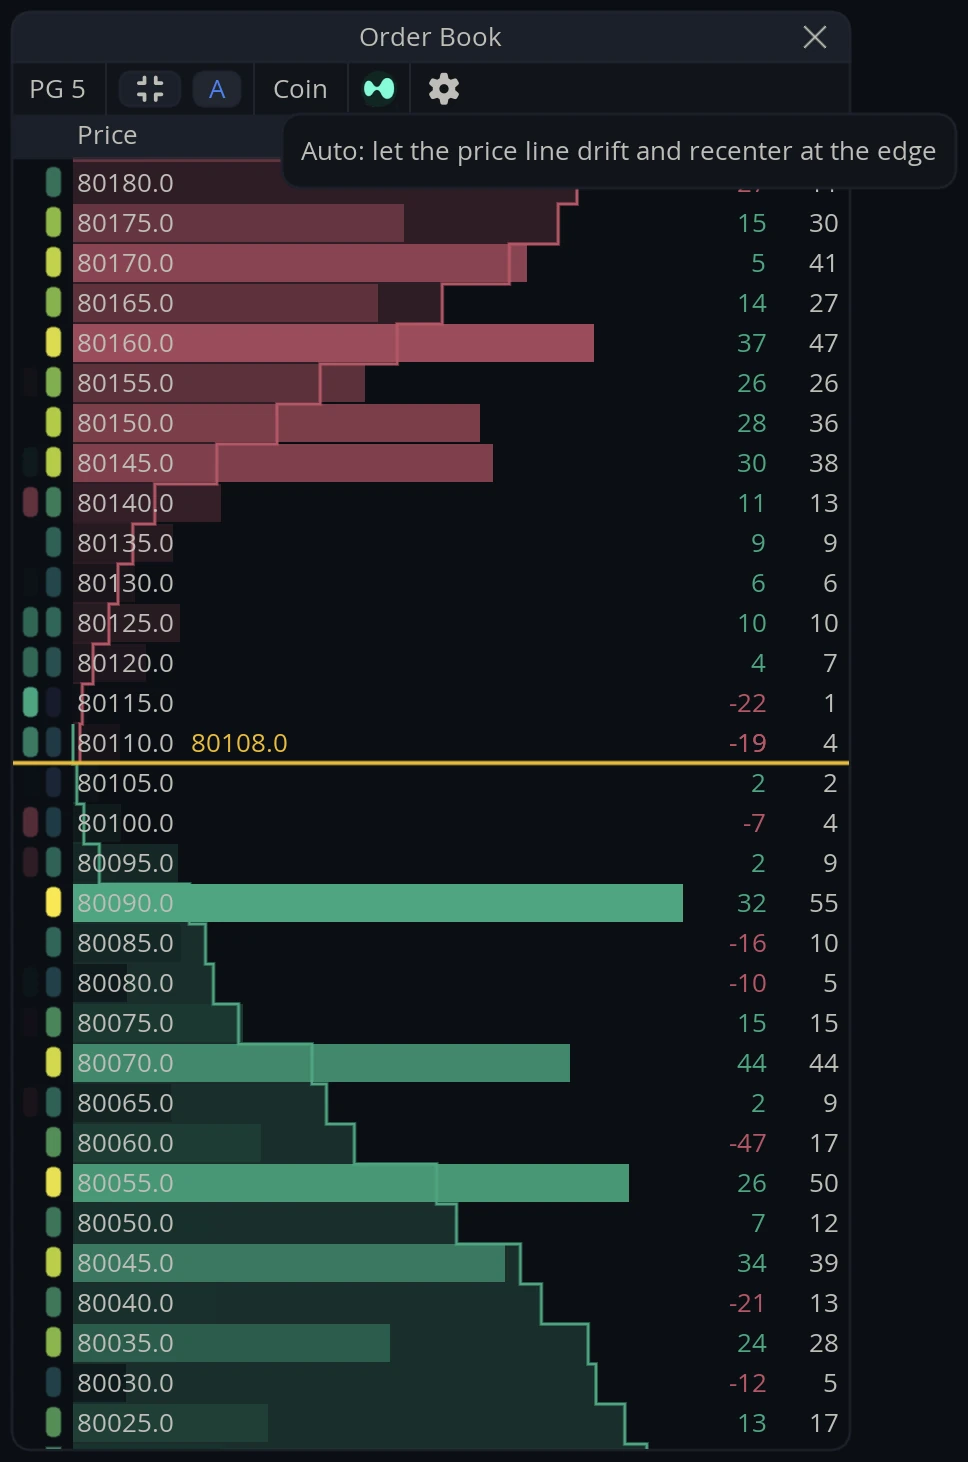
Auto lets the price line drift as the market moves and recenters automatically when it reaches the edge, which keeps the ladder stable instead of jumping with every tick.
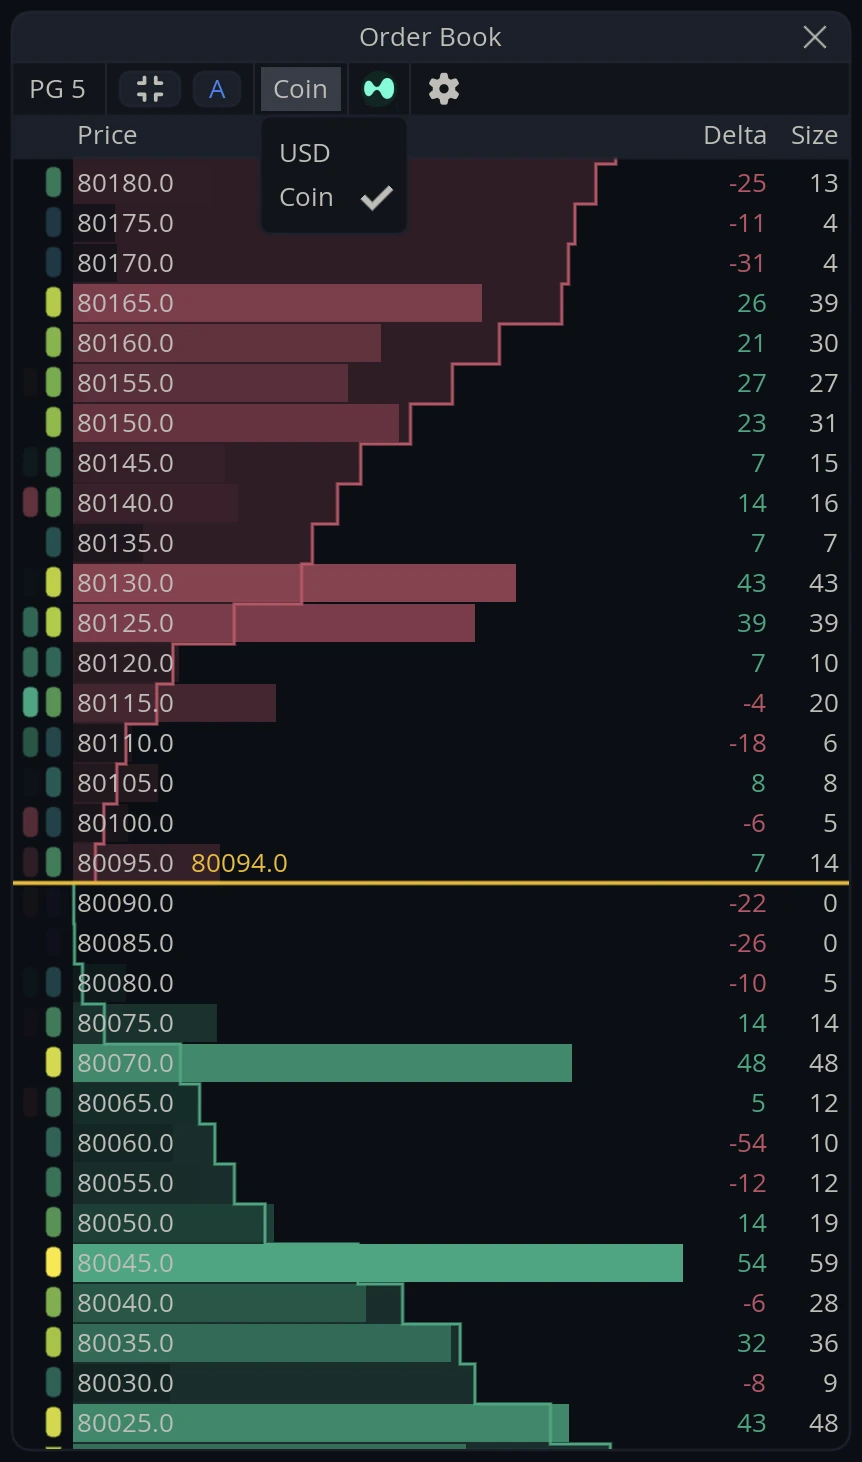
Coin or USD?
The unit toggle switches sizes between the base Coin and USD.
Can you combine exchanges?
Yes. The market button shows the current venue, and Aggregate exchanges pools several books into one ladder.
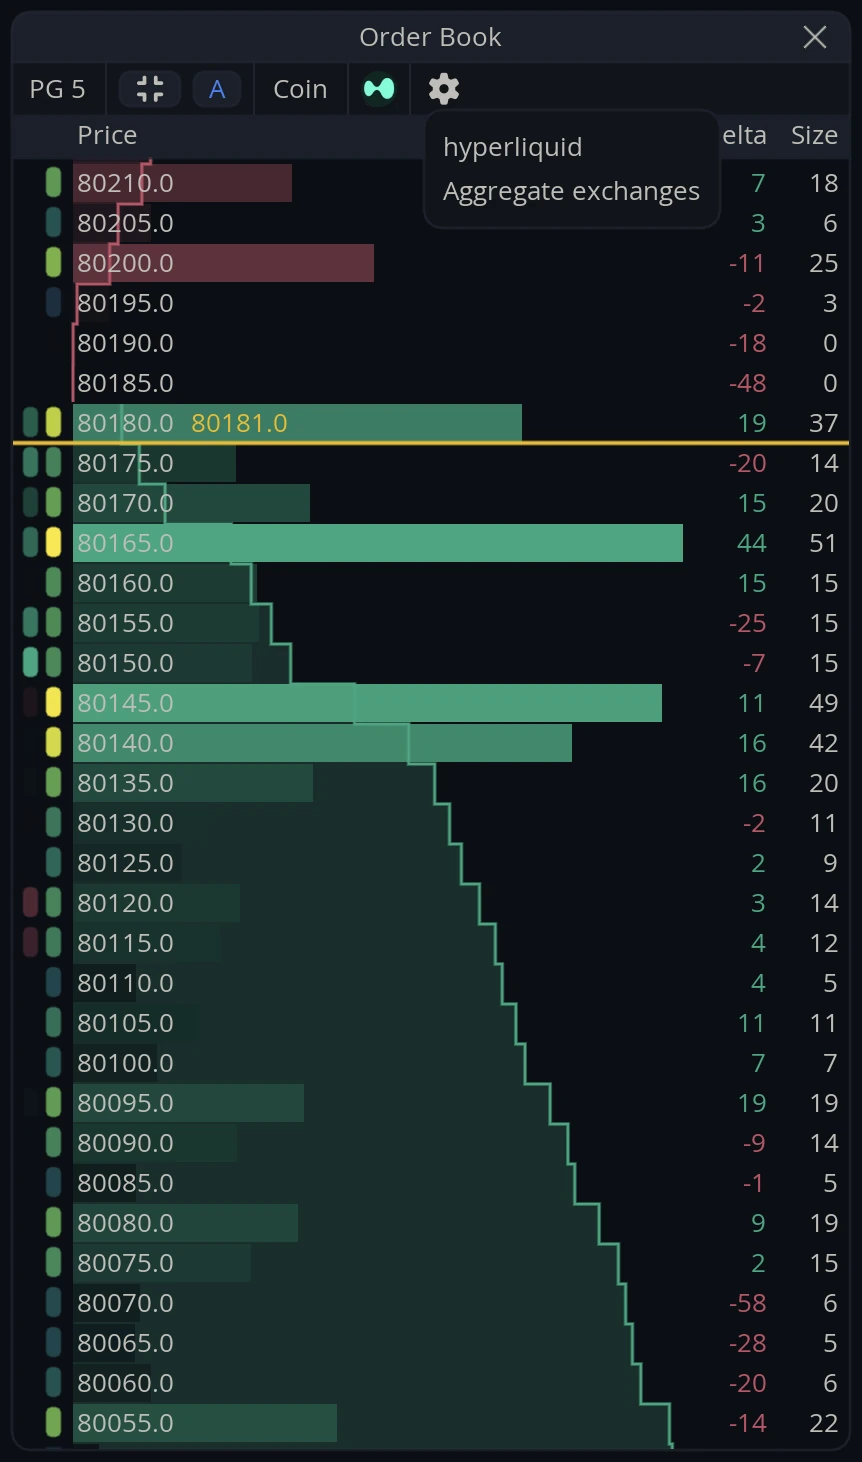
Aggregating is worth doing when the question is where liquidity genuinely sits, since a wall on one exchange is a much weaker level than the same size spread across several.
Widget Settings
Open Order Book Settings via the cog on the widget’s toolbar.
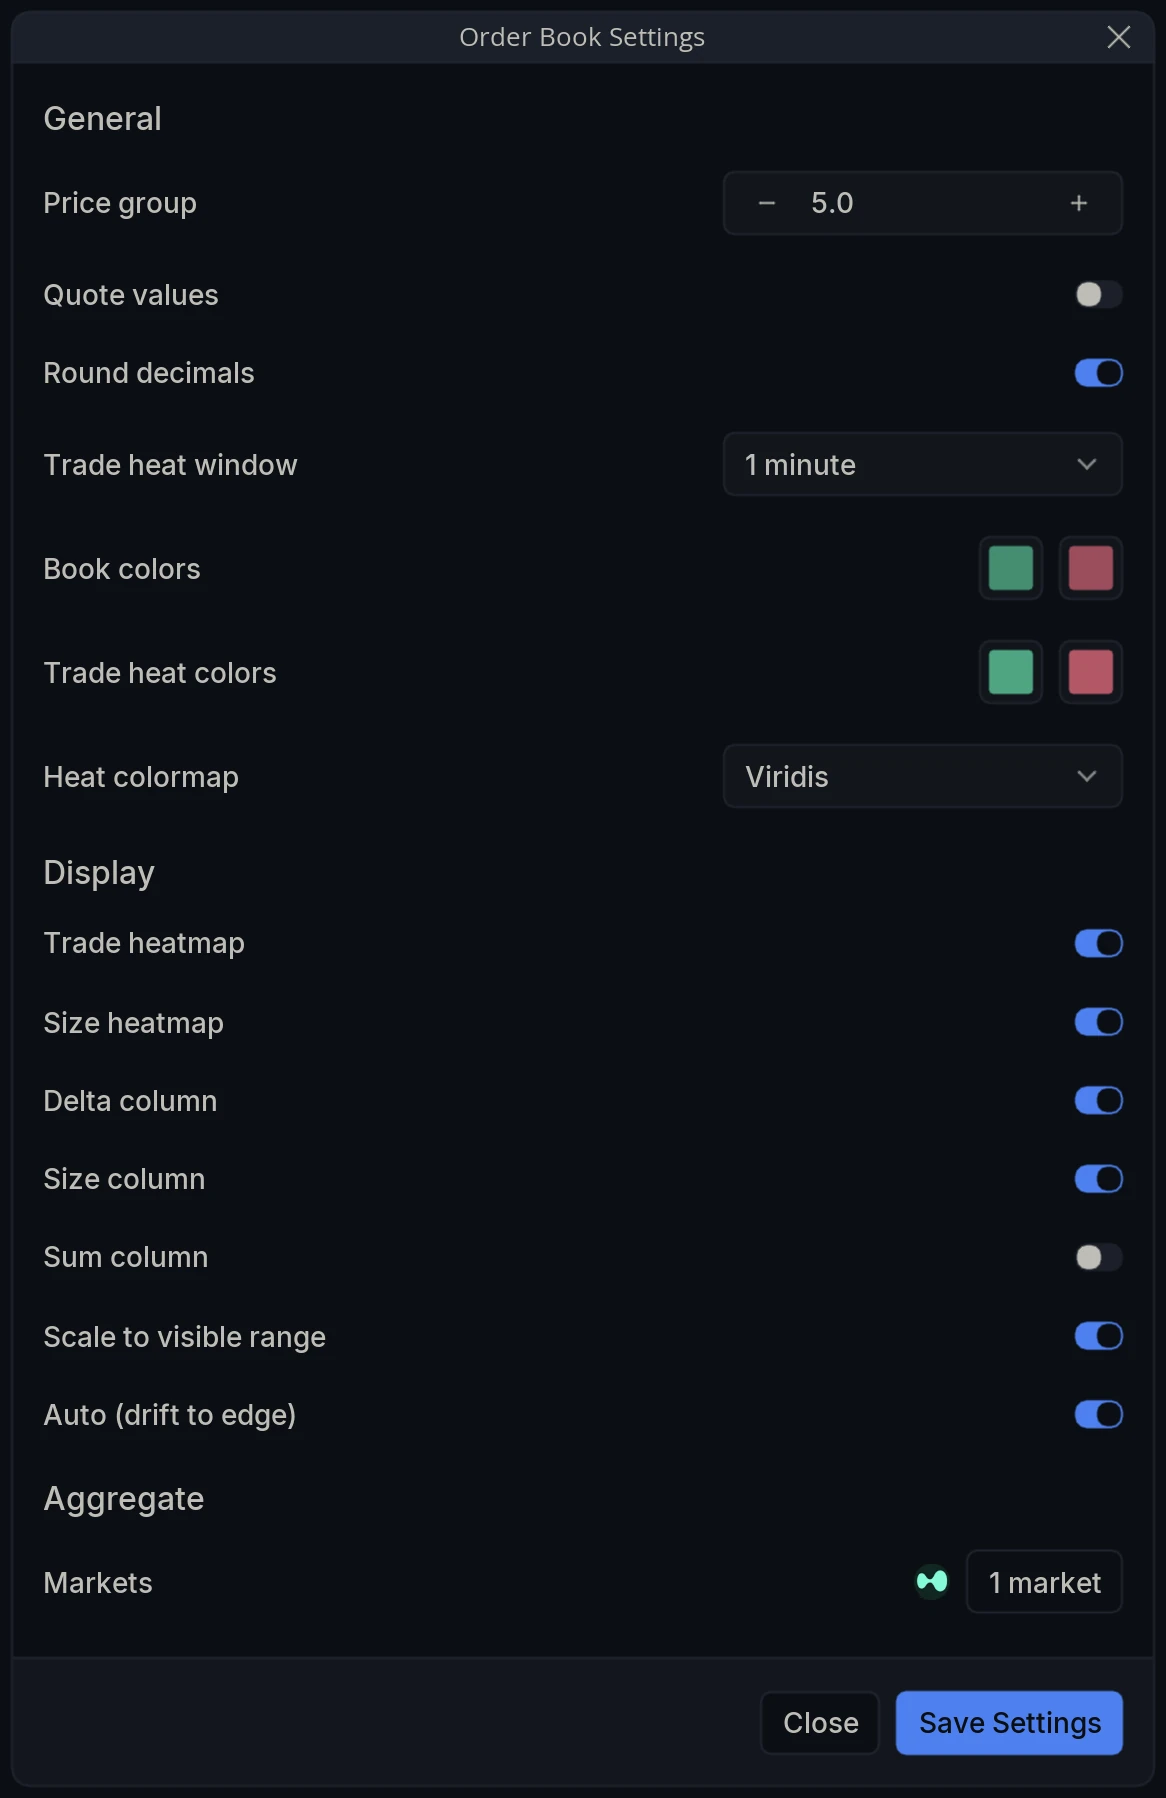
General
Price group - How many price levels are merged into each row: 0.1, 1, 5, 10, 50 or 100.
Quote values - Report sizes in the quote currency rather than the base asset.
Round decimals - Round the printed figures.
Trade heat window - How far back the trade overlay looks.
Book colors - The two colors used for bids and asks.
Trade heat colors - The two colors used for the trade overlay.
Heat colormap - The palette used to shade trade intensity.
Display
Trade heatmap - Show the outer strip of recent executions down the left of the ladder.
Size heatmap - Show the inner strip, shading each level by how much is resting there.
Delta column - Show how the size at each level is changing.
Size column - Show the quantity resting at each level.
Sum column - Show cumulative depth.
Scale to visible range - Scale the depth bars against what is currently on screen rather than the whole book.
Auto (drift to edge) - Let the price line drift and recenter when it reaches the edge.
Aggregate
Markets - Choose which exchanges’ books are included.