What is an order book heatmap?
By MichaelUpdated August 24, 2026
An order book heatmap is a chart that shows resting limit orders over time. Price runs up the chart and time across it, and the color of each cell shows how much size was resting at that price at that moment. Bright bands mark large concentrations of orders, dark areas mark a thin book.
How does an order book heatmap work?
An exchange publishes its order book continuously: the full ladder of bids and asks, with the size resting at each price. Live tools such as a depth ladder or DOM render that ladder as it stands right now, which is also their limitation - the moment liquidity changes, the previous state is gone.
A heatmap gives the book a memory. It records the state of the ladder at a fixed interval and places each reading beside the last, so the book becomes a two-dimensional picture rather than a single column. Size is encoded as color: dim for small orders, bright for heavy concentrations.
That history is what makes the tool useful. It shows whether a large order has been resting for hours or appeared seconds ago, whether a wall of offers was filled or withdrawn as price approached, and where the book is thin enough for price to travel without resistance. None of those questions can be answered by a ladder that only shows the present moment.
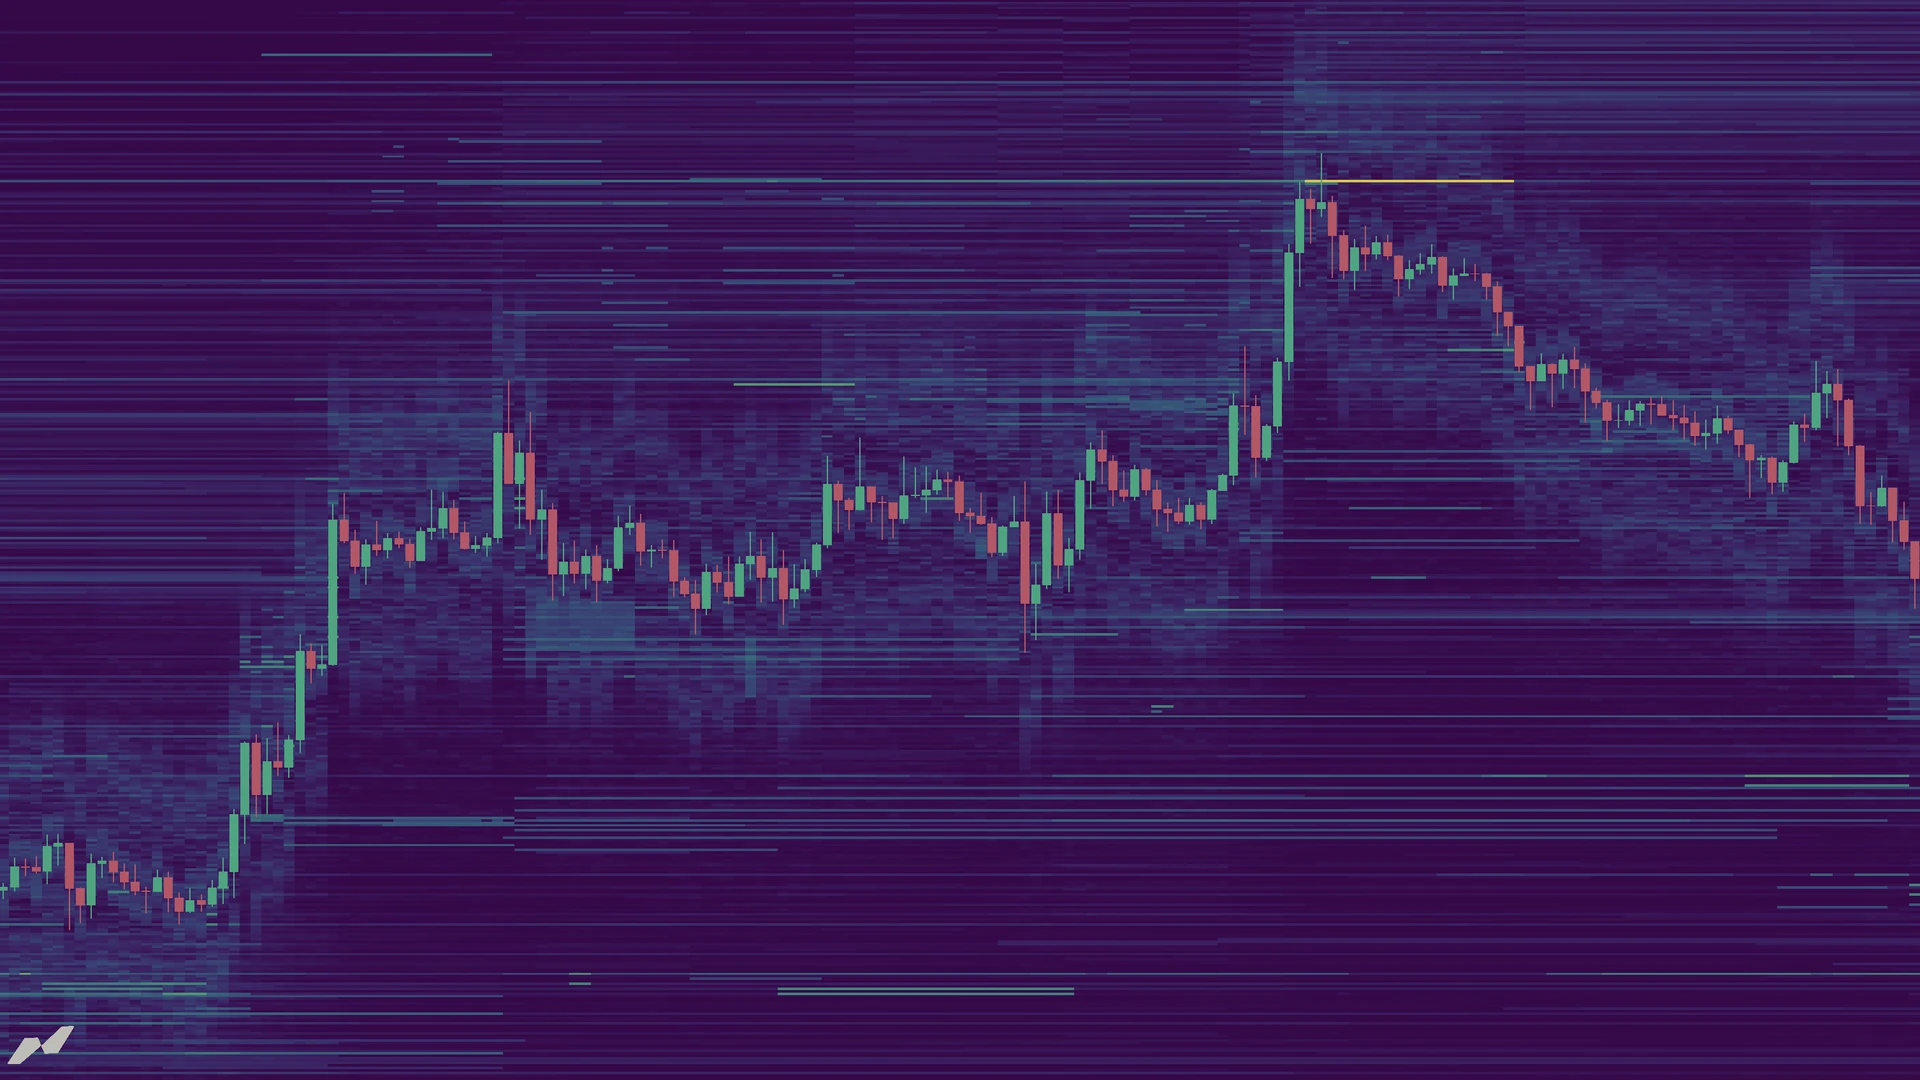
Alt text: “MMT Heatmap layer rendering historical order book liquidity across a price chart, with price rejecting from a bright ask liquidity band at the high.”
What is order book liquidity?
An order book is the list of all resting limit orders in a market: bids (orders to buy) below the current price, asks (orders to sell) above it. The size resting at each price is that level’s liquidity.
Liquidity determines how easily participants can transact. Deep liquidity at a price allows large market orders to fill with minimal slippage; thin liquidity means even modest orders can move price sharply. Large concentrations, often called walls, can act as barriers that absorb market orders, while thin areas offer little resistance.
That liquidity is never static. Limit orders are continuously entered, modified, pulled or filled, and the shape of the book changes second by second.
How do you read an order book heatmap?
Every row is a price group and every column is one reading of the book. Ask liquidity renders above the current price, bid liquidity below it, and the color of each cell encodes the size resting at that level when the reading was taken. The rightmost column is the live one: it flickers and re-grades in real time as orders enter, move and leave the book.
The smallest unit is a single block, and every block answers three questions at once: what price, what time, and how much.
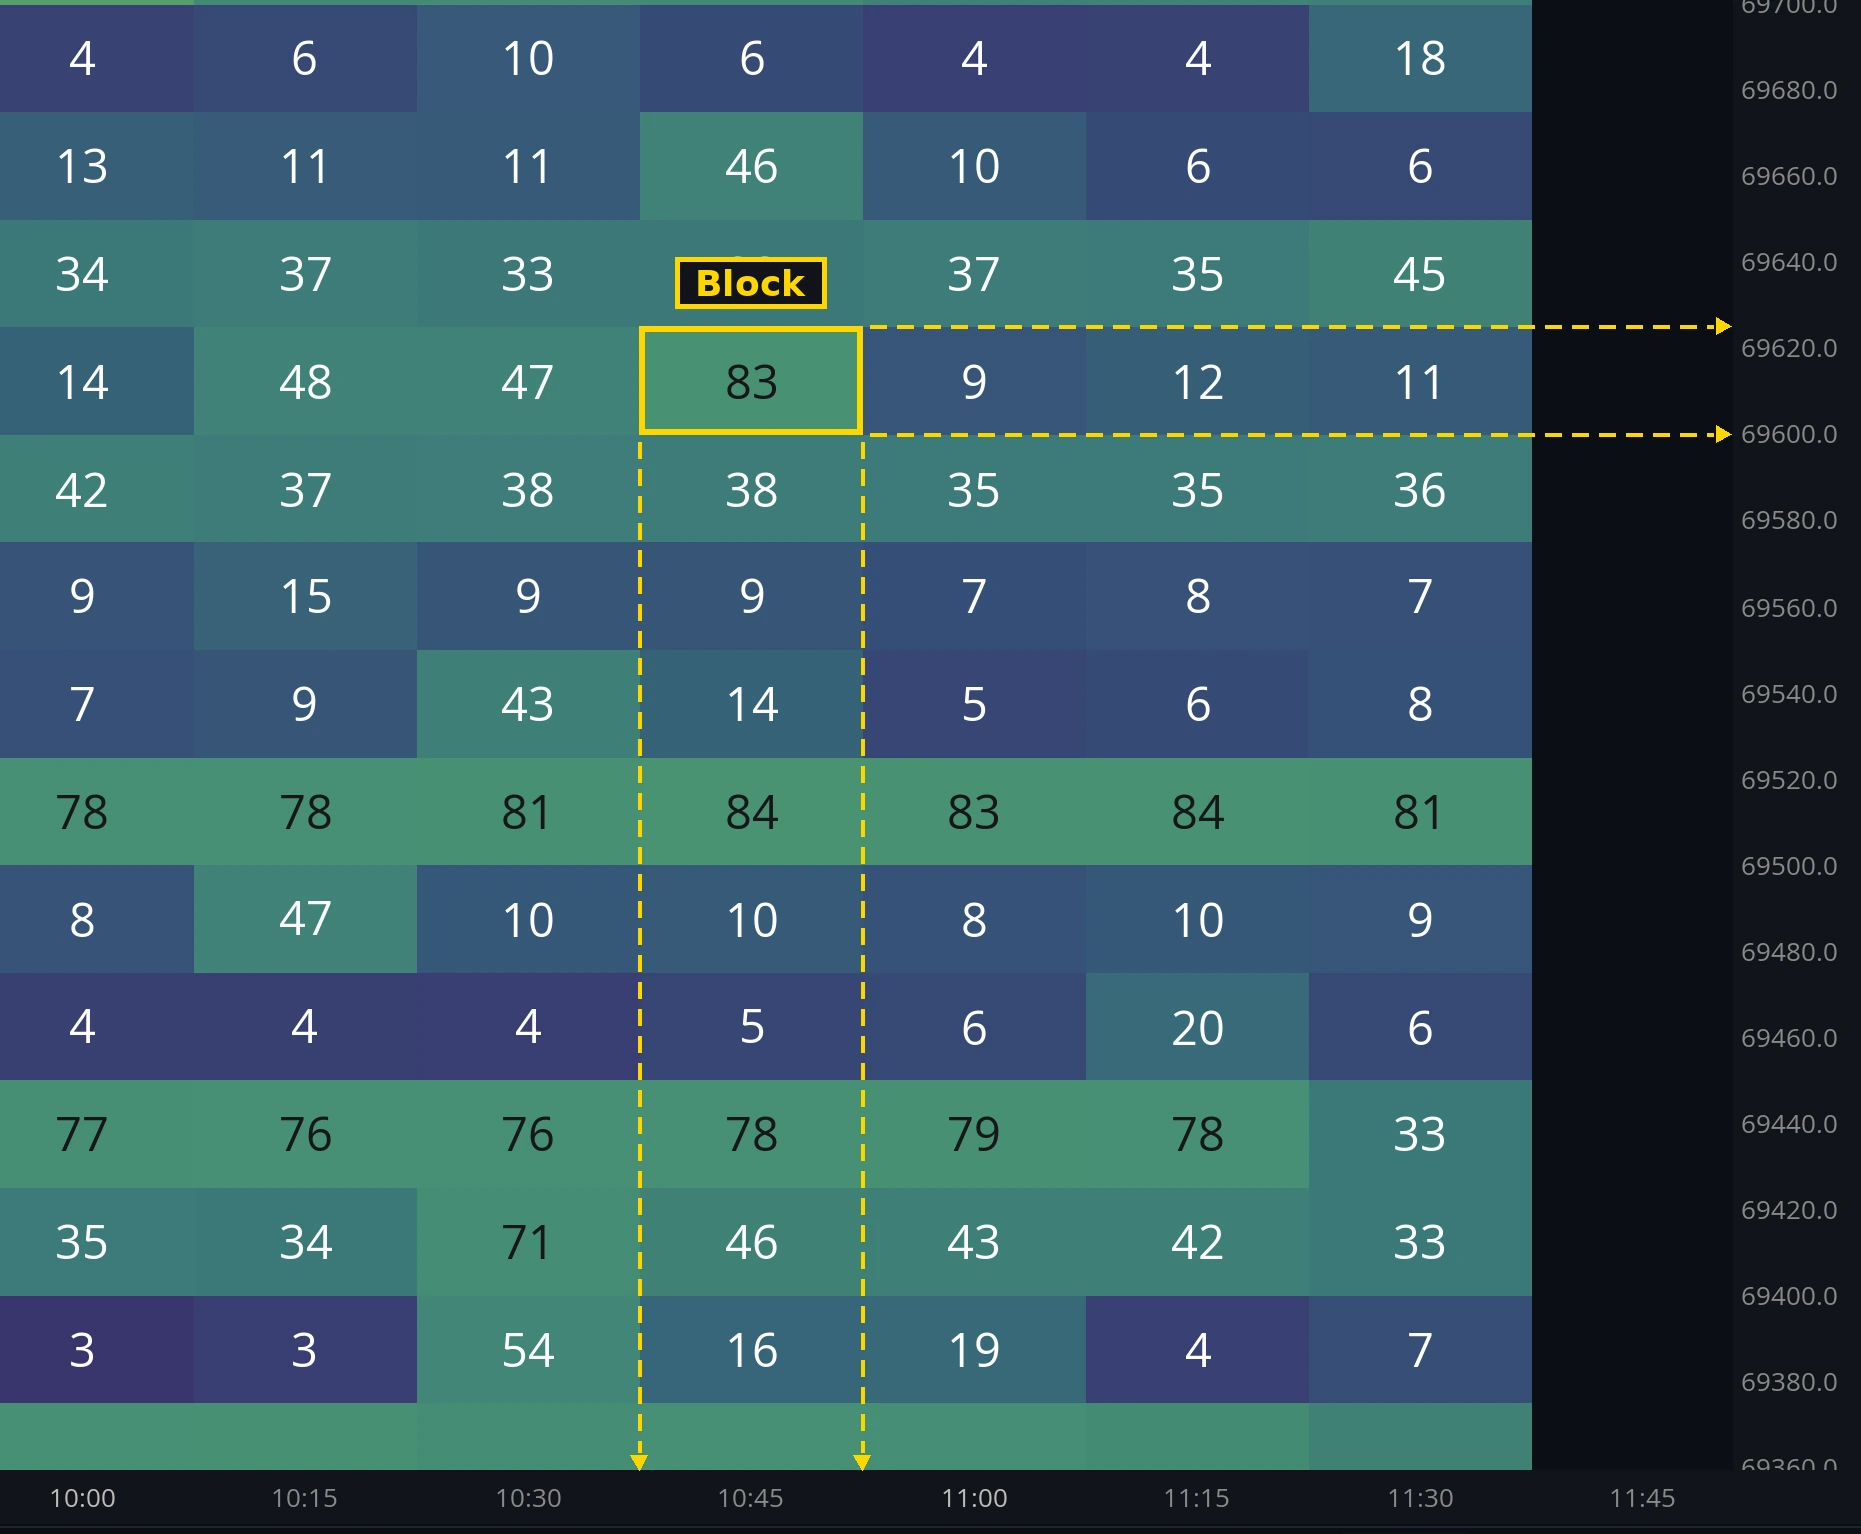
Follow the arrows out to the axes and the highlighted block resolves into a precise statement about the book. The two horizontal arrows run from the block’s top and bottom edges to the price axis, marking the price group it covers - here from 69600.0 up to 69625.0. The two vertical arrows drop from its left and right edges to the time axis, marking the period it represents - the fifteen minutes from 10:45. The number inside it, 83, is the liquidity that was resting in that price range during that period, and the block’s color encodes the same value, which is what makes the heatmap readable when you zoom back out and the numbers disappear.
Because the horizontal axis is time, shape matters as much as brightness. A thin bright line running unbroken across the chart is a single resting order that has sat untouched for the whole window. A block of texture is liquidity being actively worked - added, amended, replaced. And darkness is information too: a dark region is a thin book, a stretch of prices where little size is resting and price can travel with almost no friction.
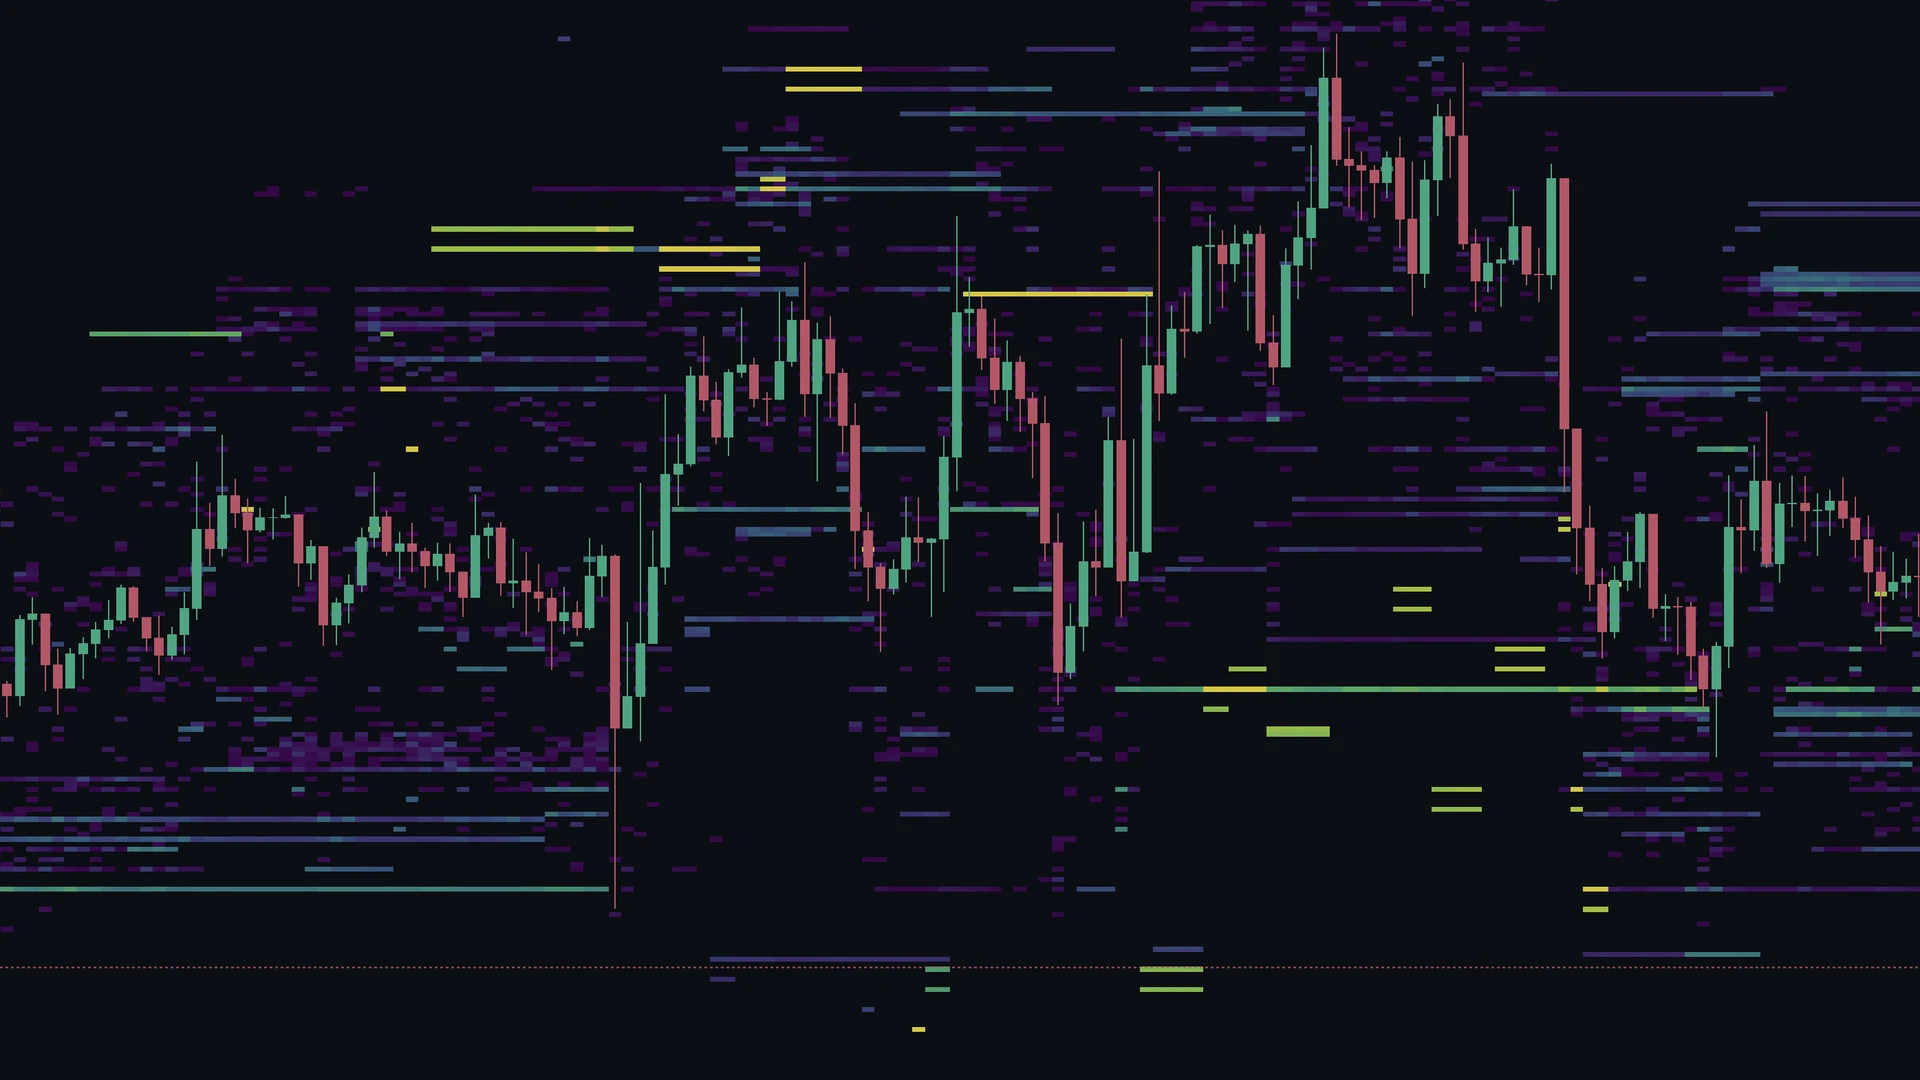
Alt text: “Heatmap on a price chart showing ask liquidity bands above the current price, bid liquidity below, and dark low-liquidity regions between them.”
In the image above, the bands stacked above the current price are resting asks and everything beneath it is resting bids. Note the difference between the long, unbroken lines - orders that have rested at their price for the whole window - and the patches of shifting texture around them, which is liquidity being repositioned candle by candle. The empty, near-black stretches between the bands are the thin parts of the book.
What is a liquidity wall?
A wall is a concentration of resting orders large enough to stand out from everything around it: on a heatmap, a bright band that persists.
Persistence is the part a live ladder can never show. A wall that has rested for hours and absorbed multiple tests is a very different object from size that appeared thirty seconds ago. The heatmap gives every wall a track record - how long it has been on the book, whether price has tested it, and what happened on each test.
When price trades into a wall and stalls, the wall is absorbing market orders. Watch how the band behaves on contact: one that holds its brightness through a test has soaked up the aggression and is likely still intact, while one that dims as price grinds into it is being consumed, and each retest meets less size than the one before.
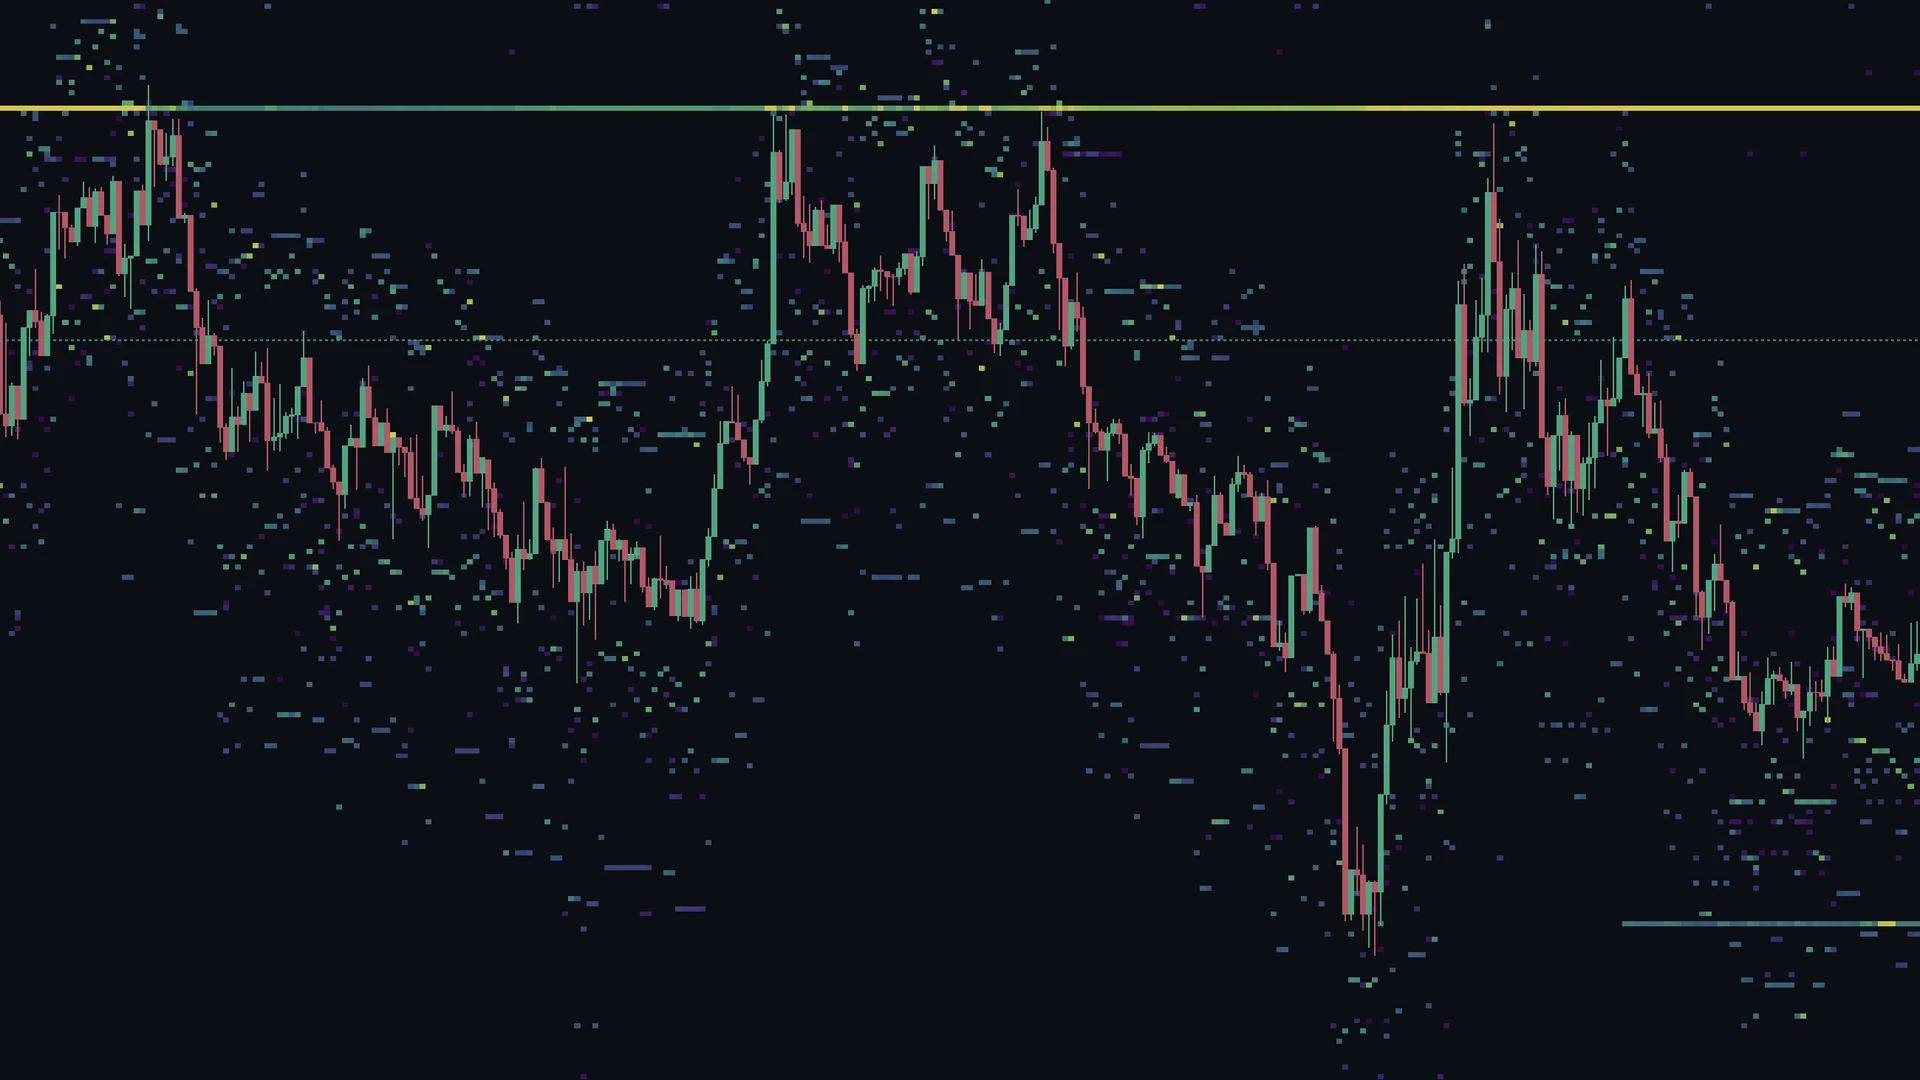
Alt text: “Price rejecting three times from a persistent ask liquidity wall visible as a bright horizontal band on the heatmap.”
Here the bright band had been resting long before price reached it - you can trace it back across the chart, unbroken. On each contact, price stalls and rejects rather than cutting through, and the band remains bright after every test: the resting size absorbed the buying pressure and stayed on the book. That combination - visible history before the touch, absorption during it, brightness after it - is what separates a real wall from decoration.
What is spoofing on a heatmap?
Not every order on the book is there to be filled. Size can be placed to be seen - to project support or resistance - and then withdrawn the moment it risks execution. On a live ladder this is nearly impossible to catch: the order simply is not there anymore, and you are left wondering whether it was filled or vanished.
On a heatmap the difference is unmistakable. A filled order dies at the moment price trades through it. A pulled order’s band simply stops, cut off mid-chart with price still approaching, leaving a bright line that ends in nothing.
This matters most when you were counting on that liquidity. A level that looks well defended can turn hollow in a single reading, and price often accelerates through it precisely because the size everyone could see is suddenly gone. A heatmap also exposes the repeat offenders: liquidity that blinks in and out at the same level, approach after approach, is telling you the size there is not committed.
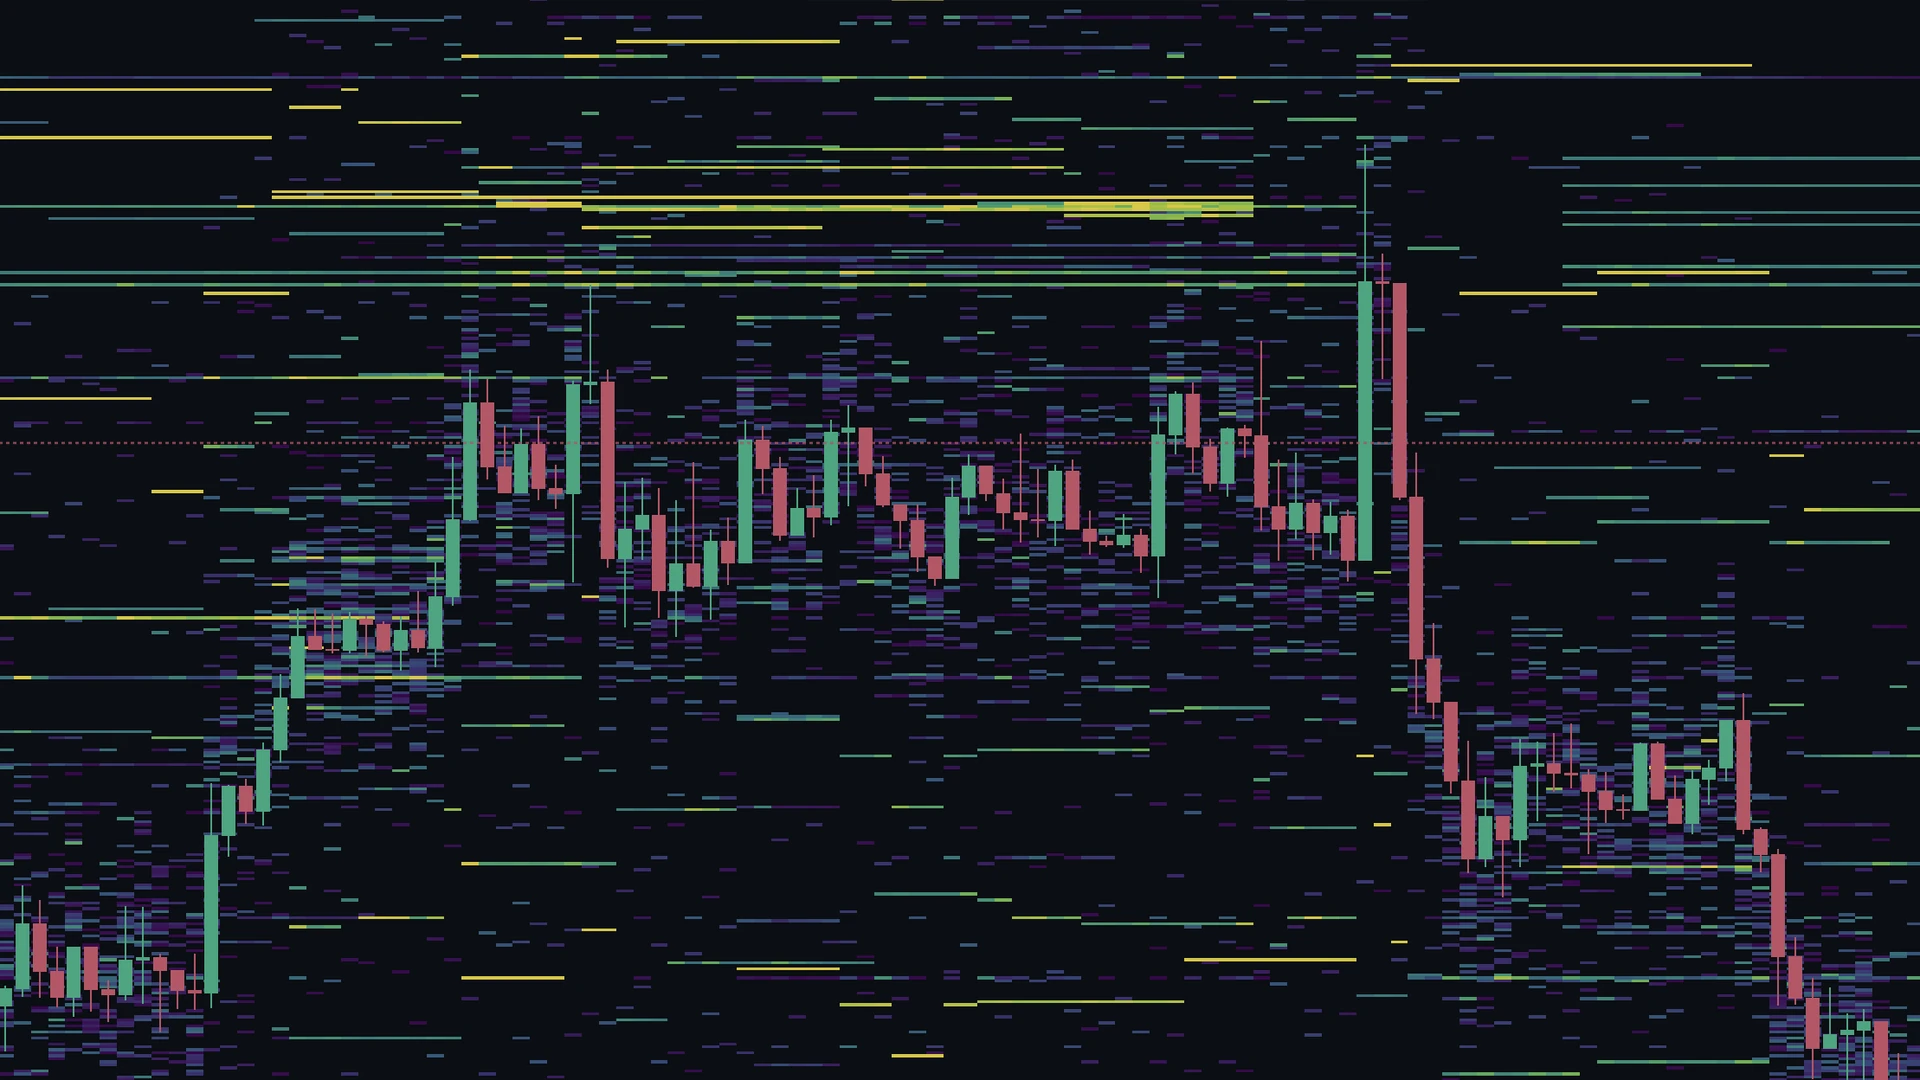
Alt text: “A bright liquidity band on the heatmap ending abruptly as price approaches, showing resting orders pulled before execution.”
In this example a whole shelf of bright bands sits above the market, holding steady for hours while price ranges beneath it. Then, with price still some distance away, the shelf simply stops - the bands cut off mid-chart, without price ever reaching them. Nothing was filled; the size was withdrawn. Note what happens immediately afterwards: price runs up into the space those bands had occupied in a single candle, meeting none of the resistance the book had been advertising.
Why does price move toward liquidity?
Large resting size does not just block price, it attracts it. Substantial orders represent counterparties willing to transact in size, and markets gravitate toward the prices where business can be done. A dominant bright band above or below the market frequently behaves as a target: price works toward it, reaches it, and only then decides - absorb and reverse, or consume and continue.
The corridors between walls tell the other half of the story. Where the heatmap is dark there is little resting size to slow anything down, so price tends to cross those stretches quickly. Read together, walls and voids sketch a map of where the path of least resistance runs: toward size, through emptiness.
When strong walls rest both above and below the market, the effect works in both directions at once and the result is a range. Price is drawn toward one wall, absorbed, turned back, and drawn toward the other, with the thin book in between offering nothing to hold a move mid-way.
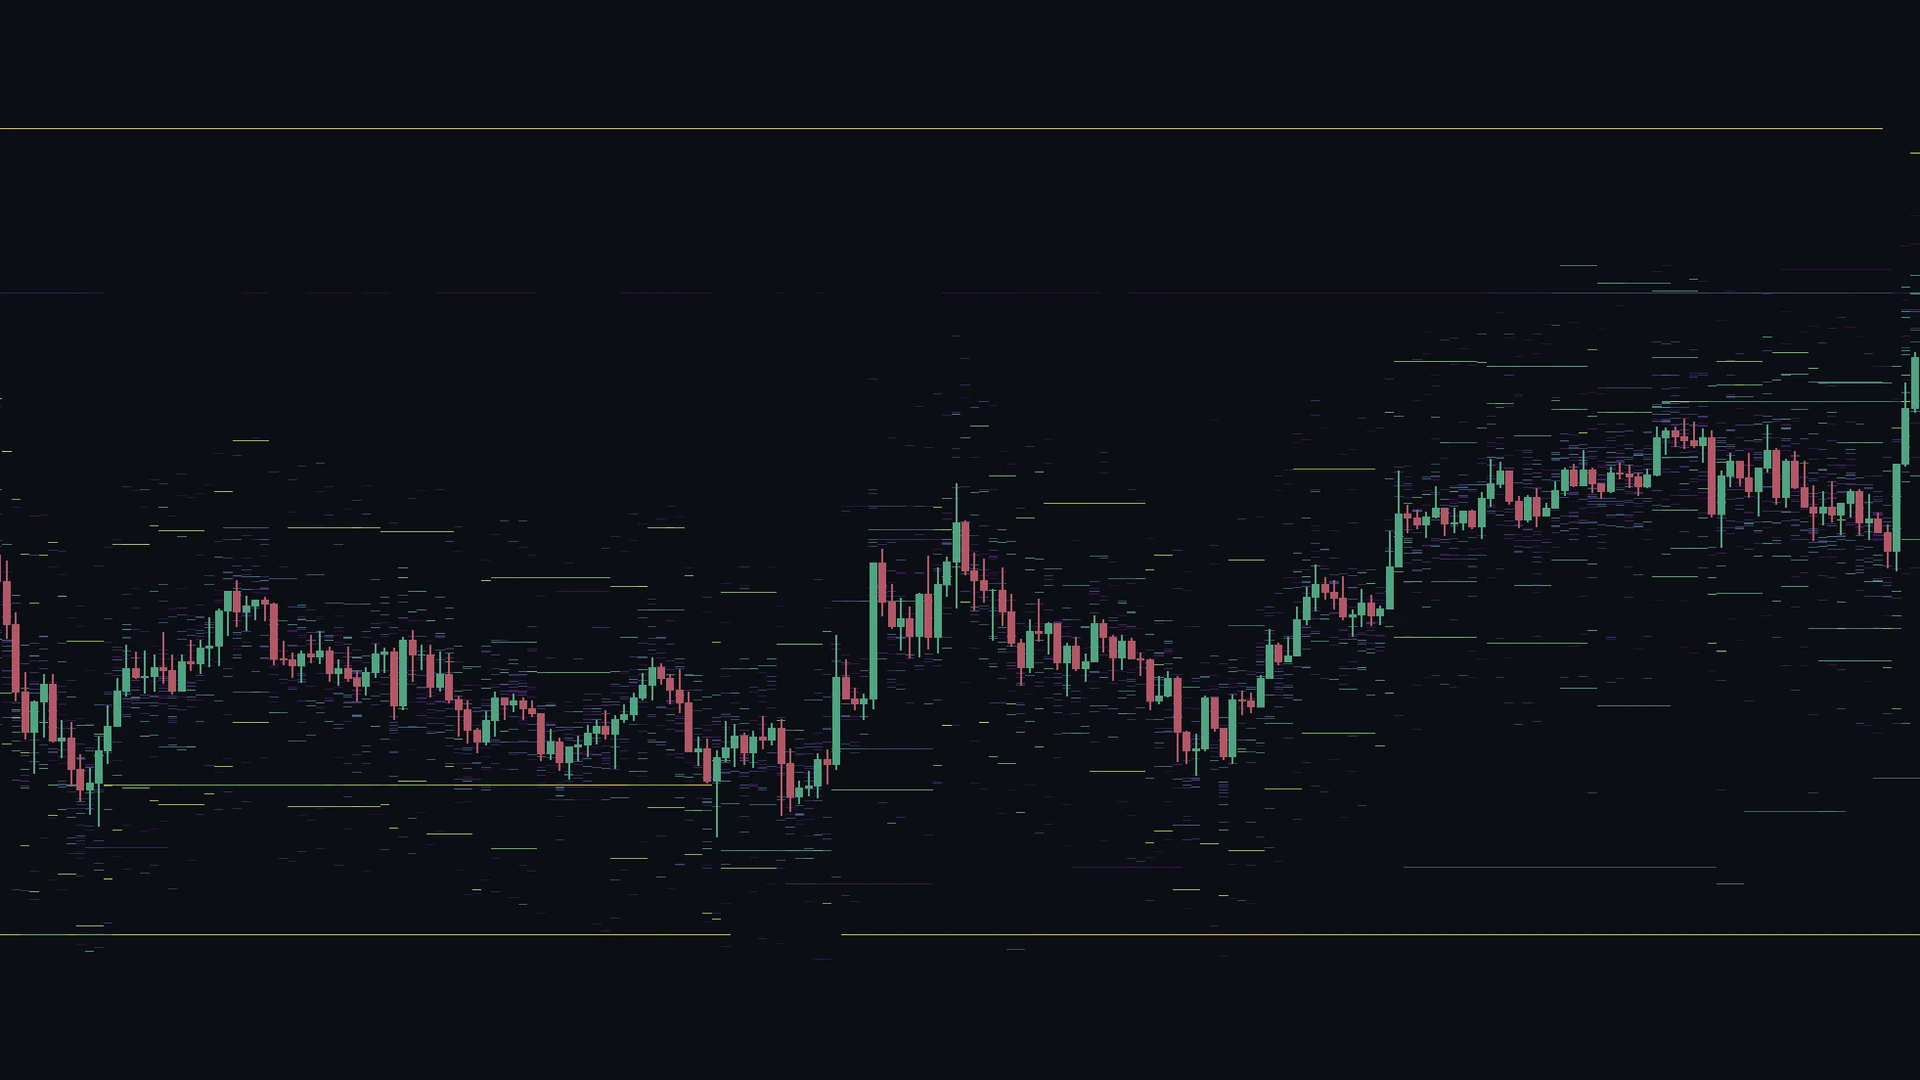
Alt text: “Price falling quickly through a dark low-liquidity zone on the heatmap and reversing as it reaches a large resting bid liquidity band.”
Both boundaries are visible here at a glance: an ask wall running unbroken across the top of the frame, a bid wall running across the bottom, and price oscillating in the thin book between them. Every swing inside the range travels through near-black, low-liquidity space, while the walls at the extremes sit untouched, turning the market back each time it works toward them.
Alt text: “Price kept range bound by walls above and below”
Tip: The walls that bound a range are also its early-warning system. If one of them dims or vanishes, the boundary is going with it - watch for the break in that direction.
Why aggregate liquidity across exchanges?
No single venue holds the whole picture. The same asset trades across many exchanges at once, and the size that actually matters may be resting on a book you are not watching. Some venues also restrict the order book depth they publish, so their heatmaps alone can only ever show a slice of what is really resting.
Watching several charts side by side is the traditional answer, but comparing books visually in real time means subtle shifts on any one venue are easily missed. Combining them into a single view solves that: liquidity from every selected venue is overlaid into one heatmap, so a wall that exists on only one exchange, or one that spans several, appears in a single picture.
Related: Depth of Market (DOM) · Order book · Footprint charts
Using the heatmap in MMT
MMT’s Heatmap layer records a snapshot of the order book immediately before each candle closes and stitches those snapshots into a continuous history behind price. The live candle’s slice updates in real time, so the right edge always reflects the current market. Color mapping, resolution, aggregation and the on-chart reading tools are all configurable, and the sections below cover each in turn.
How do you add the heatmap to a chart?
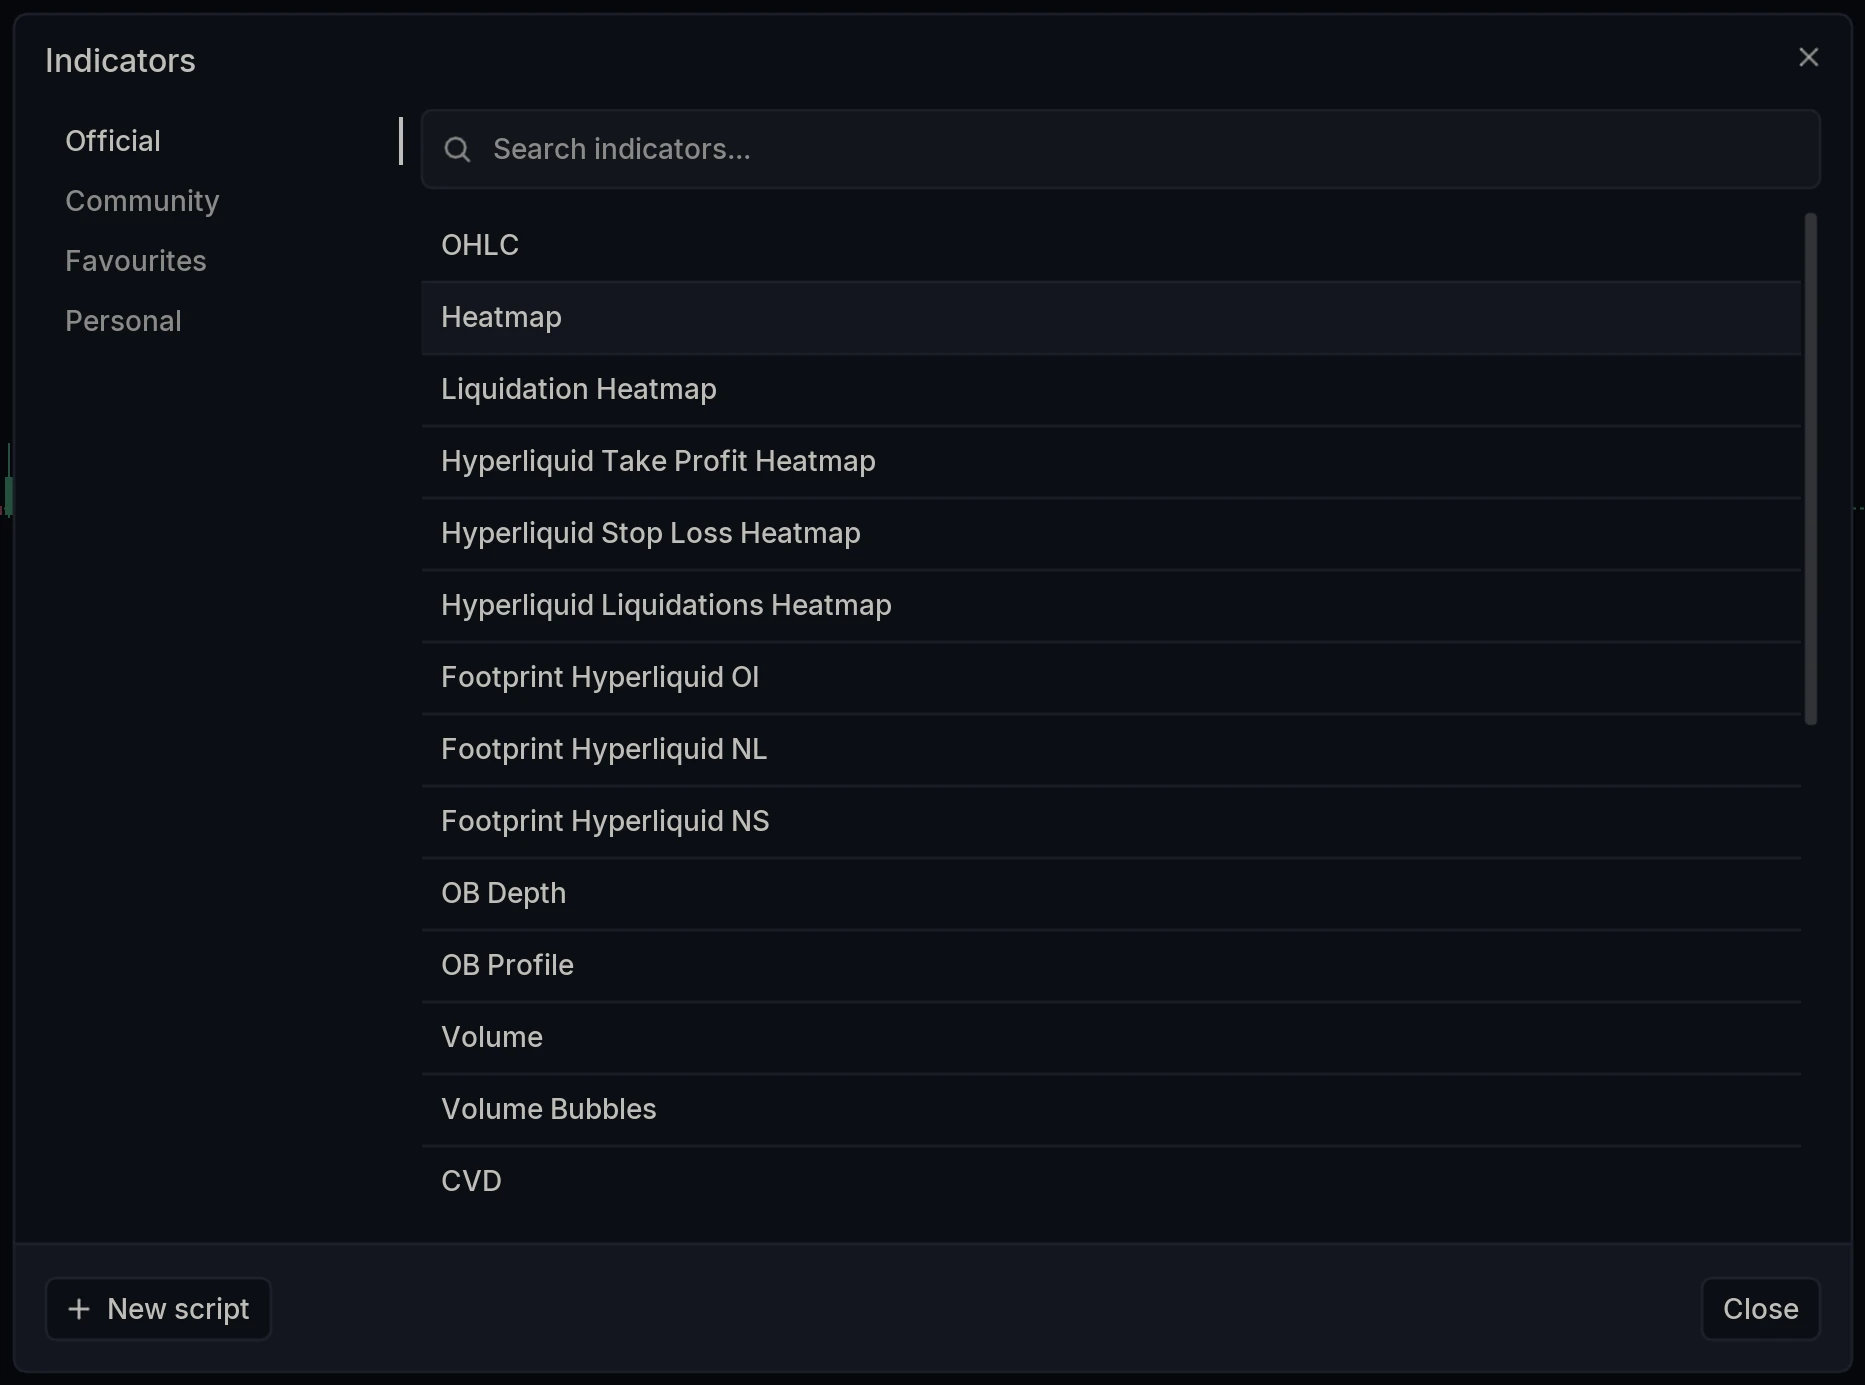
New charts include the Heatmap layer automatically. To add it manually - after removing it, or on a custom layout - open the Indicators dialog and select Heatmap under Official. The layer initializes and renders across the price chart immediately. The Search indicators… field finds it fastest on a long list.
How do you aggregate exchanges?
Markets are selected in the Aggregate tab of the settings panel. Each market added or removed re-triggers a recalculation of the heatmap.
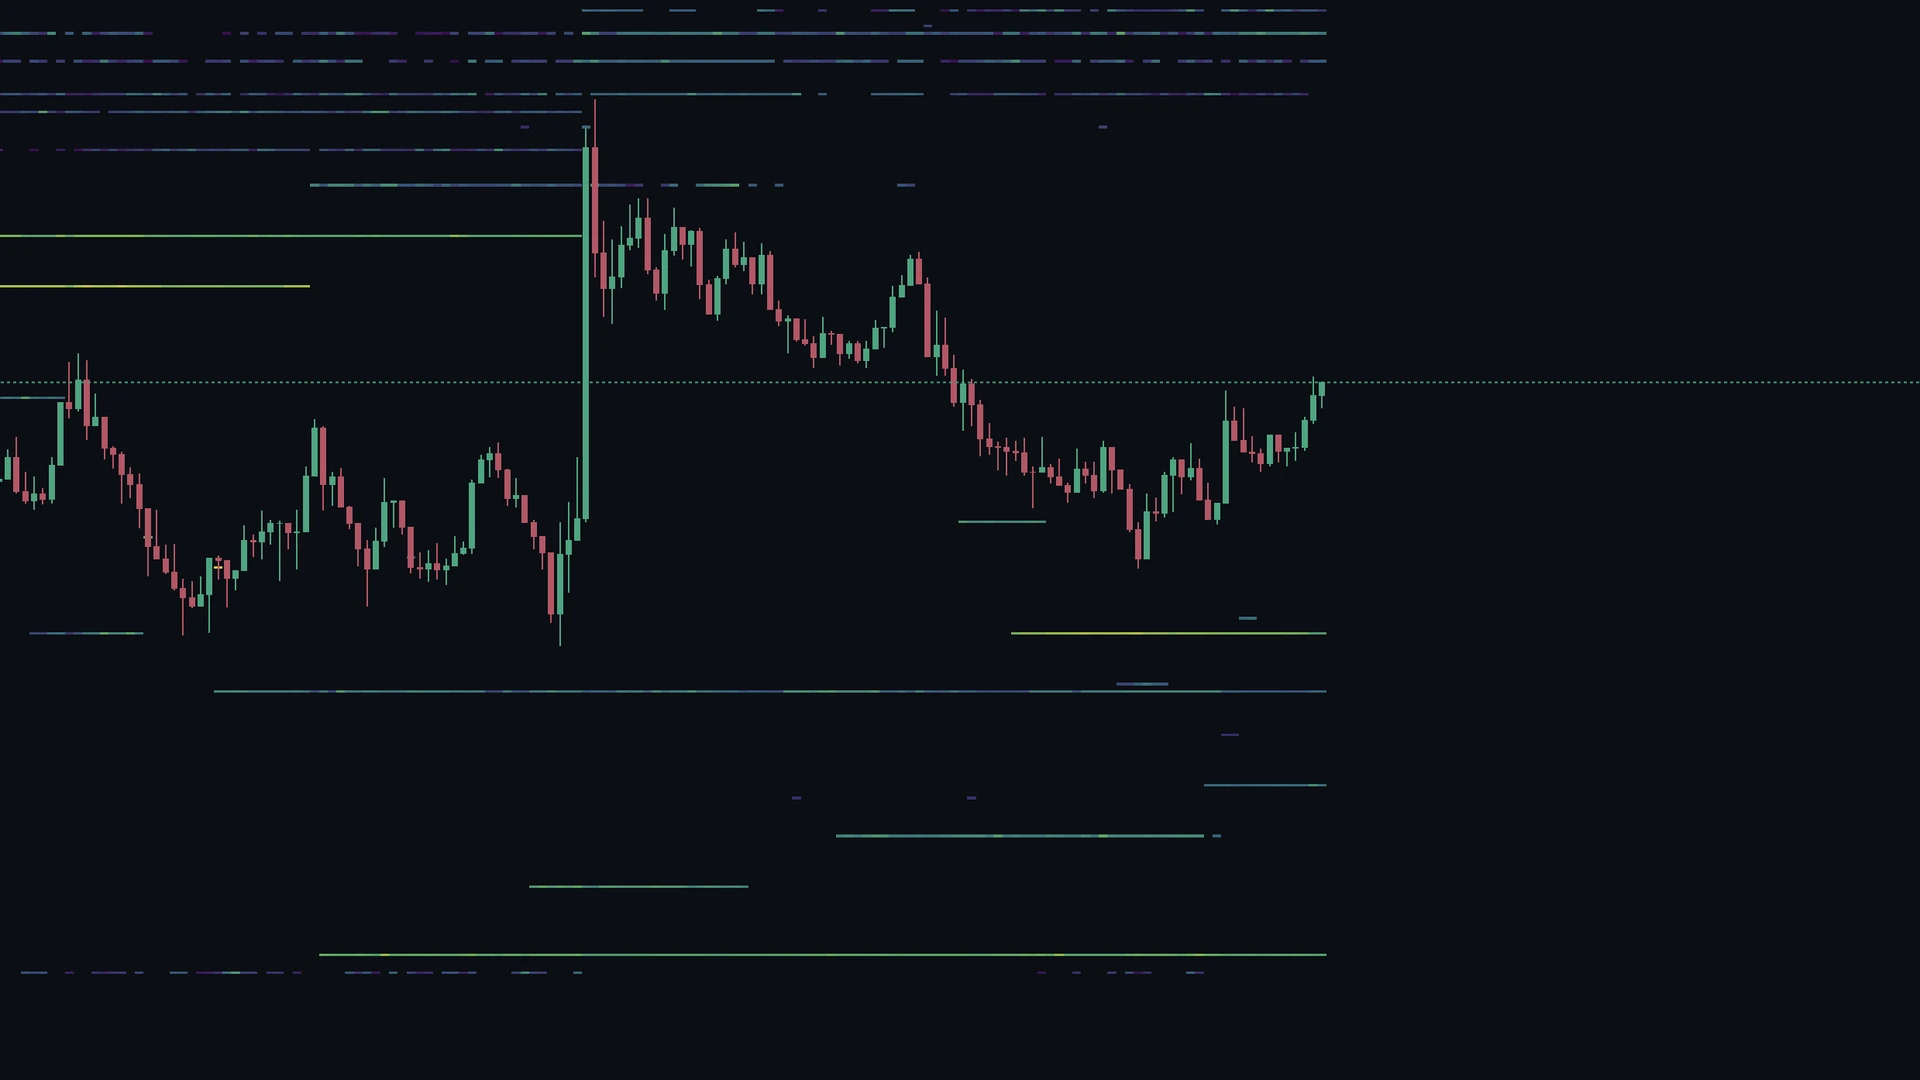
[COMPARISON SLIDER: heatmap-agg-single.webp - “Single market” | heatmap-agg-aggregated.webp - “Aggregated”]
The difference is structural, not cosmetic: levels that looked bare on the single book show meaningful size once other venues are overlaid, and the walls that appear on every venue at the same price stand out as the levels the whole market is defending.
Tip: Aggregation is especially valuable on venues that publish limited order book depth - combining markets recovers context that a single restricted book cannot provide.
Layer Settings
Open Heatmap Settings via the cog wheel on the layer name, or from the gear in the Quick toolbar. The panel is organized into three tabs: General, Interaction, and Aggregate.
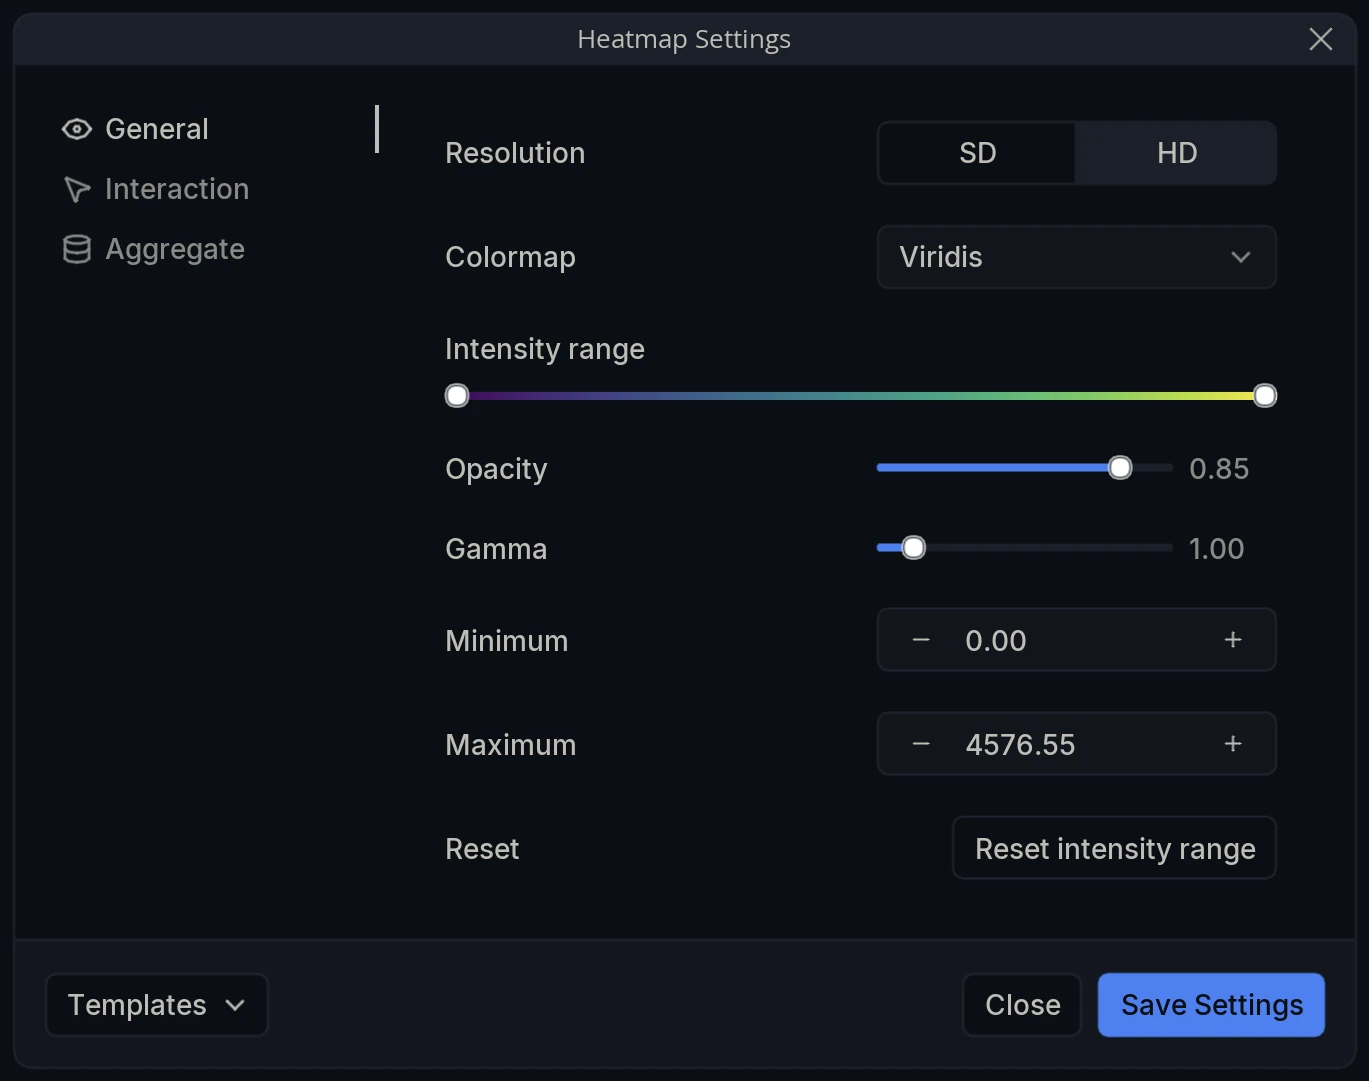
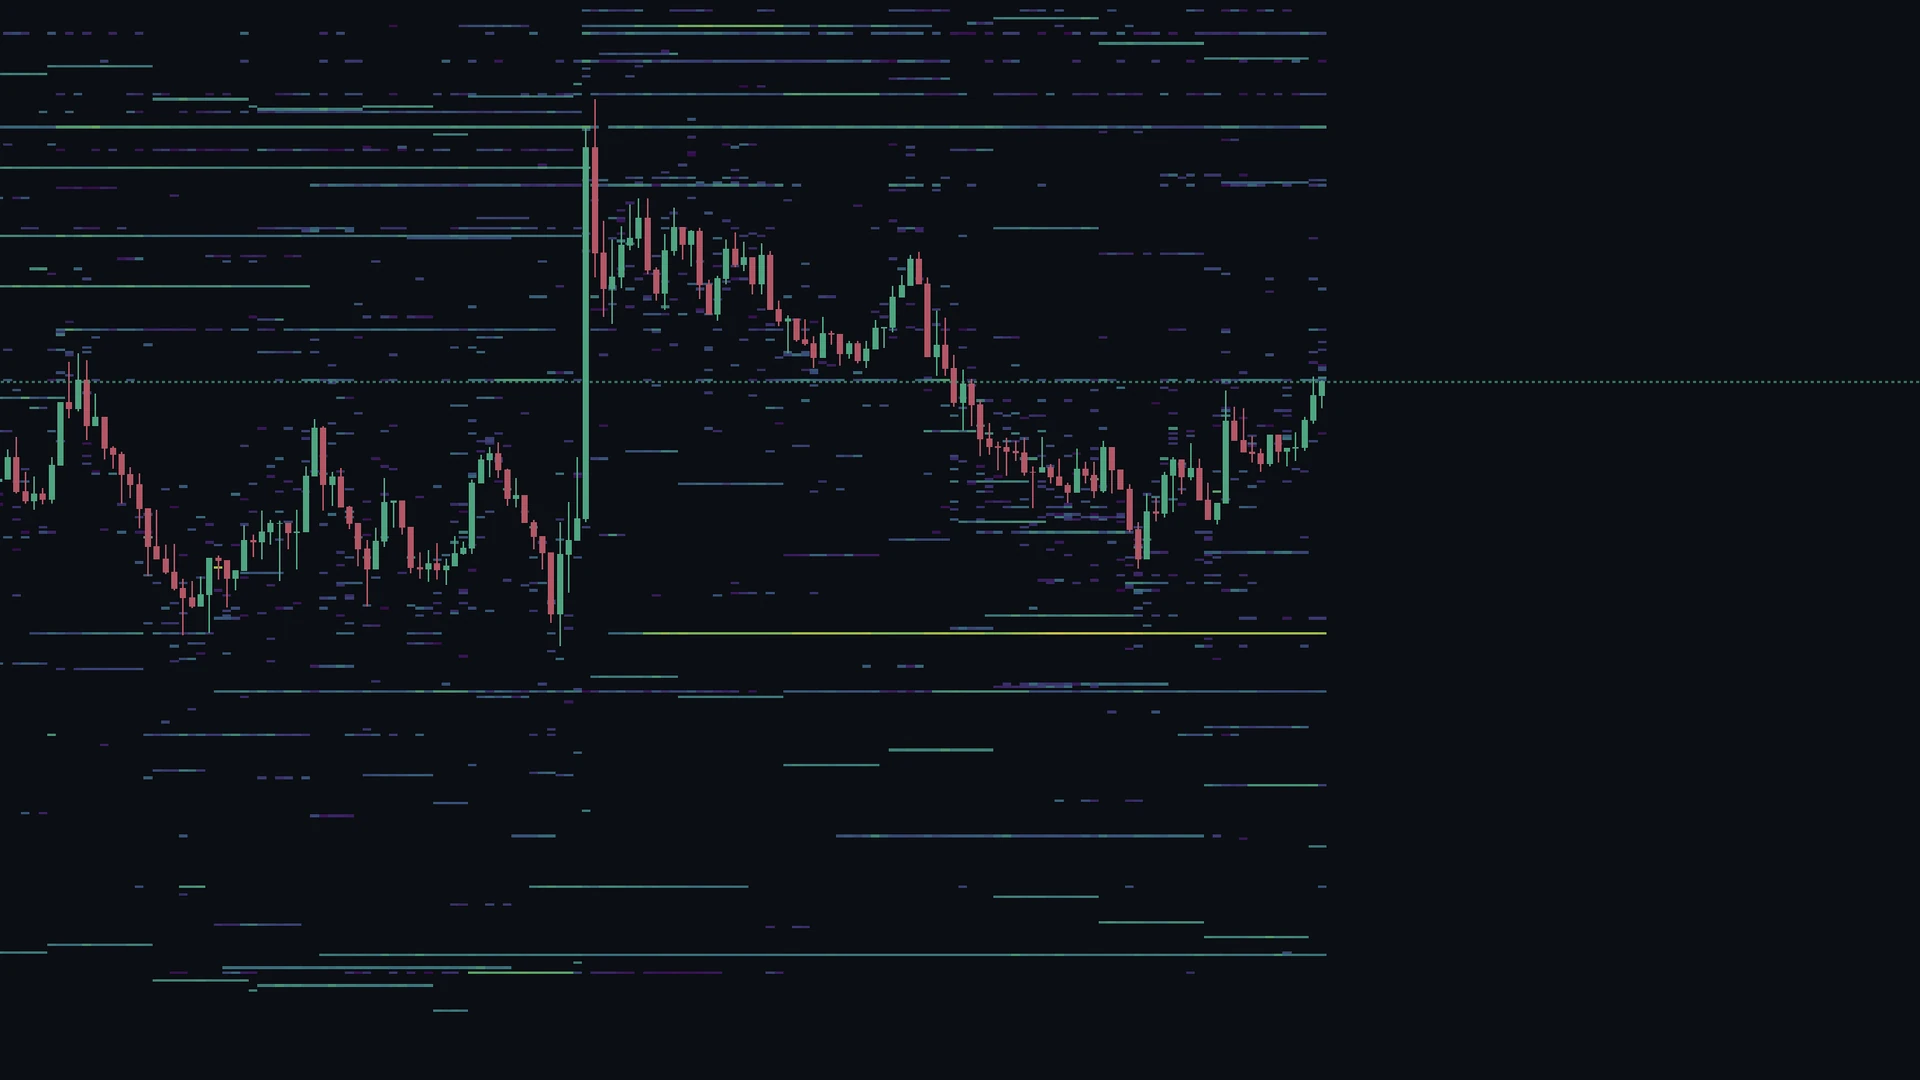
Resolution - Switch between SD and HD (Pro). SD aggregates Order Book levels into larger price groups, suited to higher timeframes; HD renders at maximum granularity for precise, lower-timeframe analysis.
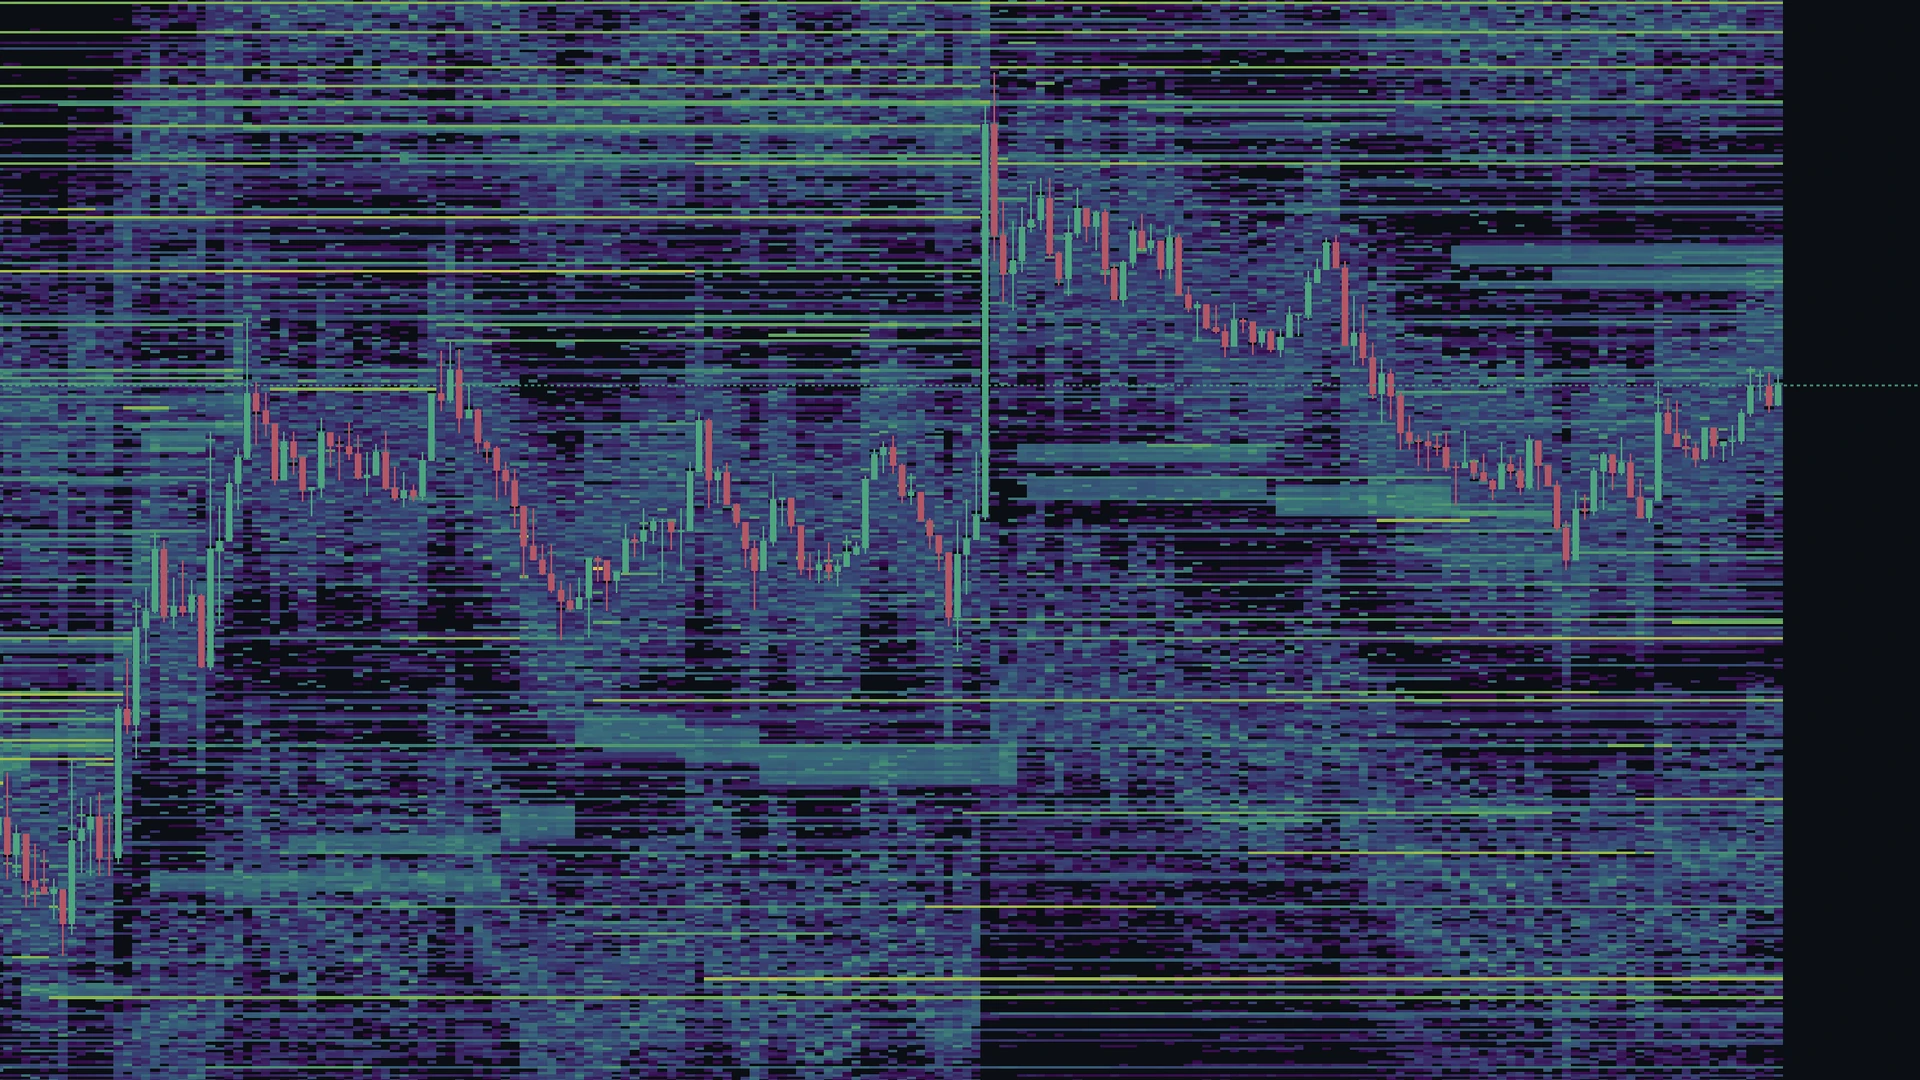
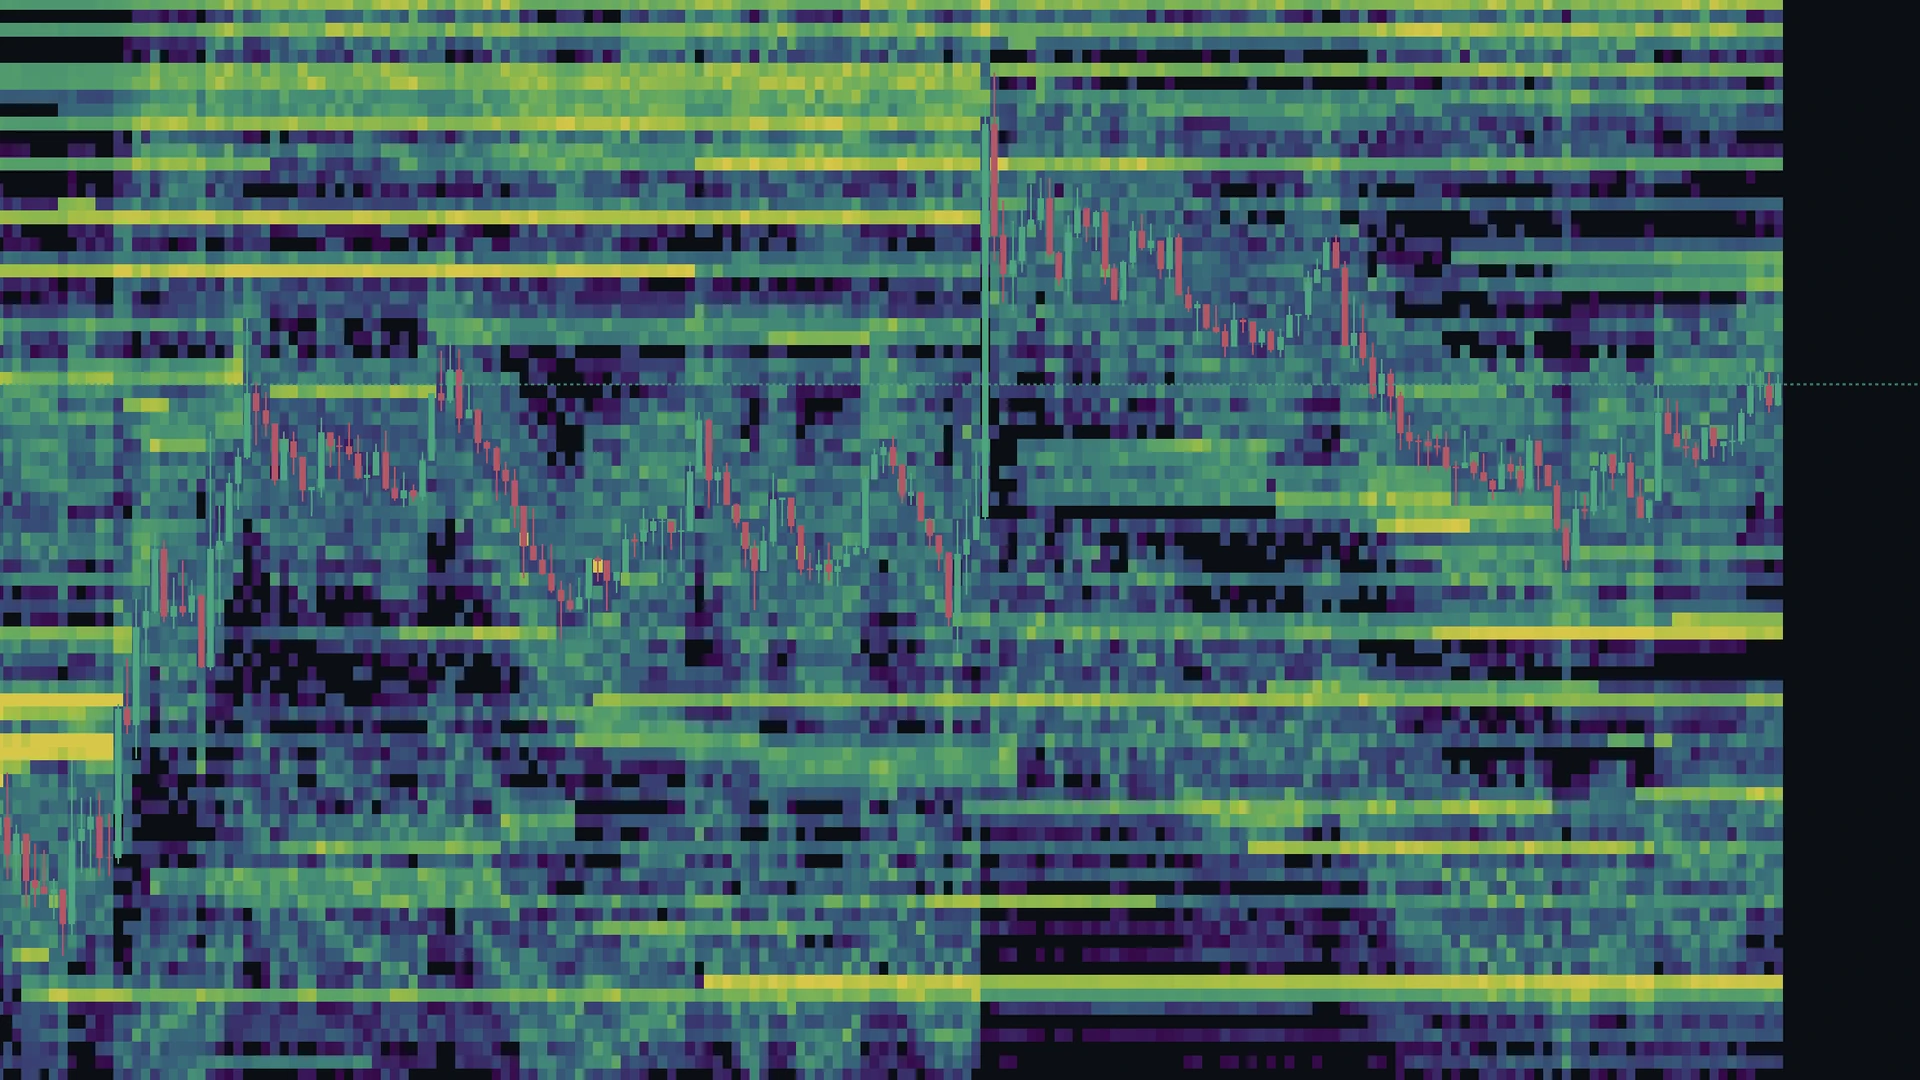
[COMPARISON SLIDER: heatmap-sd.webp - “SD” | heatmap-hd.webp - “HD”]
(Pending retake - see note: SD saturates at the current intensity range.)
Colormap - Choose from 27+ color themes. Custom colormaps also appear here once created.
Tip: Create your own colormap - and share it with other users - from the main settings cog wheel: Theme, scroll down to Custom colormap, then New colormap.
Intensity range - Set the band of liquidity values mapped across the colormap. Values below the lower handle render at the colormap’s floor; the upper handle sets the size at which the most intense color is reached.
Alt: “The intensity range slider on the Quick toolbar being adjusted, with the heatmap re-grading in real time as the handles move.”
Opacity - Control how strongly the heatmap renders over the chart. Lower values let candles and other layers show through.
Gamma - Bend the color curve between the intensity bounds. Adjust to bring out mid-sized liquidity without flattening the contrast of the largest levels.
Minimum / Maximum - Numeric bounds of the intensity range: the exact liquidity values pinned to each end of the colormap, for precise control beyond the slider.
Reset - Reset intensity range returns the intensity bounds to their defaults for the current market.
Interaction
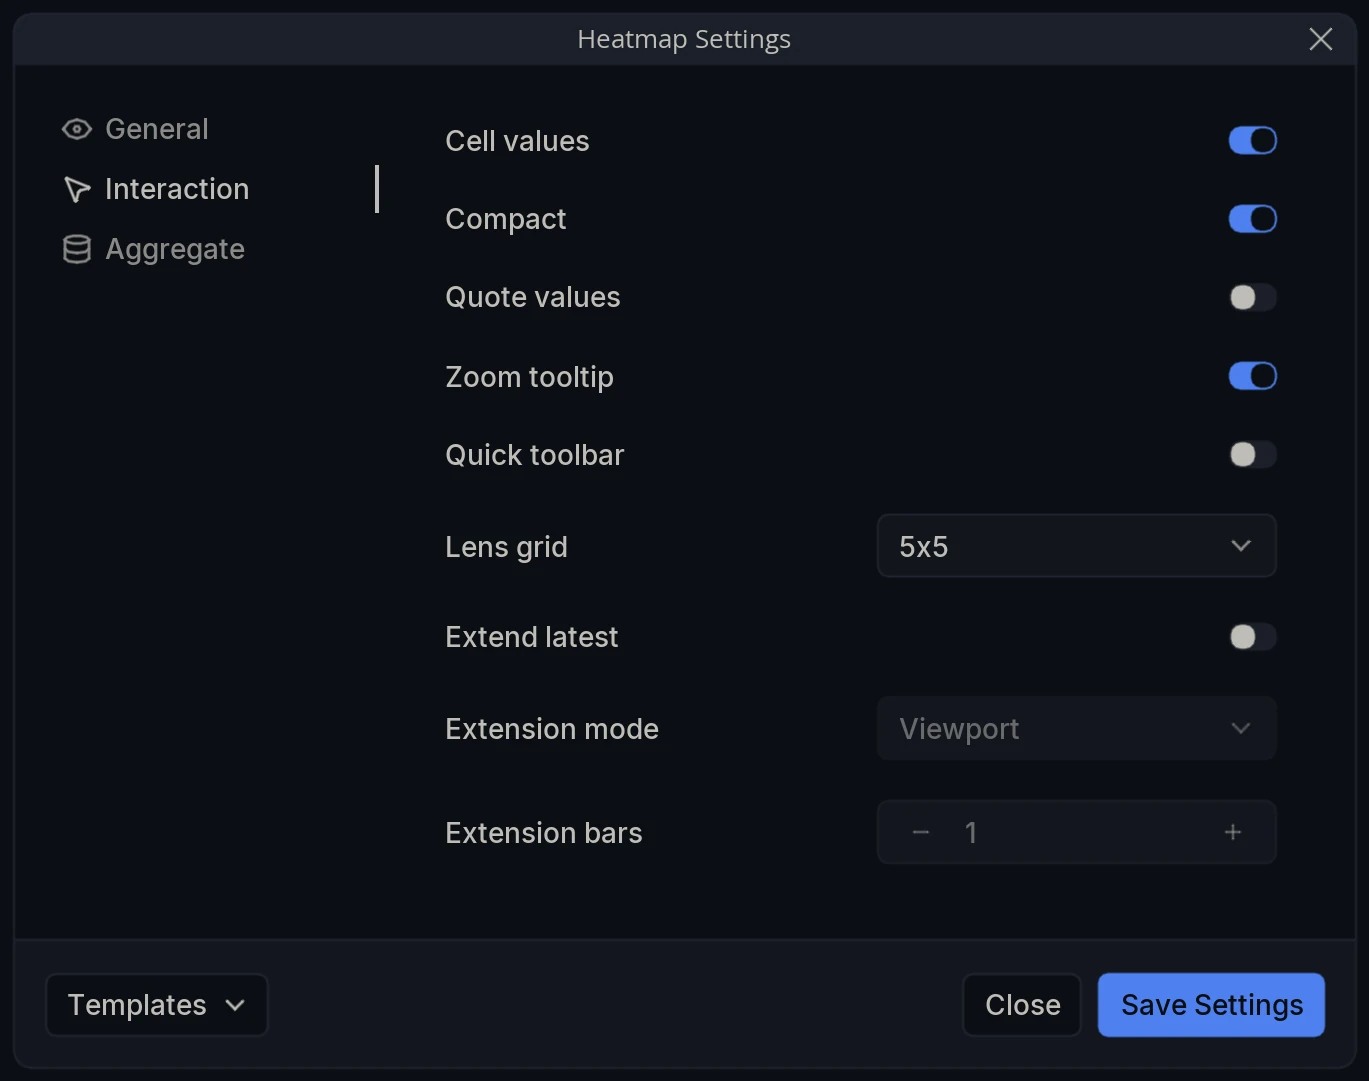
Cell values - Display the numeric liquidity value inside each heatmap cell. When off, cells render as color shading only.
Compact - Round displayed values into shorter figures (e.g. 1.2K) for a cleaner read.
Quote values - Show cell values in the quote currency rather than the base asset.
Zoom tooltip - A magnifying lens that follows your cursor, giving a detailed close-up of the heatmap without zooming the chart itself.
Alt: “The Zoom tooltip magnifying a region of the heatmap under the cursor, showing liquidity values in a 5x5 grid.”
Quick toolbar - Show the on-chart toolbar with the intensity range slider and quick access to Heatmap Settings, so day-to-day tuning never requires opening the panel.
Quick toolbar - Show the on-chart toolbar with the intensity range slider and quick access to Heatmap Settings, so day-to-day tuning never requires opening the panel.

Lens grid - Set the dimensions of the Zoom tooltip’s magnifier grid (e.g. 3x3, 5x5).
Extend latest - Project the live candle’s heatmap column rightward across the chart, updating in real time with the Order Book. Useful for monitoring live liquidity conditions against future price space.
Extension mode - Choose how far the extension reaches: Viewport extends to the right edge of the chart; Fixed bars extends a set number of bars.
Extension bars - The number of bars to extend when Extension mode is set to Fixed bars.
Alt: “The Extend latest setting being toggled in the Heatmap Settings panel.”
Aggregate
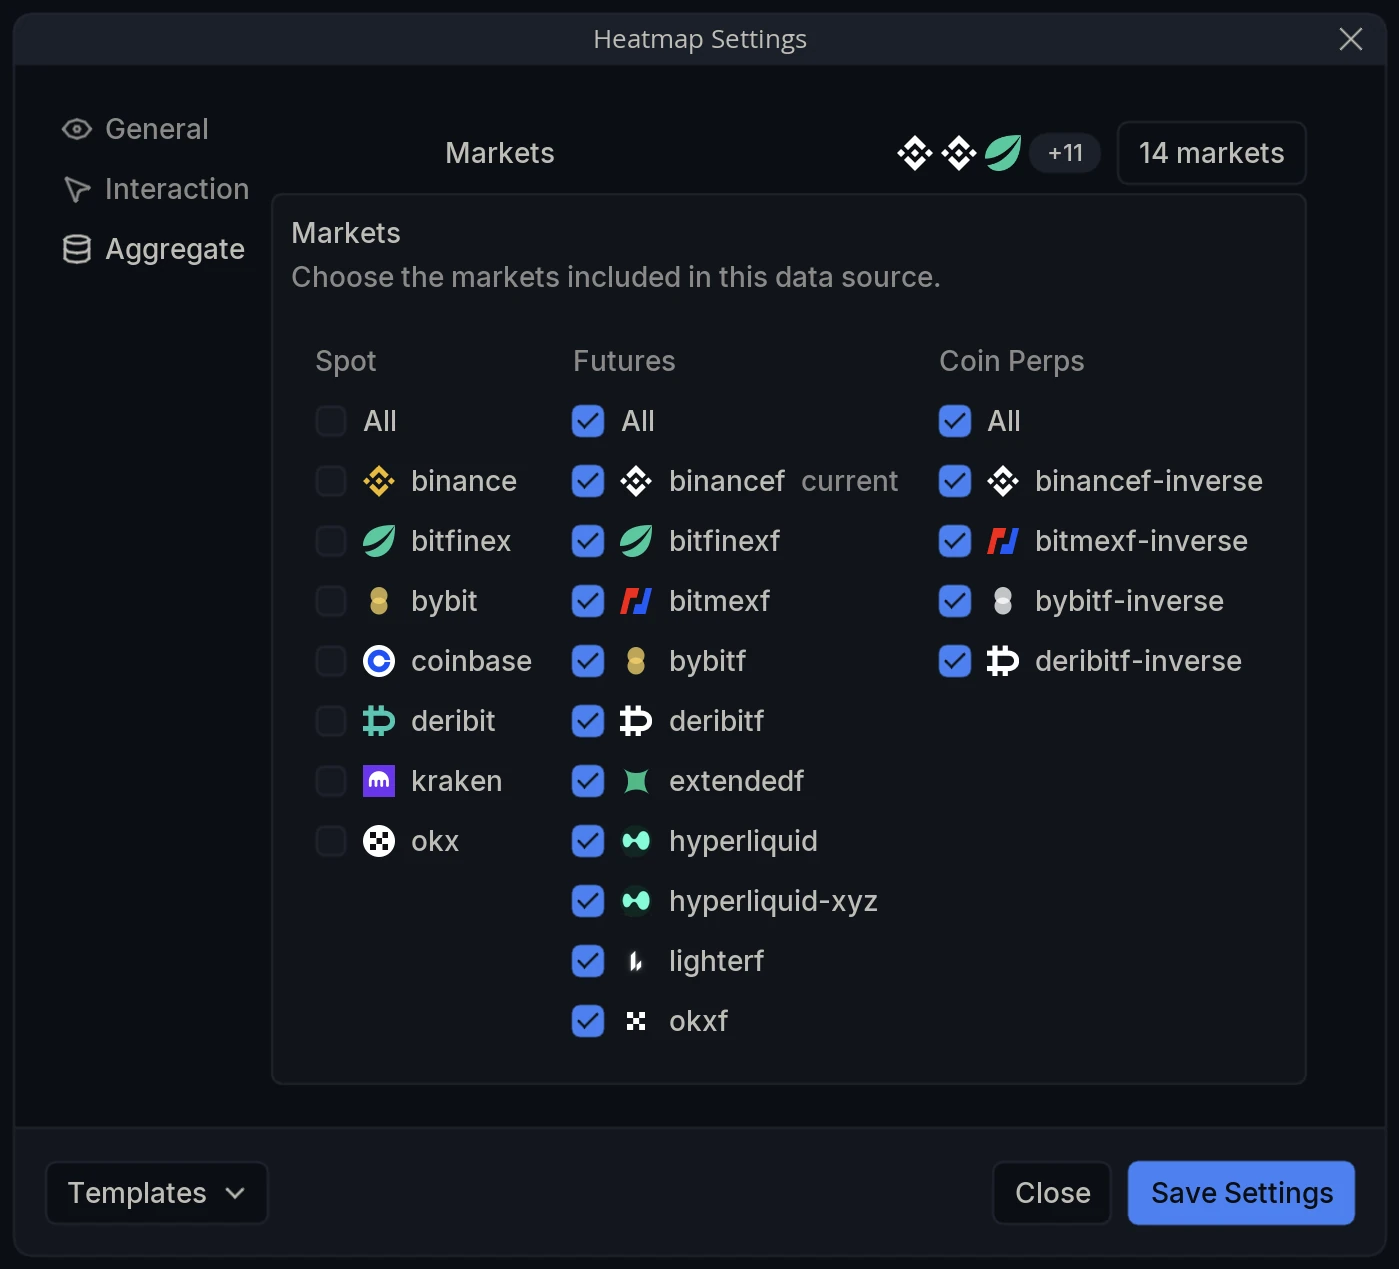
Markets - Choose the markets included in the heatmap’s data source. Clicking the market count opens a selector grouped into Spot, Futures, and Coin Perps, with an All toggle per group; your chart’s own market is tagged current. Each market added or removed re-triggers a recalculation of the heatmap.
Templates
Note: Heatmap settings are not set-and-forget. The right intensity range, resolution, and colormap depend on the market, the timeframe, and current conditions - expect to re-tune as you move between them.