What is volume delta?
By MichaelUpdated August 25, 2026
Volume delta is the difference between aggressive buying and aggressive selling in a period: market buy volume minus market sell volume. A positive delta means buyers crossed the spread for more size than sellers did, a negative delta the reverse. It measures which side was the aggressor, not which side was right.
How does volume delta work?
Every trade has an aggressor. One party is waiting with a resting limit order and the other decides to cross the spread and take it. A buyer who lifts the offer is a market buy; a seller who hits the bid is a market sell. Exchanges report which side did the crossing, and that is what delta is built from.
Volume alone cannot make this distinction. A bar with 5,000 of volume tells you 5,000 traded, and nothing about who was doing the taking. Split that same figure into 4,000 of market buying and 1,000 of market selling and it describes a very different bar, one where buyers were doing almost all the chasing.
Delta is that split reduced to a single number. It resets at the start of every bar, so each reading describes its own period and nothing before it. That is what separates it from CVD, which adds each bar’s delta to a running total: delta is the building block, CVD is the accumulation of it.

Drawn around a zero baseline, the plot reads immediately. Bars above the line are periods where buyers were the aggressors, bars below it periods where sellers were, and the distance from zero is how lopsided the taking was.
What does a delta candle show?
Delta can be drawn as a simple bar, but a candle carries considerably more.
Because delta starts at zero each period, the candle opens at zero and closes at the bar’s final delta, so the body spans the net result. The wicks reach the highest and lowest delta the bar touched along the way.
That difference between the wick and the body is the whole point, and it is a reading no histogram can give you. Look at the tall green candle in the chart above: it ran to roughly 4,000 of net buying during the bar, and its body finishes far below that high. Buyers pushed hard, got most of the way, and gave a large part of it back before the bar closed.
Something met that buying. Aggressive orders that go in and do not stay in are orders that were absorbed by resting size on the other side. A bar that reaches an extreme and closes near zero is a fight that took place inside a single period, and only the wick records it.
The reverse shape matters too. A candle with almost no wick beyond its body is a bar where the aggression went one way and stayed there, unopposed. Same closing delta, completely different story.
How do you read volume delta?
Start with agreement. Delta positive on an up bar and negative on a down bar is the ordinary case: the side doing the chasing got the result you would expect, and there is nothing to explain.
The information is in the exceptions.
Delta and price disagreeing. A bar that closes higher on strongly negative delta means sellers did the aggressive trading and price rose anyway. Someone was absorbing that selling with resting bids, and absorbing enough of it to lift the market while being hit. That is a far more meaningful bit of buying than an up bar on positive delta, because it happened against the flow rather than with it.
Extremes that do not stick. As above, a large delta with a large wick is aggression that was met. Repeated at the same price across several bars, it marks a level where somebody is defending.
Delta shrinking through a move. A run of bars pushing the same direction with each delta smaller than the last is a move losing its aggressor. It does not mean a reversal, but it means the fuel is thinning.
The habit that makes delta useful is reading it as a pair with the bar it belongs to, never on its own. Delta describes effort. The candle describes result. Effort without result is the signal.
Why filter delta by trade size?
An unfiltered delta counts a $500 market order and a $2 million market order into the same total, and the total then describes neither.
Restricting delta to large trades isolates what size participants are doing aggressively. Restricting it to small ones isolates everyone else. When the two disagree - retail-sized flow buying aggressively while size-sized flow sells into it - that disagreement is considerably more informative than the blended figure, which averages the two into something that looks like neither.
What are the limits of volume delta?
One bar is noise. A single delta reading can be dominated by one order. Delta is at its most reliable read across a run of bars, or accumulated, which is exactly what CVD is for.
It measures aggression, not intent. Crossing the spread tells you someone wanted it done now. It does not tell you whether that was an entry, an exit, a hedge or a forced liquidation, and a panicked sale looks identical to a considered one.
Classification is the exchange’s. Delta depends on the venue correctly reporting which side was the aggressor. Conventions vary at the edges, and not every feed handles unusual fills the same way.
It is venue-specific. One exchange’s delta describes one exchange’s flow. Aggregating across venues gives a much steadier reading of who was really doing the taking.
Related: CVD (Cumulative Volume Delta) · Volume · Bar statistics · Order book heatmap
Using Delta Volume in MMT
MMT’s Delta Volume layer plots each bar’s delta as a candle in its own panel below the price chart, so the intrabar high and low of delta are visible alongside its close. It can be filtered by trade size, reported in the base coin or USD, and aggregated across exchanges.
How do you add Delta Volume to a chart?
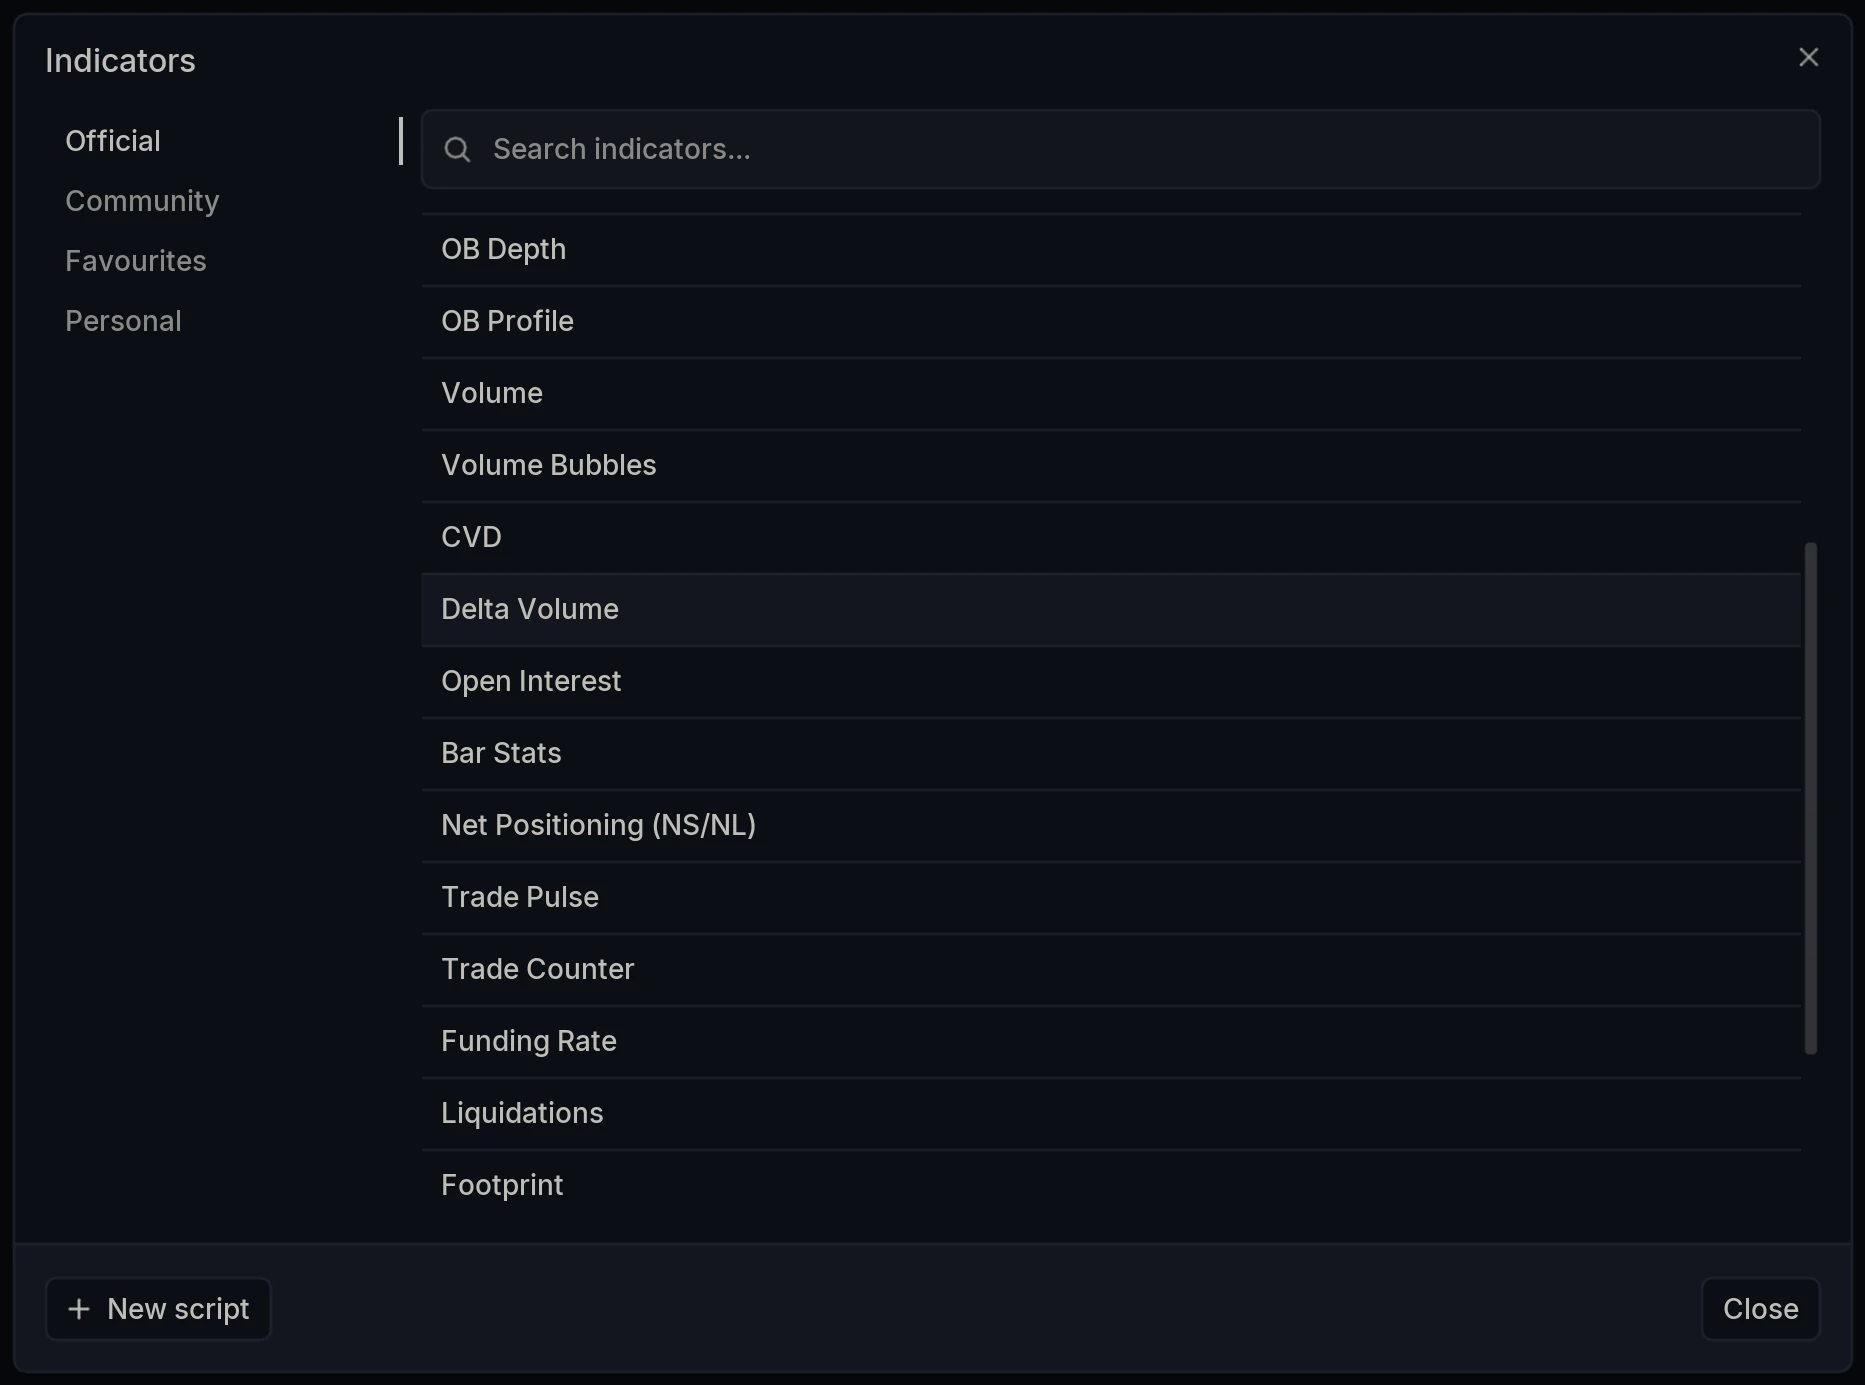
Open the Indicators dialog and select Delta Volume under Official.
How do you filter by trade size?
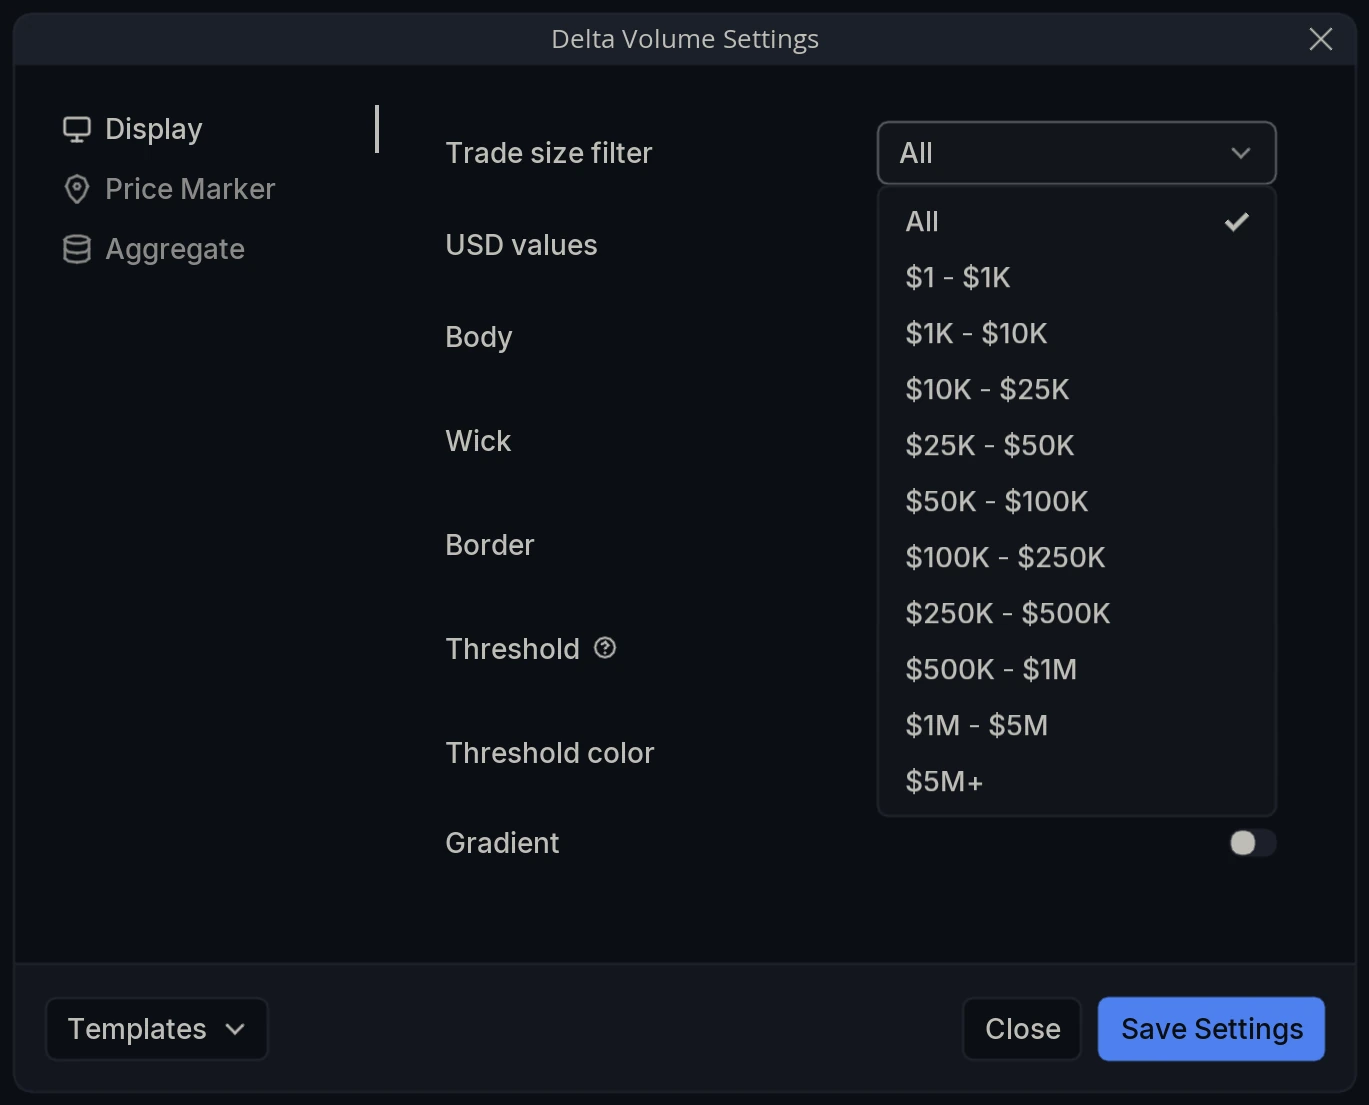
The Trade size filter restricts the calculation to trades within one size bucket: All, or one of the ranges from $1 - $1K up to $5M+. The buckets are the same set the CVD layer uses, so a delta and a CVD filtered to the same bucket describe the same flow, one per bar and one accumulated.
How do Threshold and Gradient work together?
Threshold sets the size a bar’s delta must exceed to be marked out, drawn in the Threshold color so significant bars separate from the routine flow. As the tooltip in the panel puts it, the figure uses the selected coin or USD unit, so it follows the USD values toggle above it.
Gradient then shades those bars by size rather than coloring them all identically. It only takes effect in combination with a Threshold, so setting one is the first step: the threshold decides which bars qualify, and the gradient shows how far past it each one went.
Layer Settings
Open Delta Volume Settings via the cog wheel on the layer name. The panel has three tabs: Display, Price Marker and Aggregate.
Display
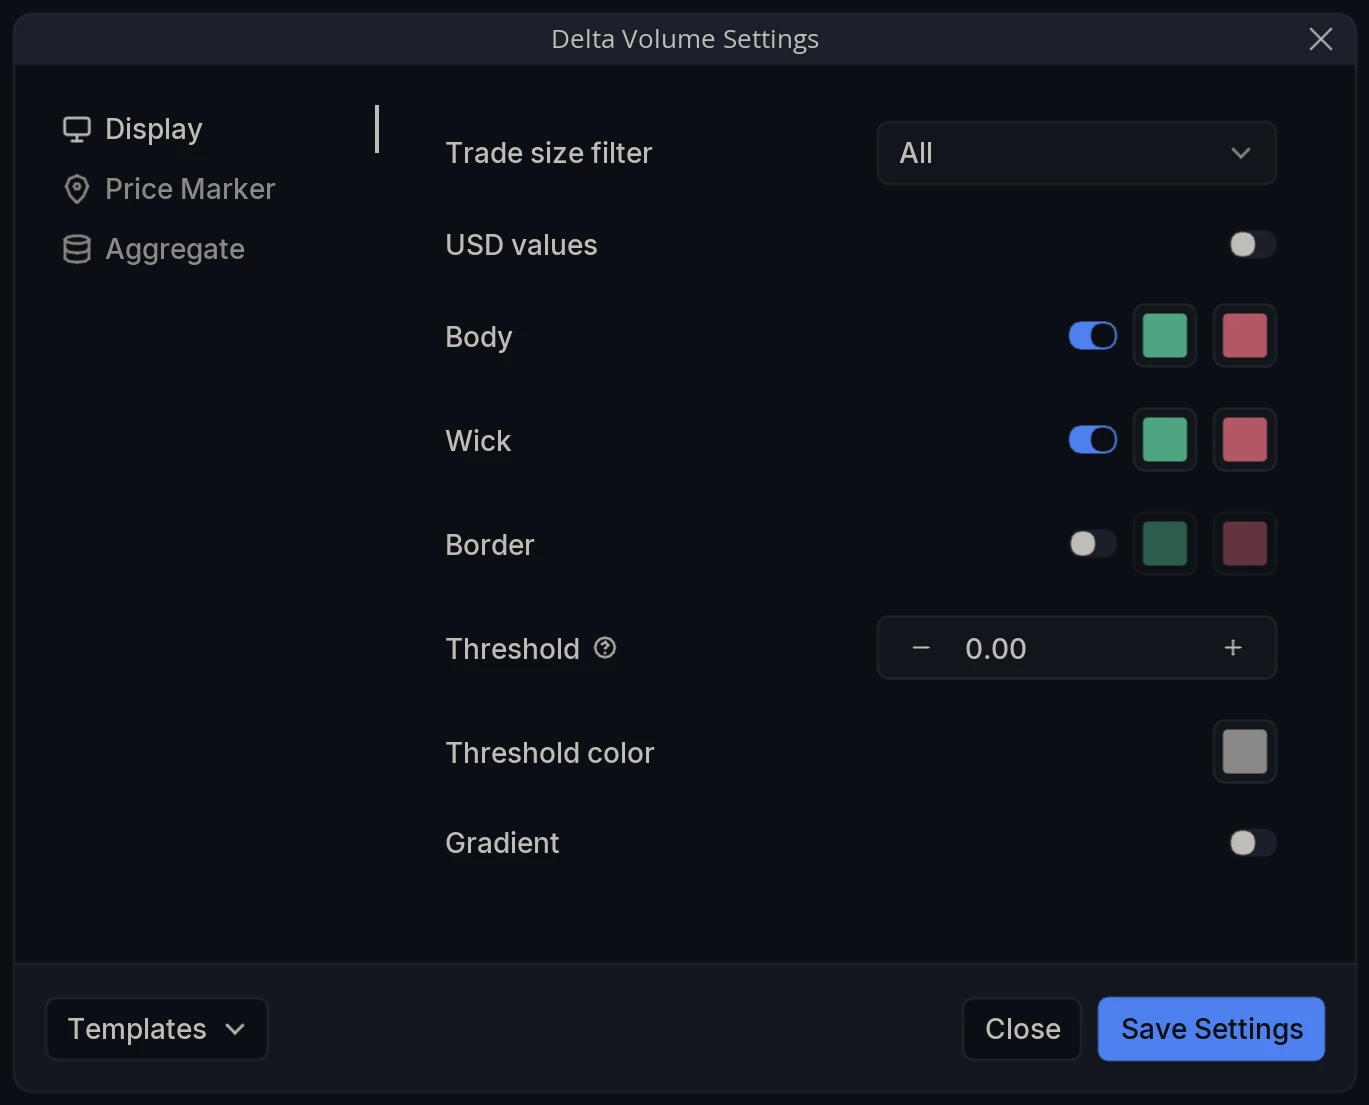
Trade size filter - Restrict the calculation to trades within a size bucket: All, or one of the ranges from $1 - $1K up to $5M+.
USD values - Report values in USD rather than in units of the base asset.
Body - Toggle the candle body and set its up and down colors.
Wick - Toggle the wicks and set their up and down colors independently of the body. The wicks carry the bar’s highest and lowest delta, so leaving them on is what makes the layer worth more than a histogram.
Border - Toggle an outline around the body, with its own up and down colors.
Threshold - The delta a bar must exceed to be highlighted. Read in whichever unit is currently selected, coin or USD, per the USD values toggle above.
Threshold color - The color applied to bars above that threshold.
Gradient - Shade the highlighted bars by size so the largest render most strongly. Works only in combination with Threshold.
Price Marker
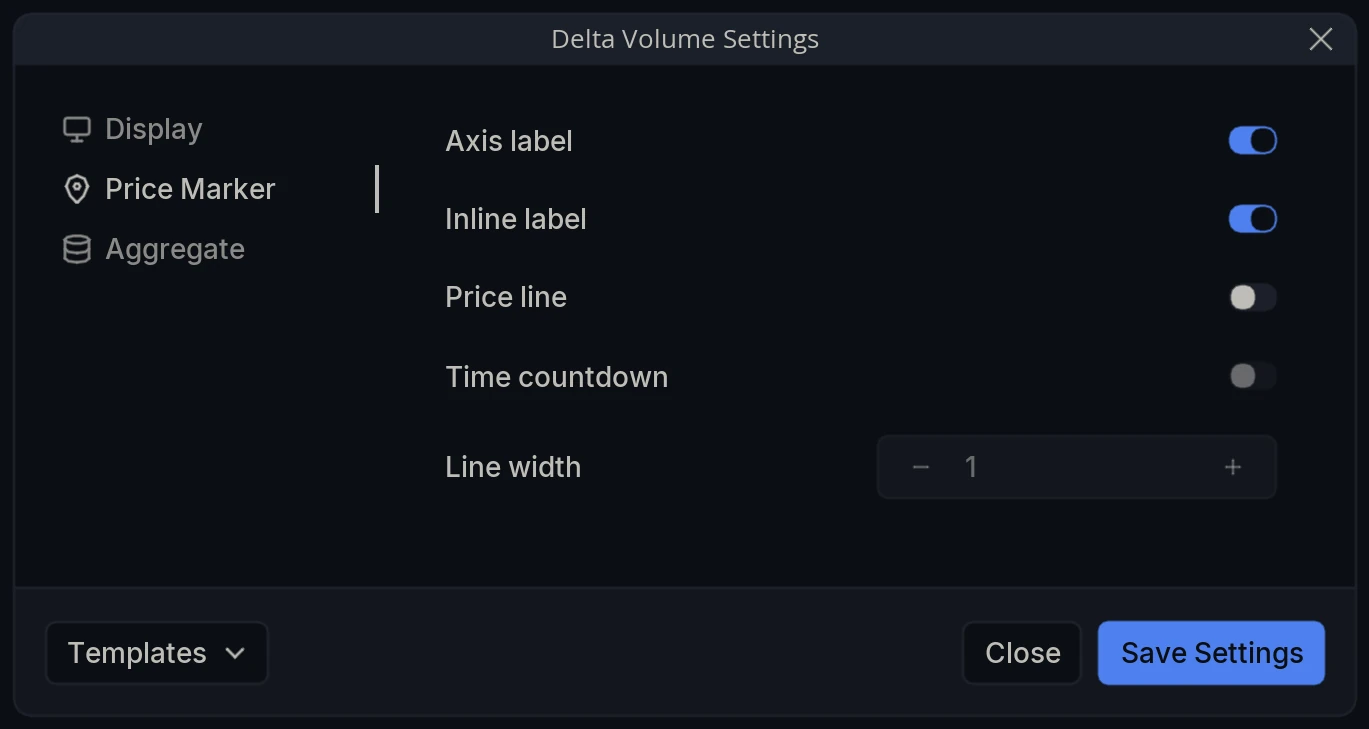
Axis label - Show the current value as a label on the panel’s axis.
Inline label - Show that value on the panel itself rather than on the axis.
Price line - Draw a horizontal line across the panel at the current value.
Time countdown - Show the time remaining until the current candle closes.
Line width - Thickness of that line.
Aggregate
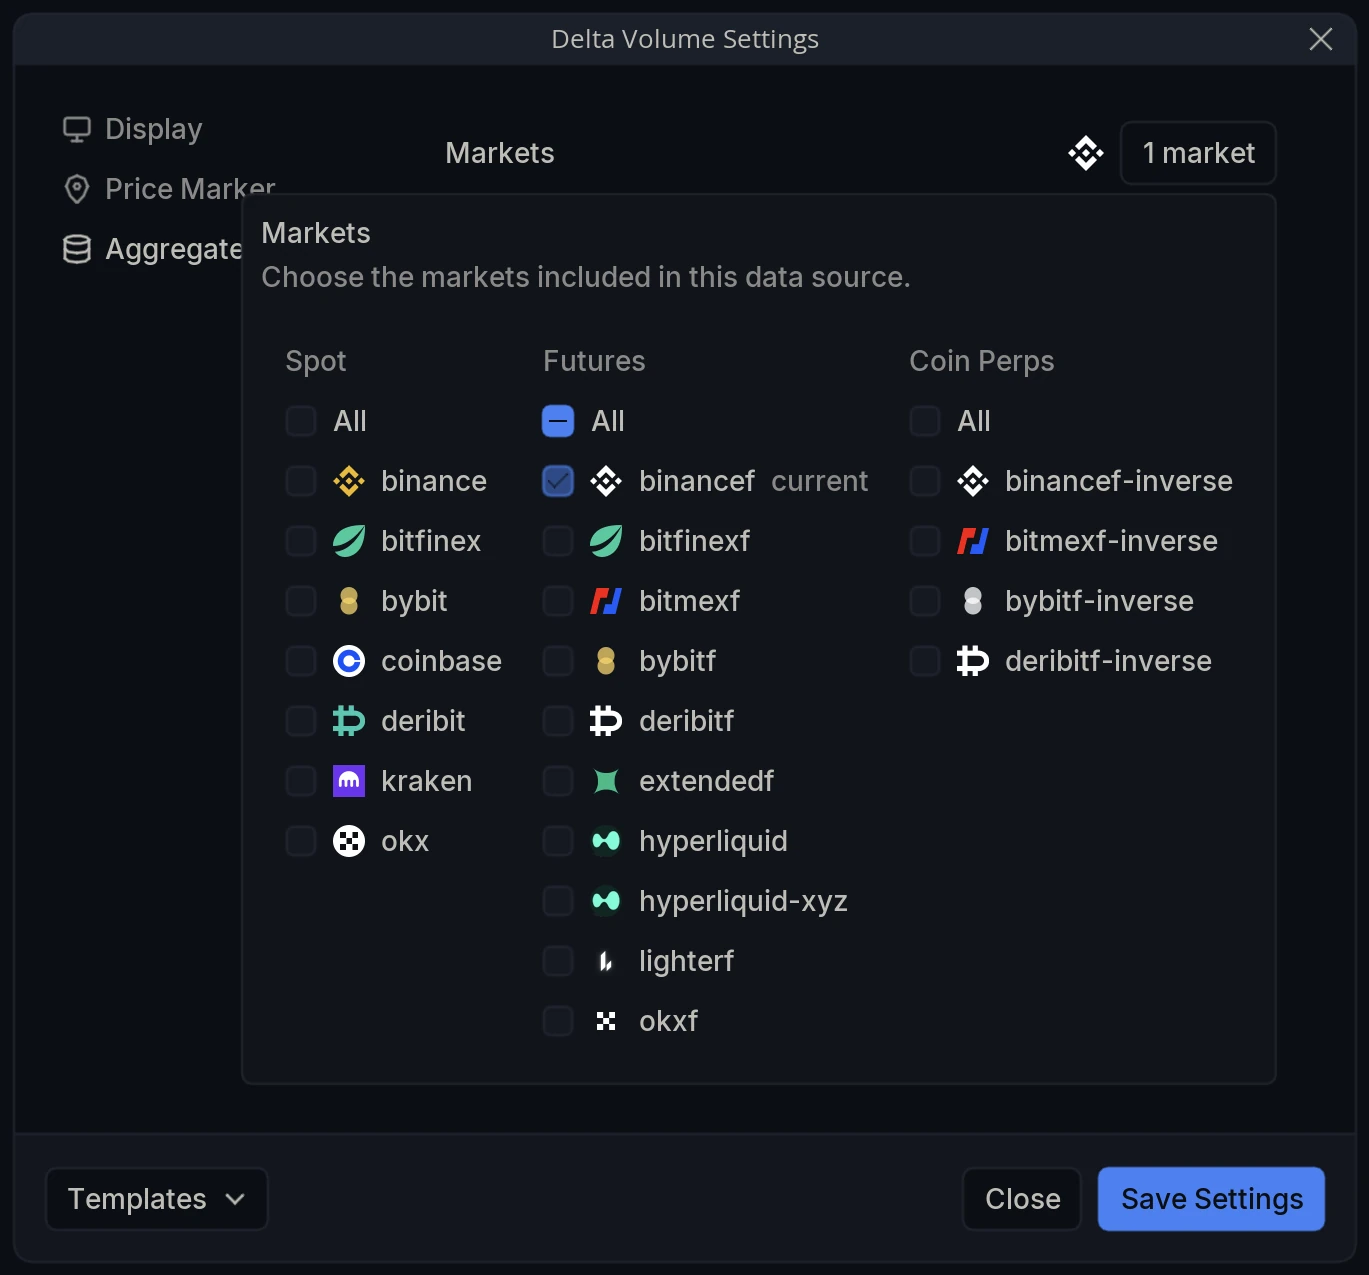
Markets - Choose the markets included in the calculation. The selector is grouped into Spot, Futures and Coin Perps, with an All toggle per group; your chart’s own market is tagged current.
Pooling venues matters for delta. Aggressive flow moves between exchanges, and a strongly one-sided bar on a single venue can simply mean the other side of it happened somewhere else.