What is VPSV (Volume Profile Session Volume)?
By MichaelUpdated August 25, 2026
VPSV (Volume Profile Session Volume) draws one volume profile for each trading session. Every session gets its own horizontal histogram showing how much volume traded at each price during that period, so sessions can be compared with one another rather than blended into a single distribution.
How does a session volume profile work?
A volume profile measures volume against price instead of against time. The price range is divided into rows, every trade is assigned to the row containing its price, and the totals are drawn as a horizontal histogram. Long rows are prices where a lot of business was done.
What makes a session profile distinct is that the measurement resets. Rather than one profile covering everything on screen, a new profile begins at the start of each session and ends when that session closes. A week of daily sessions produces seven separate profiles sitting side by side along the chart.
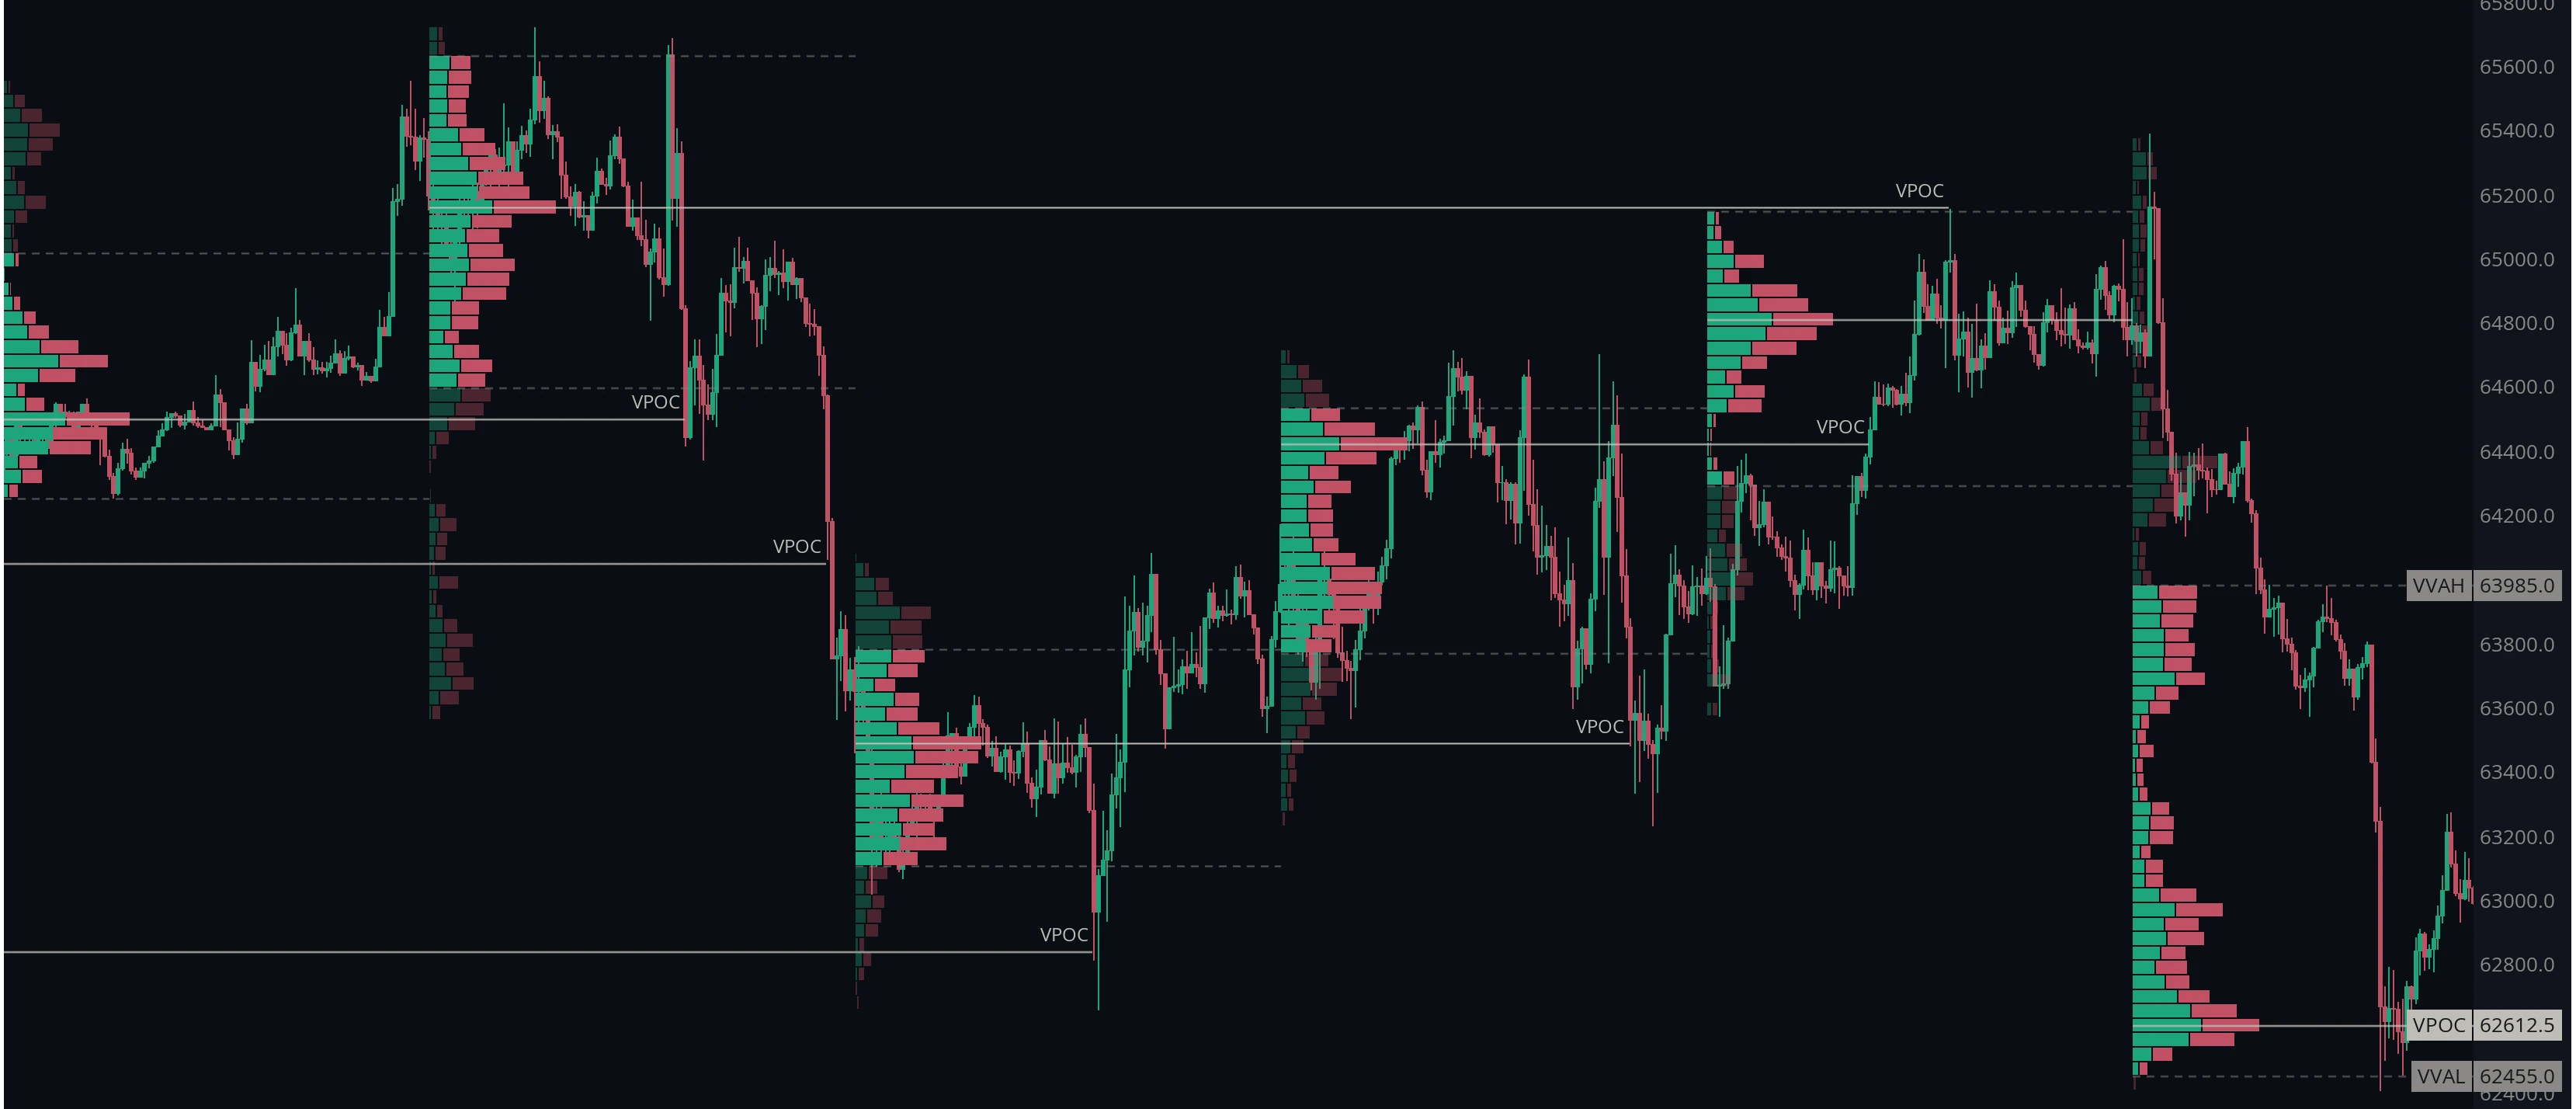
That separation is the whole point. Each profile is a self-contained description of one period: where that day found value, where its point of control sat, how wide its value area was. Because the profiles are anchored to the calendar rather than to your viewport, they stay fixed as you scroll, which makes them comparable. Reading yesterday’s profile against today’s is how traders judge whether the market has accepted a new area of value or returned to an old one.
How do you read a session volume profile?
Each profile has the same anatomy, and it is built in two steps.
The point of control (POC) comes first. It is the longest row: the price at which more volume traded than at any other during that session, and therefore the level that session agreed on most.
The value area is then grown outward from it. Starting at the POC, the profile compares the rows above and below and incorporates whichever holds the most volume. It repeats that, taking the heaviest remaining neighbor each time, until the rows it has collected account for the target share of the session’s volume, 70% by convention. The highest row in that set becomes the value area high (VAH) and the lowest becomes the value area low (VAL).
That construction is what gives the two edges their meaning. VAH and VAL are not a fixed distance from the POC and they are rarely symmetrical around it. They sit wherever the volume ran out, so a value area reaching much further above the POC than below it is telling you the session did most of its business on the way up.
Within a single session those levels behave as you would expect: the POC acts as a magnet, and the value area edges are where price tends to be accepted or rejected.
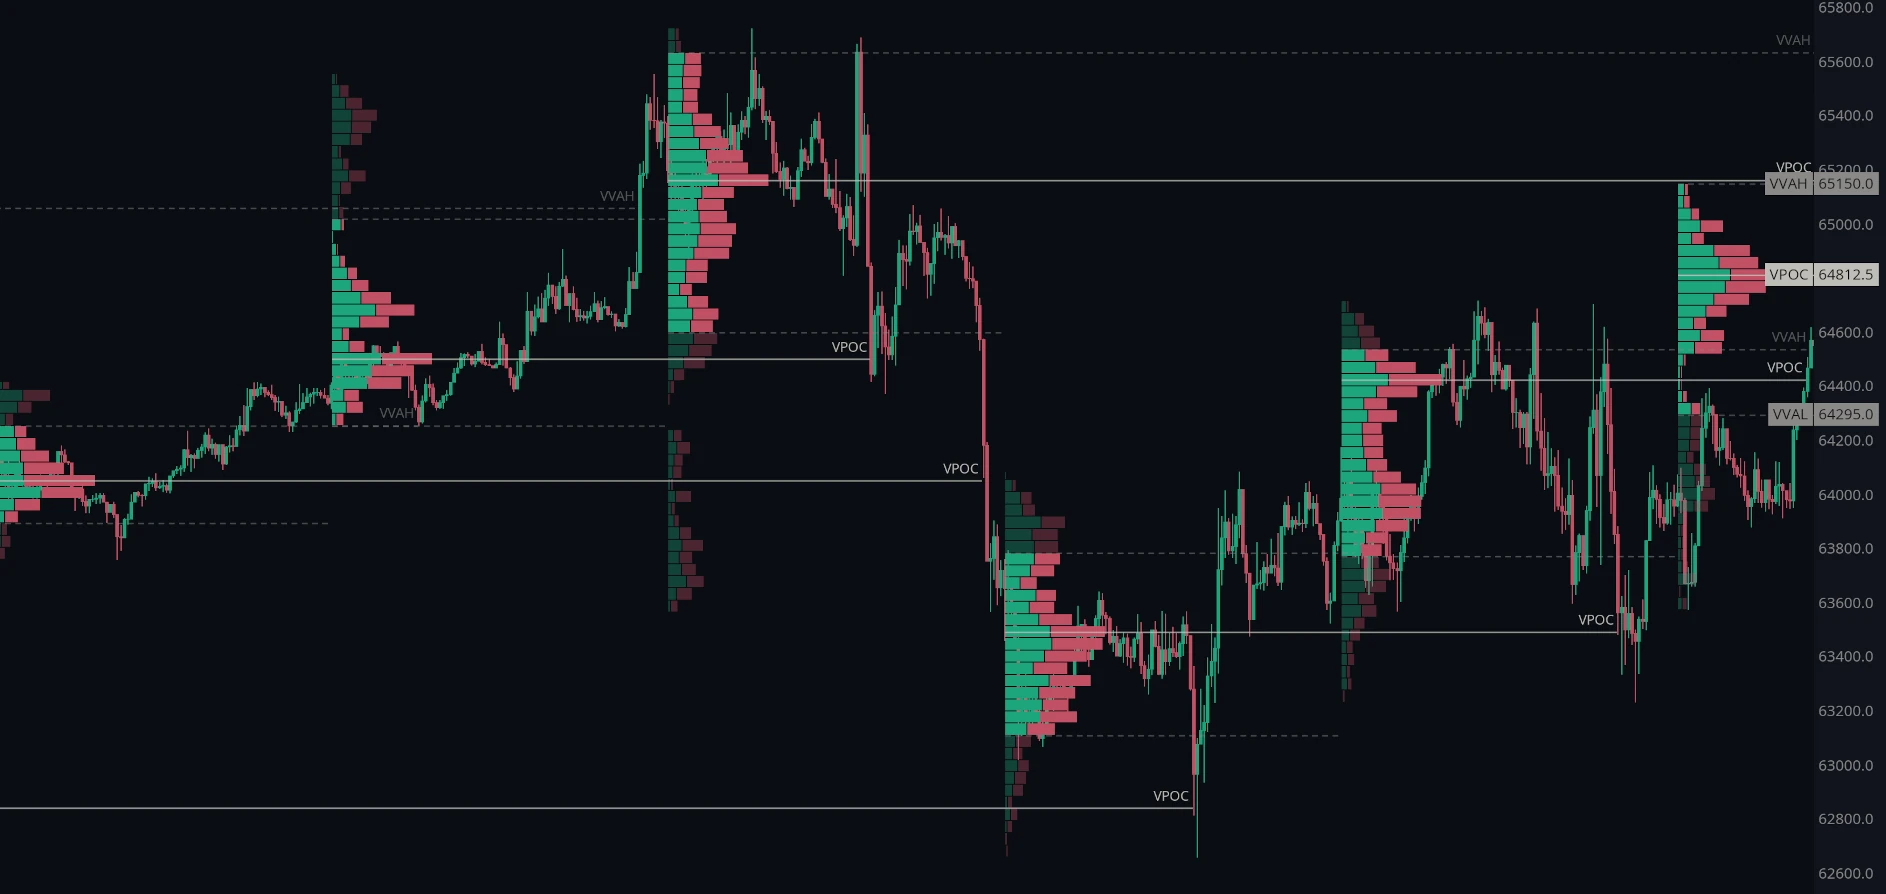
The reading that matters more is between sessions. Compare each new profile with the one before it:
Higher value means the whole distribution has shifted up. Buyers have accepted prices that yesterday’s market would not, which is what a genuine trend looks like on a profile chart.
Overlapping value means the two sessions largely agree. The market is rotating in the same area, and neither side has managed to move the accepted range.
A migrating POC across several sessions traces where agreement is drifting, which is often clearer than the price chart itself.
What is a developing POC?
A finished profile shows where the point of control ended up. A developing POC shows where it was at every moment during the session.
As a session builds, the row with the most volume changes. Early on it sits wherever the first heavy trading happened; as the session progresses and volume accumulates elsewhere, it migrates. Plotting that migration as a line gives you the POC as it developed rather than only its final resting place.
That matters because it reveals direction. A developing POC that climbs steadily through a session shows value being accepted higher and higher in real time. One that sits still shows a market rotating around a single agreed price all day. The same logic applies to a developing value area, which shows the value area edges expanding and shifting as the session fills out.
What are naked levels on a volume profile?
A level is naked, sometimes called virgin, when price has not traded back to it since the session that created it.
A naked POC from three sessions ago marks a price the market agreed on heavily and has not revisited. Because untested levels tend to attract price, those levels are commonly extended forward from the session that produced them and watched as targets until price finally returns and the extension stops.
The value area edges can be extended the same way, so an untested VAH or VAL from a previous session remains on the chart as a reference until the market comes back to it.
What is the difference between VPSV and VPVR?
Both measure volume at price. The difference is what defines the range.
VPVR builds a single profile from whatever is currently on screen, and recalculates as you scroll or zoom. VPSV builds one profile per fixed session, anchored to the calendar, which stays put as you navigate.
They answer different questions. VPVR is the tool for measuring a structure you have chosen yourself: a swing, a consolidation, a trend leg that does not align with session boundaries. VPSV is the tool for comparing like with like, because every profile covers the same length of time and the same clock hours, which is what makes yesterday and today directly comparable.
Related: Volume Profile Visible Range (VPVR) · TPO market profile · Volume
When should you use VPSV?
VPSV suits any analysis where the session is the natural unit. Judging whether today has accepted yesterday’s value, marking the levels a previous session left behind, and tracking where agreement is migrating over a run of days are all things it does better than a visible-range profile.
It is also the right tool when you care about a specific market window. Profiling the London session separately from the New York session shows how differently the same asset trades depending on who is at their desk, which a single blended profile hides completely.
Its limitation is the flip side: if the structure you care about does not align with session boundaries, the profile splits it across two distributions and describes neither well.
Using VPSV in MMT
MMT’s VPSV draws a profile for each session, with the session length configurable from a rolling period to a named market window. Developing POC and value area lines can be enabled, and any structure can be extended forward until price returns to it.
How do you add VPSV to a chart?
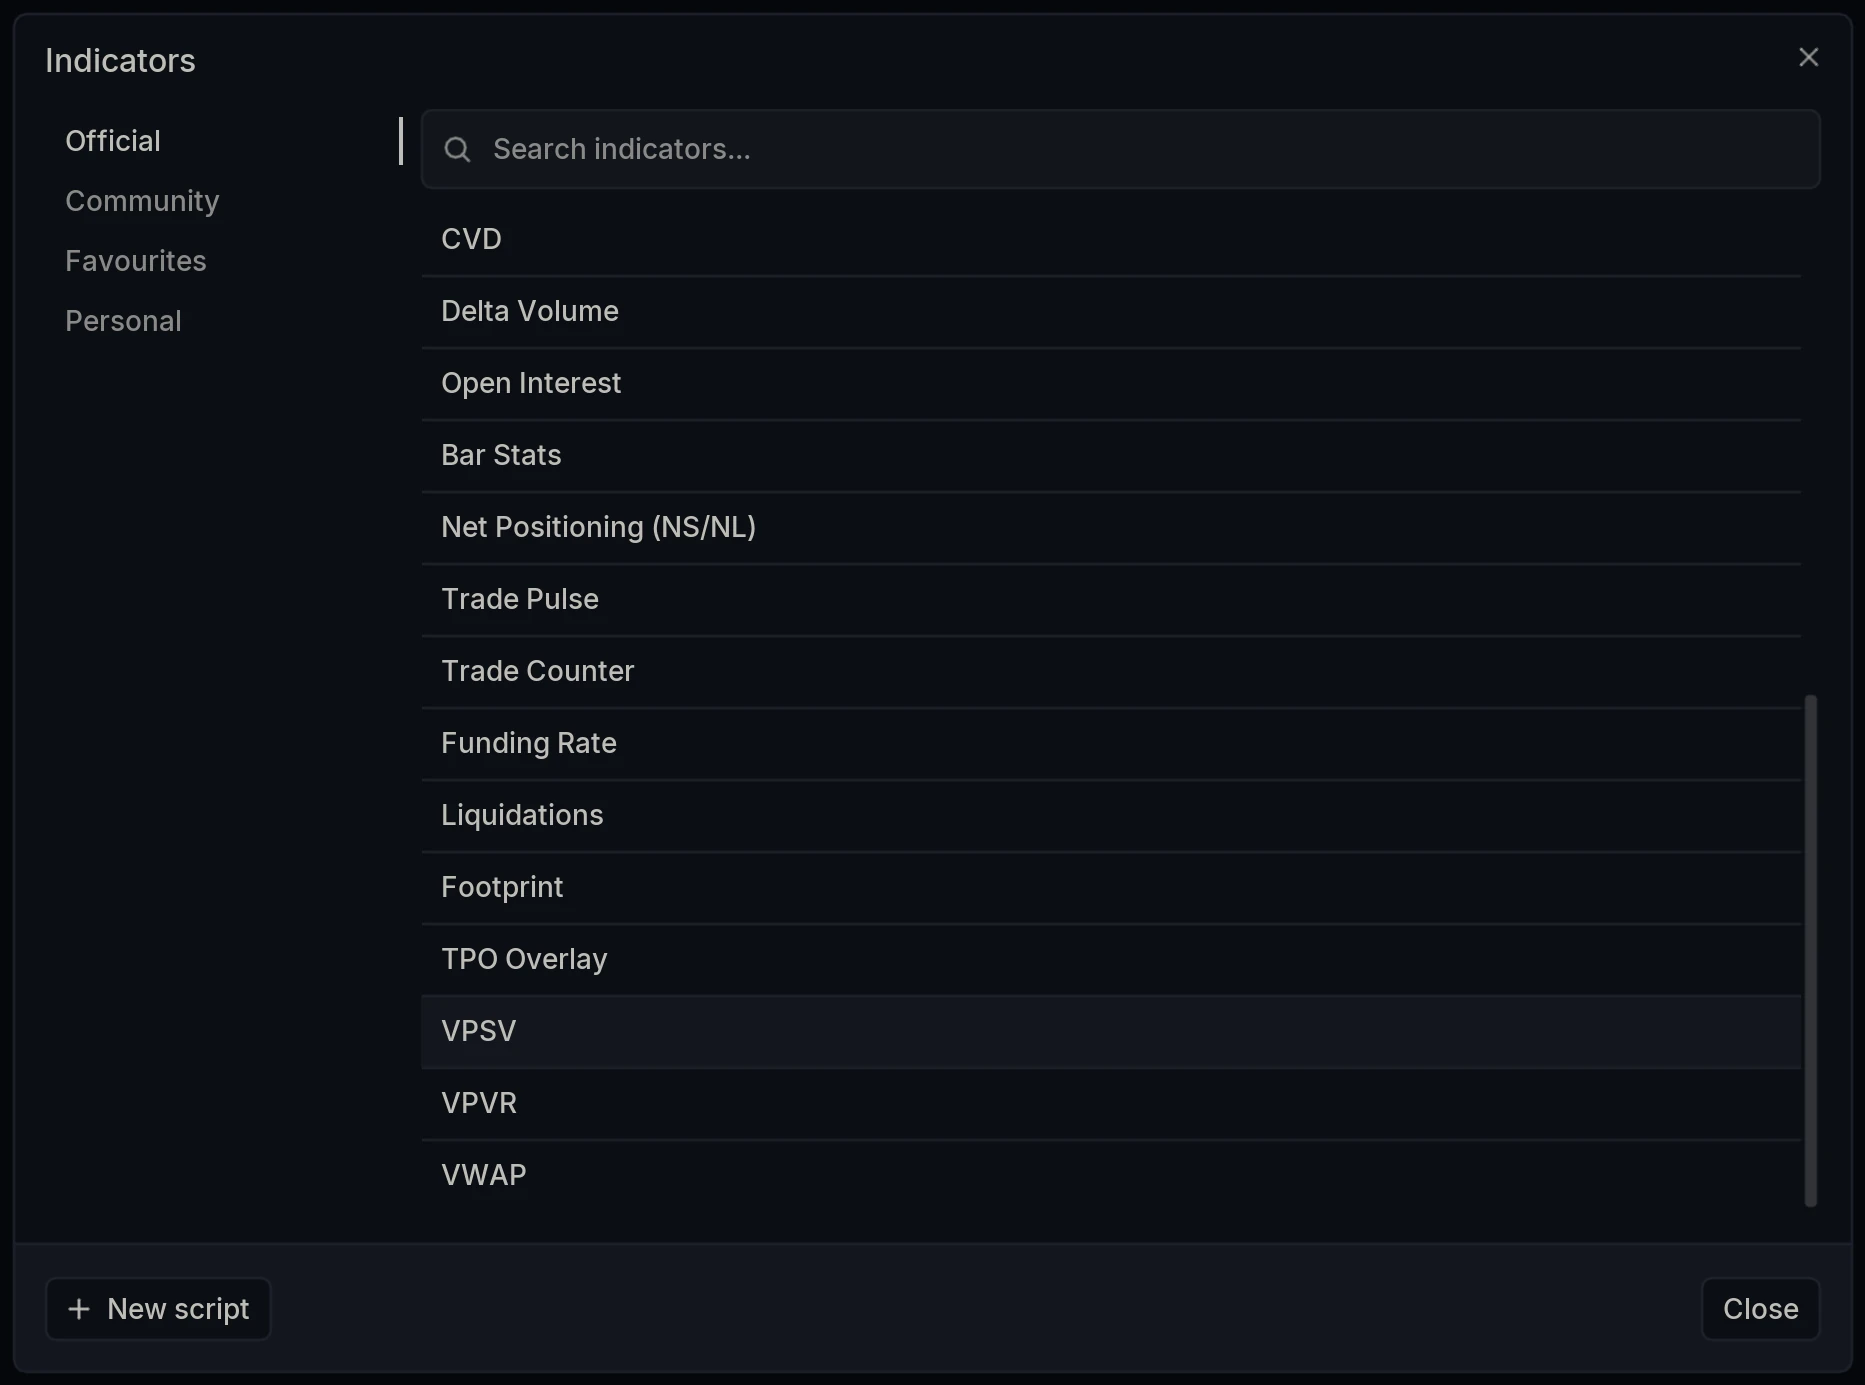
Open the Indicators dialog and select VPSV under Official.
What session periods are available?
The Session period dropdown offers Daily, Weekly and Monthly for rolling periods, the three named market windows London, New York and Asia, plus Intraday and Custom.
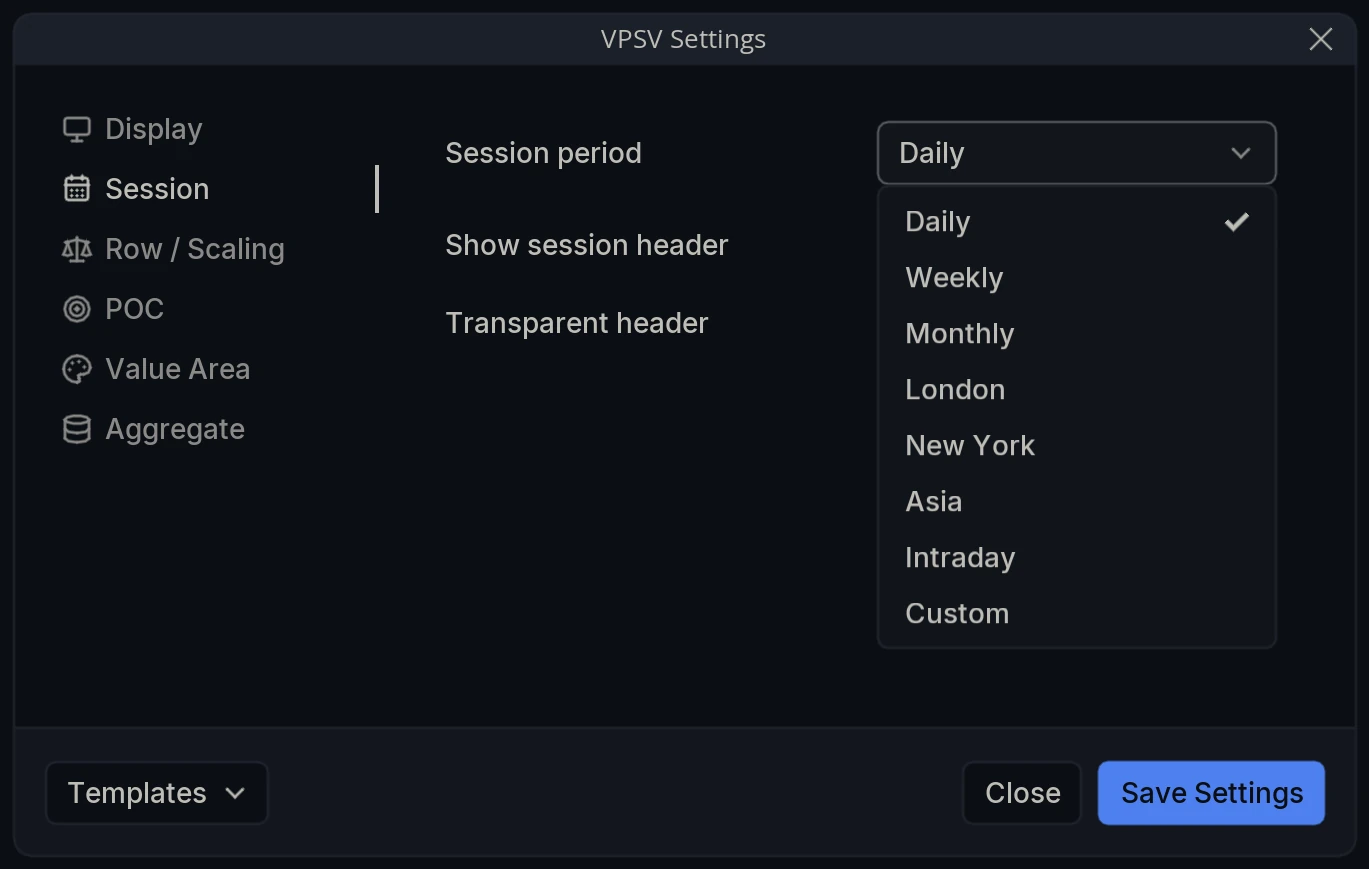
The named sessions take their times from the terminal’s Settings under Sessions, where London, New York and Asia are defined with editable UTC start and end times. Anything you change there applies here too, so a session defined once behaves the same across every layer that works in sessions.
Layer Settings
Open VPSV Settings via the cog wheel on the layer name. The panel has six tabs: Display, Session, Row / Scaling, POC, Value Area and Aggregate.
Display
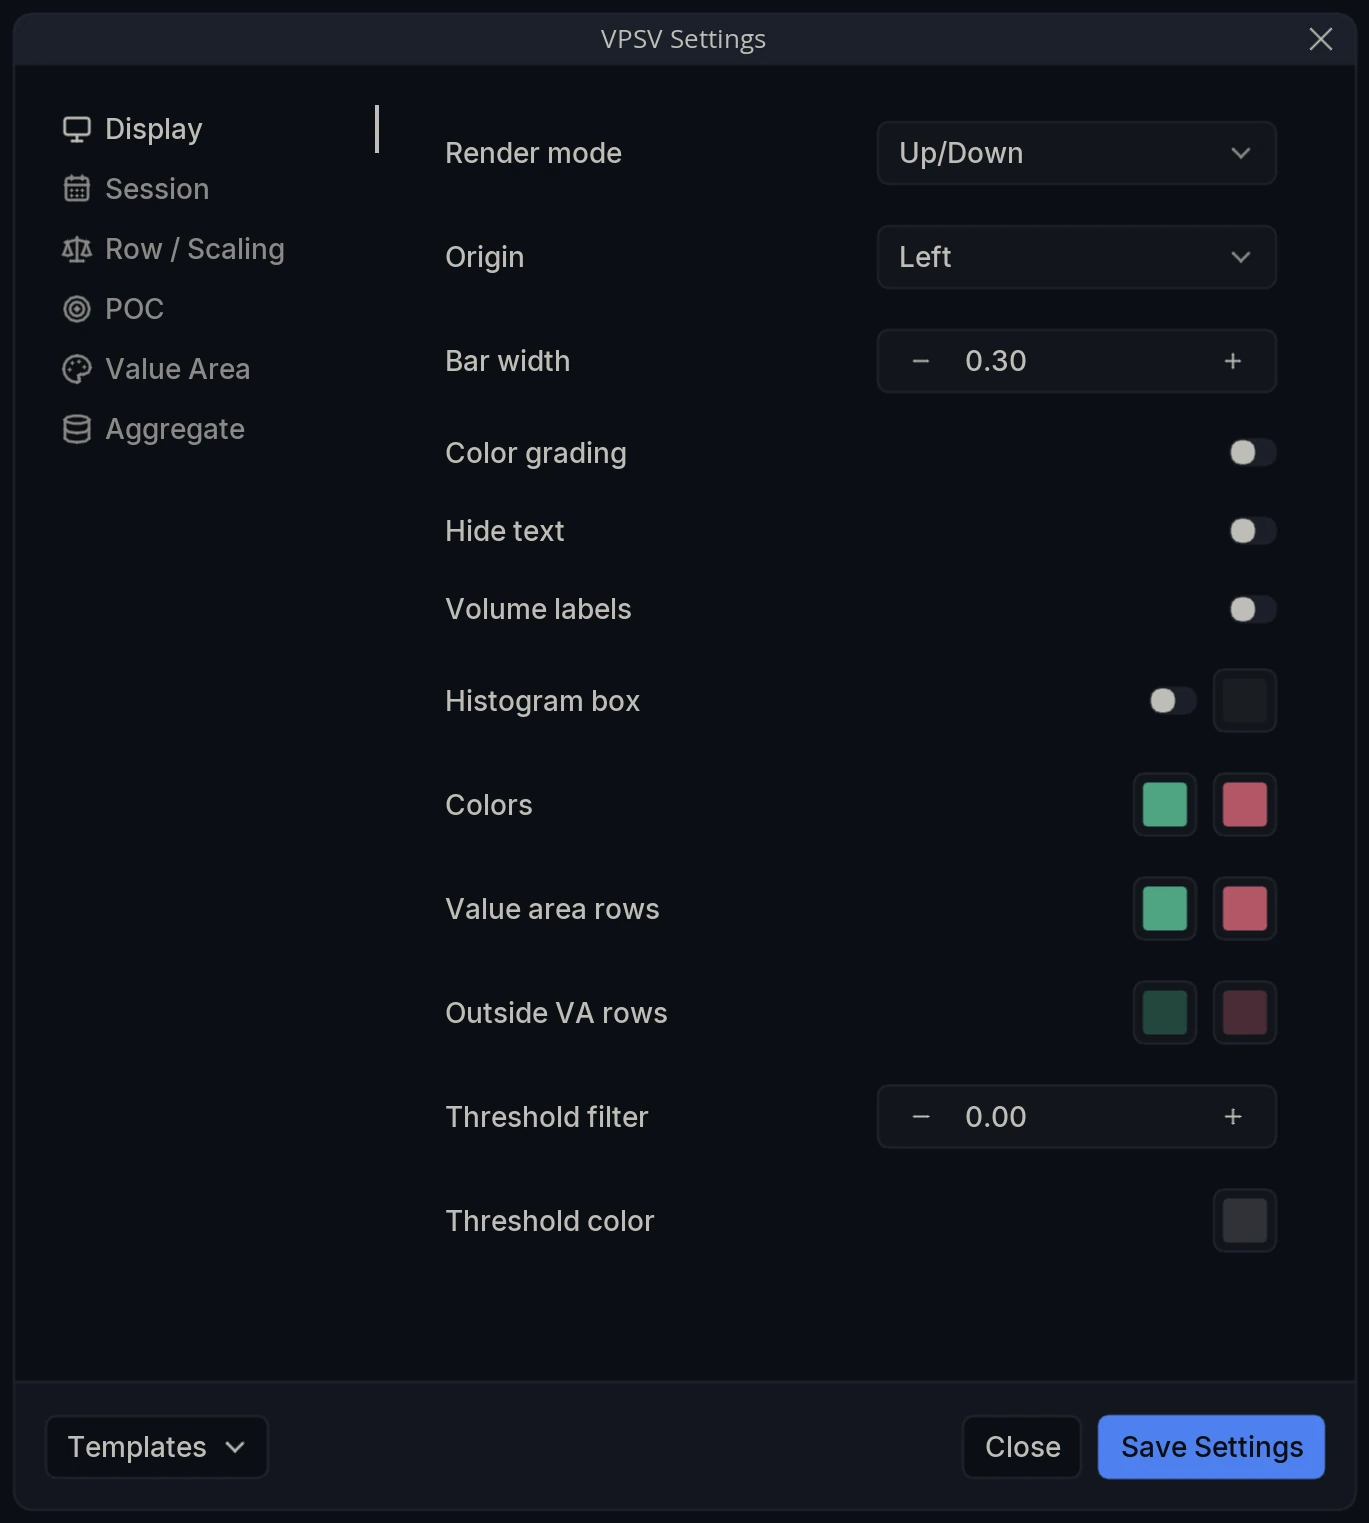
Render mode - How each row is drawn: Up/Down splits it into buy and sell volume, Total merges both into one figure, Delta shows the net difference, and Combined layers the views together.
Origin - Which side of each session the profile is anchored to, Left or Right.
Bar width - The maximum width of the longest row, as a fraction of the available width.
Color grading - Shade each row by its volume so the largest rows render most strongly and smaller ones fade back.
Hide text - Hide the POC label drawn on the chart.
Volume labels - Print the volume figure inside each row.
Histogram box - Draw a shaded box around each session’s profile, with its own color.
Colors - The two colors used for buy and sell volume.
Value area rows - Colors applied to rows inside the value area.
Outside VA rows - Colors applied to rows outside it, so the value area stands out from the rest of the profile.
Threshold filter - The volume level a row must exceed to be highlighted.
Threshold color - The color applied to every row above that threshold.
Session
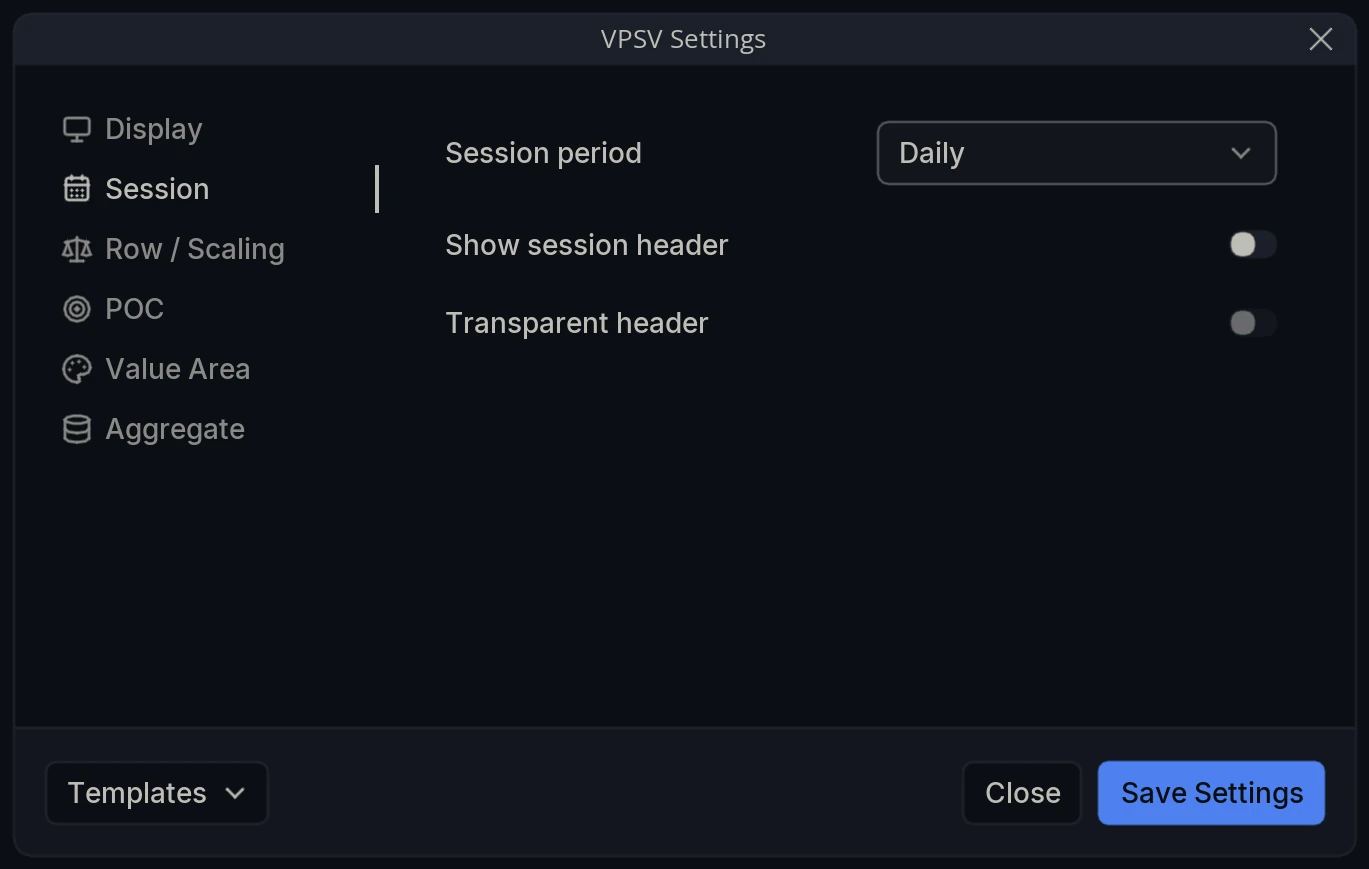
Session period - How long each profile covers: Daily, Weekly, Monthly, London, New York, Asia, Intraday or Custom.
Show session header - Draw a header above each session marking its boundaries.
Transparent header - Render that header without a solid background.
Row / Scaling
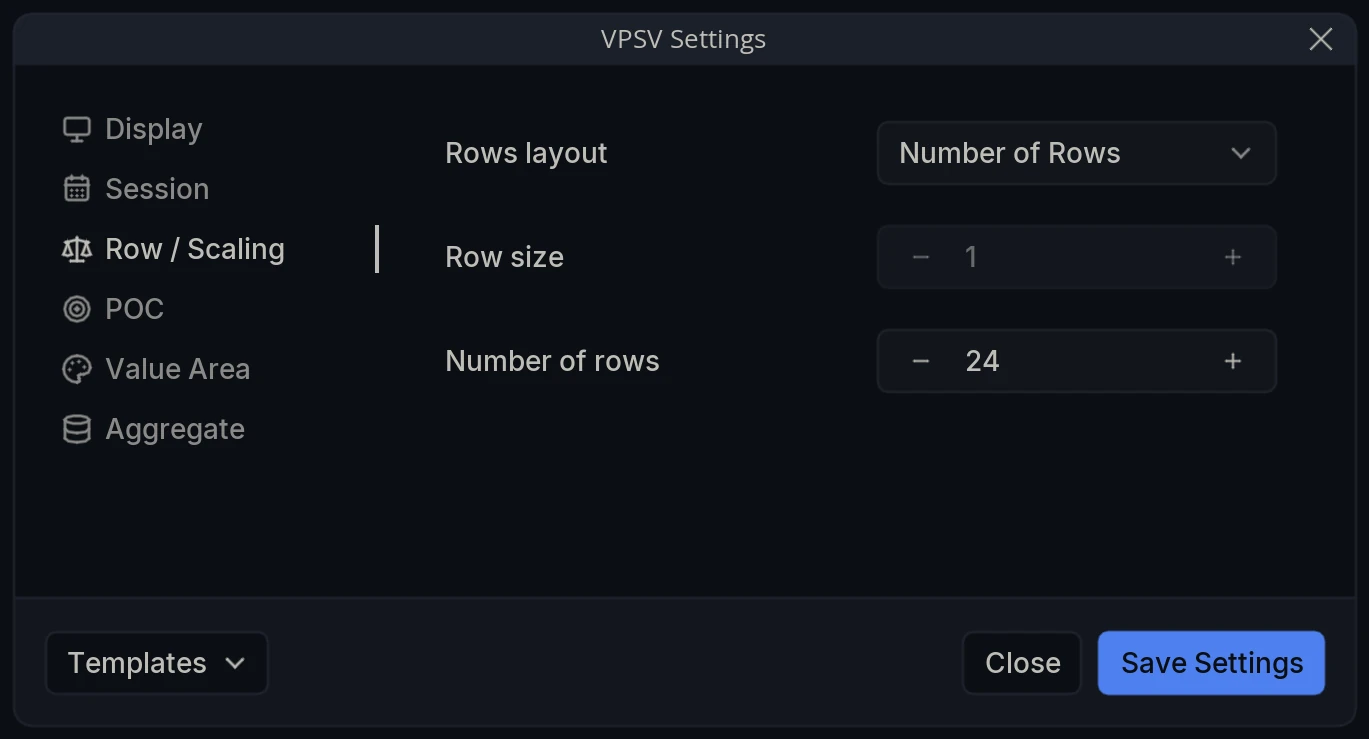
Rows layout - How row height is decided: Number of Rows divides each session’s range into a fixed count, Ticks Per Row sets each row to a fixed number of ticks, and Global (per-pair) uses the shared per-pair value that other indicators in global mode also use.
Row size - The ticks per row, active when Rows layout is set to Ticks Per Row.
Number of rows - How many rows each session is divided into, active when Rows layout is set to Number of Rows.
POC
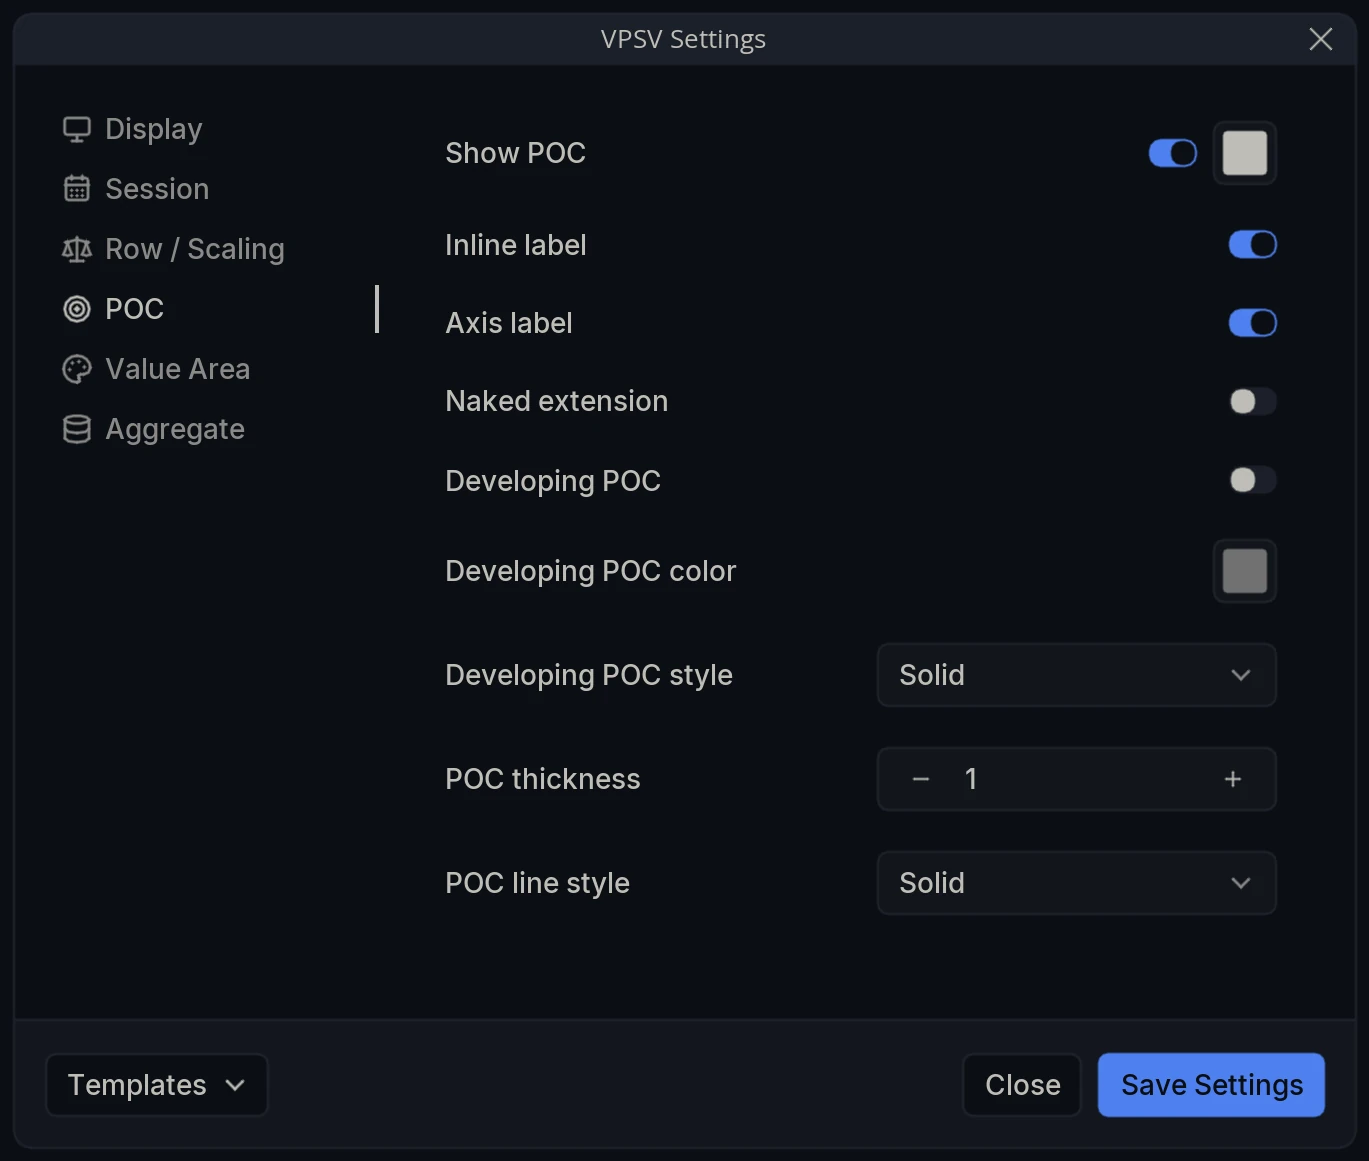
Show POC - Draw the point of control line, with its own color.
Inline label - Label the POC on the chart itself.
Axis label - Label the POC on the price axis.
Naked extension - Extend the POC forward from its session until price trades back to it.
Developing POC - Plot the POC as it migrated through the session rather than only its final level.
Developing POC color - Color of that line.
Developing POC style - Line style for it, Solid by default.
POC thickness - Thickness of the POC line.
POC line style - Line style for the POC itself.
Value Area
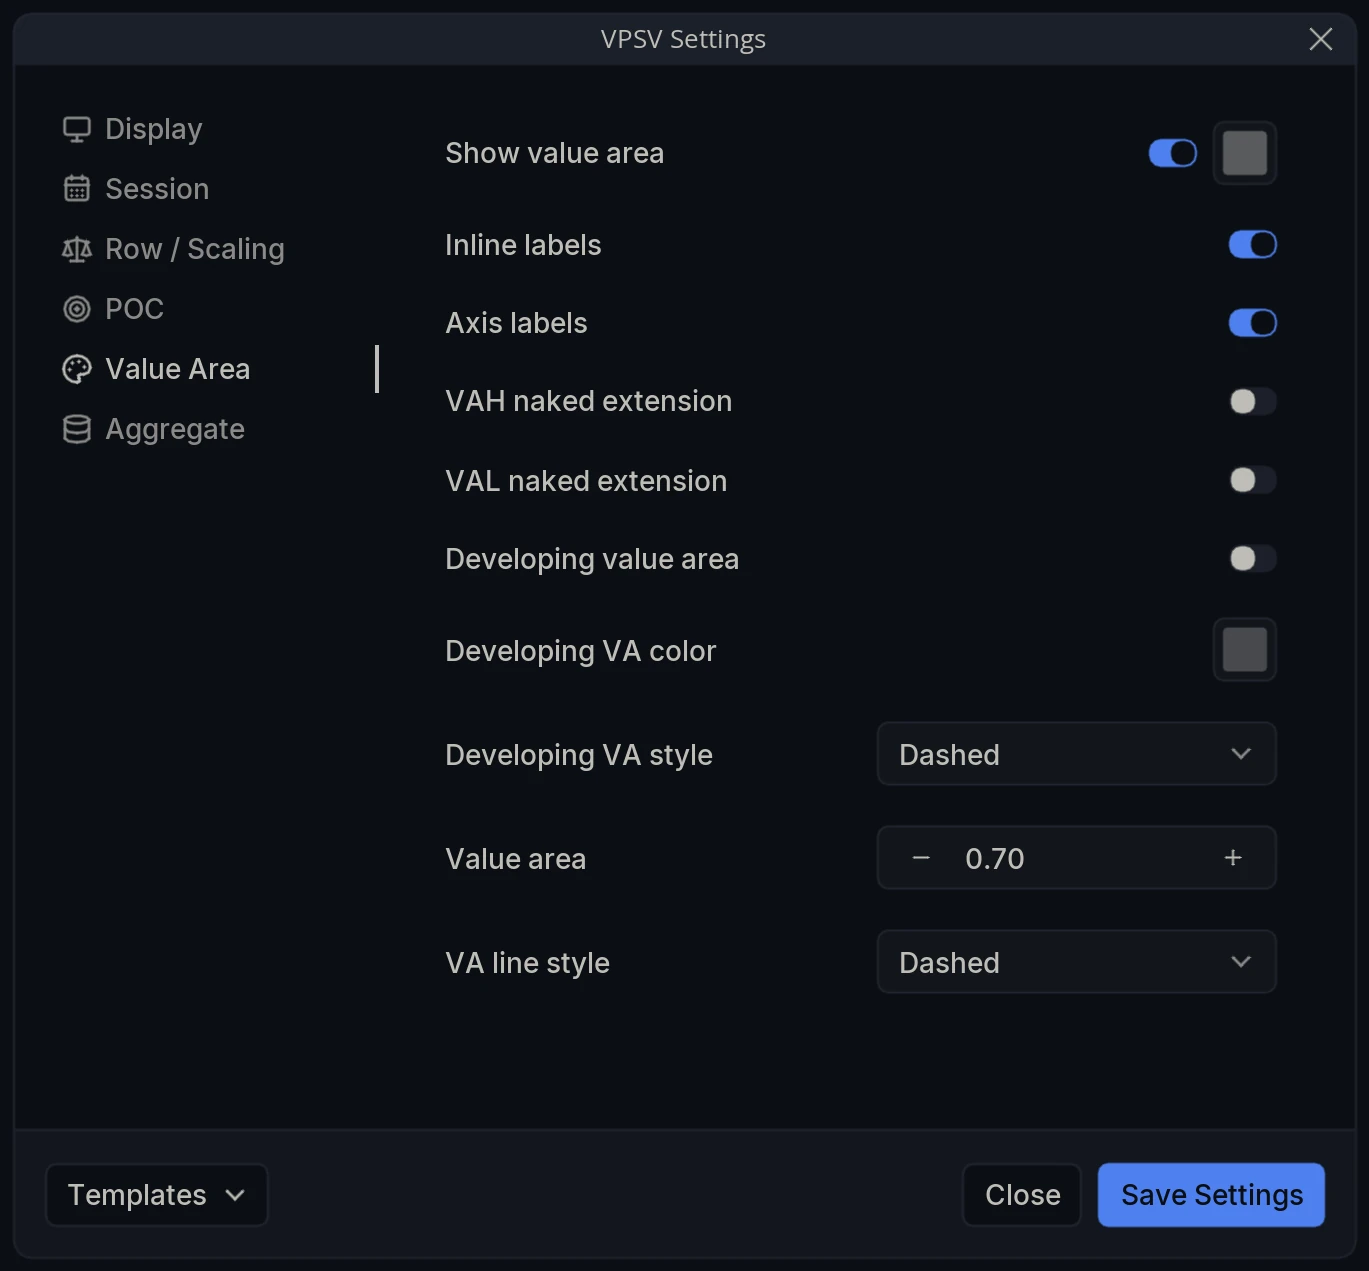
Show value area - Draw the value area high and low lines, with their own color.
Inline labels - Label VAH and VAL on the chart itself.
Axis labels - Label them on the price axis.
VAH naked extension - Extend the value area high forward until price trades back to it.
VAL naked extension - The same for the value area low.
Developing value area - Plot the value area edges as they expanded and shifted through the session.
Developing VA color - Color of those lines.
Developing VA style - Line style for them, Dashed by default.
Value area - The proportion of total volume the value area contains. 0.70 by default.
VA line style - Line style for the finished value area lines.
Aggregate
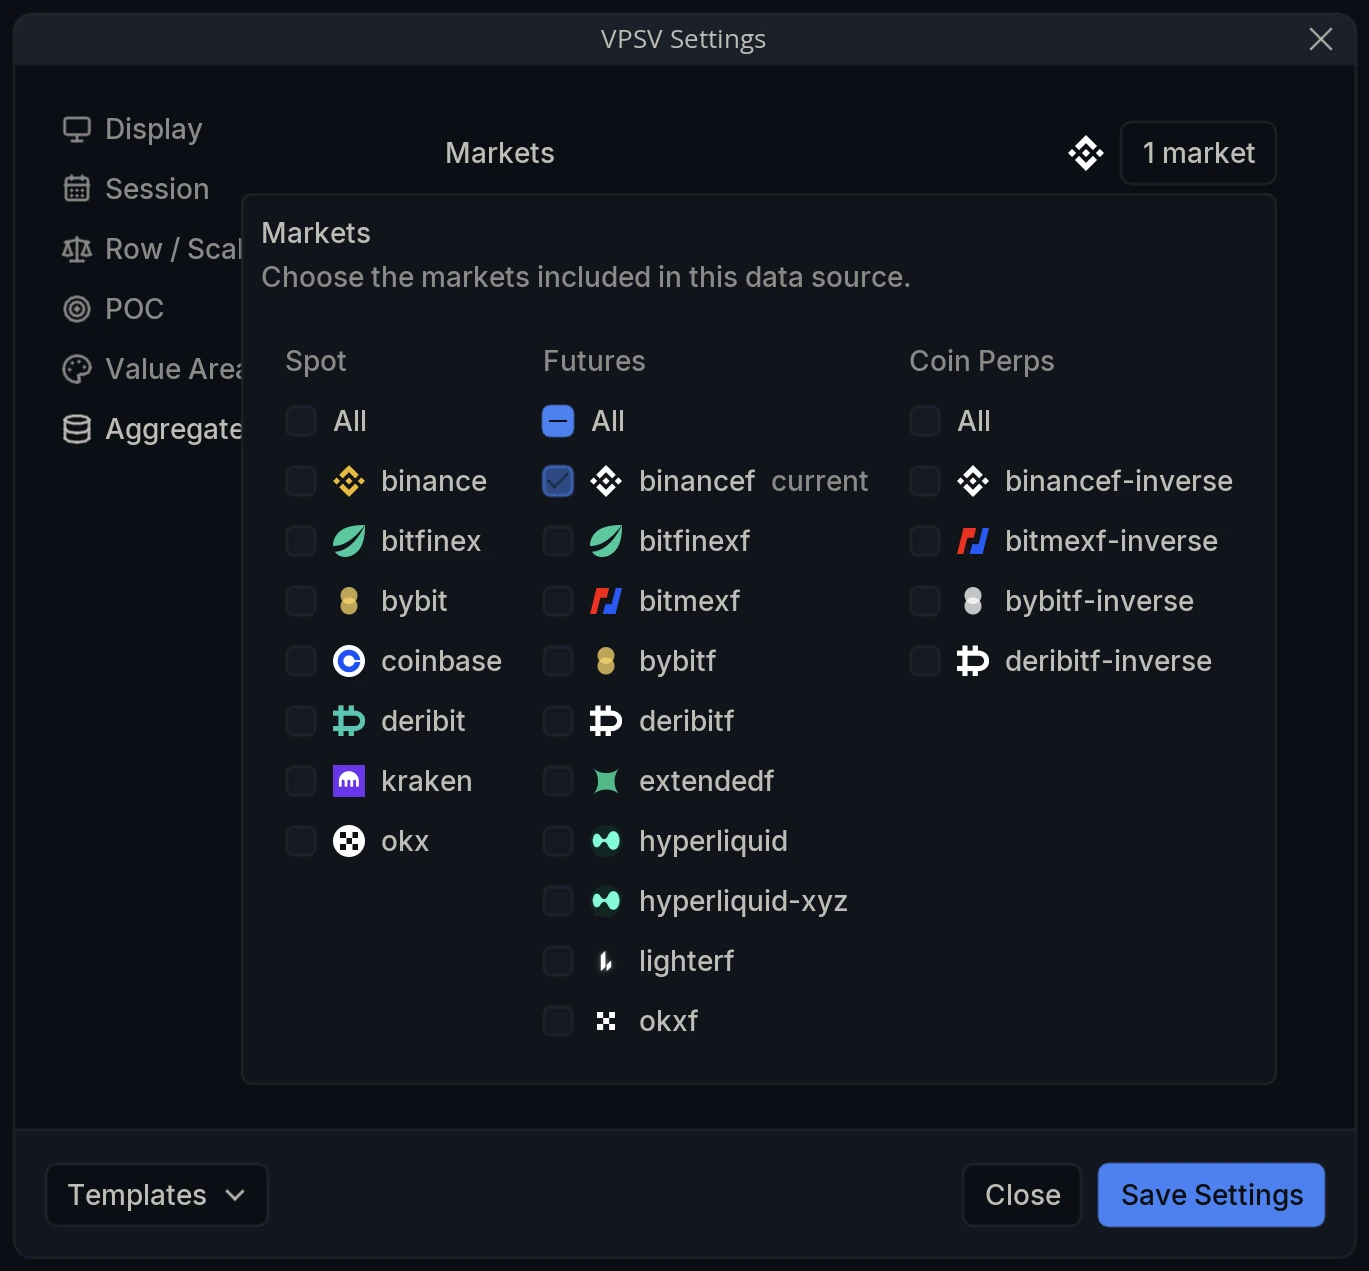
Markets - Choose the markets included in the profile. The selector is grouped into Spot, Futures and Coin Perps, with an All toggle per group; your chart’s own market is tagged current. Combining venues builds each session’s profile from their pooled volume rather than one exchange alone.